Estimated zip code population in 2022: 777 Zip code population in 2010: 973 Zip code population in 2000: 1,105
Houses and condos: 388 Renter-occupied apartments: 79
% of renters here:
23%
State:
33%
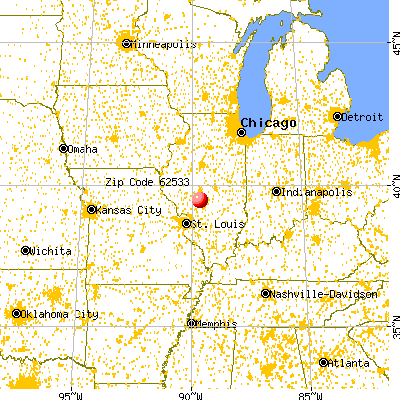
March 2022 cost of living index in zip code 62533: 83.9 (less than average, U.S. average is 100)
Land area: 48.4 sq. mi. Water area: 0.1 sq. mi.
Population density: 16 people per square mile
(very low).
OSM Map
General Map
Google Map
MSN Map
OSM Map
General Map
Google Map
MSN Map
OSM Map
General Map
Google Map
MSN Map
OSM Map
General Map
Google Map
MSN Map
Please wait while loading the map...
Real estate property taxes paid for housing units in 2022:
This zip code:
1.9% ($2,330)
Illinois:
2.0% ($4,912)
Median real estate property taxes paid for housing units with mortgages in 2022: $2,322 (1.9%) Median real estate property taxes paid for housing units with no mortgage in 2022: $2,237 (1.7%)
Business Search- 14 Million verified businesses
Males: 338
(43.6%)
Females: 438
(56.4%)
For population 25 years and over in 62533:
High school or higher: 92.3%
Bachelor's degree or higher: 31.0%
Graduate or professional degree: 11.3%
Unemployed: 1.4%
Mean travel time to work (commute): 24.7 minutes
For population 15 years and over in 62533:
Never married: 22.2%
Now married: 61.7%
Separated: 0.7%
Widowed: 2.5%
Divorced: 12.9%
Zip code 62533 compared to state average:
Median house value below state average.
Unemployed percentage significantly below state average.
Black race population percentage significantly below state average.
Foreign-born population percentage significantly below state average.
Length of stay since moving in below state average.
Averages for the 2020 tax year for zip code 62533, filed in 2021:
Average Adjusted Gross Income (AGI) in 2020: $67,322 (Individual Income Tax Returns)
Here:
$67,322
State:
$82,626
Salary/wage: $50,841 (reported on 82.2% of returns)
Here:
$50,841
State:
$66,640
(% of AGI for various income ranges: 1176.7% for AGIs below $25k, 3387.5% for AGIs $25k-50k, 7550.0% for AGIs $50k-75k, 10360.0% for AGIs $75k-100k, 17828.0% for AGIs $100k-200k)
Taxable interest for individuals: $800 (reported on 40.0% of returns)
This zip code:
$800
Illinois:
$2,376
(% of AGI for various income ranges: 17.8% for AGIs below $25k, 15.0% for AGIs $25k-50k, 47.5% for AGIs $50k-75k, 40.0% for AGIs $75k-100k, 170.0% for AGIs $100k-200k)
Ordinary dividends: $2,862 (reported on 17.8% of returns)
Here:
$2,862
State:
$9,061
(% of AGI for various income ranges: 22.2% for AGIs below $25k, 152.5% for AGIs $50k-75k, 296.0% for AGIs $100k-200k)
Net capital gain/loss in AGI: +$4,414 (reported on 15.6% of returns)
Here:
+$4,414
State:
+$31,684
(% of AGI for various income ranges: 117.5% for AGIs $50k-75k, 524.0% for AGIs $100k-200k)
Profit/loss from business: +$5,580 (reported on 11.1% of returns)
Here:
+$5,580
State:
+$12,175
(% of AGI for various income ranges: 133.3% for AGIs below $25k, 397.5% for AGIs $50k-75k)
Taxable individual retirement arrangement distribution: $17,200 (reported on 6.7% of returns)
62533:
$17,200
Illinois:
$21,613
(% of AGI for various income ranges: 1290.0% for AGIs $50k-75k)
Earned income credit: $1,900 (reported on 11.1% of returns)
Here:
$1,900
State:
$2,311
(% of AGI for various income ranges: 105.6% for AGIs below $25k)
Percentage of individuals using paid preparers for their 2020 taxes: 97.8%
Here:
98%
State:
93%
(% for various income ranges: 100.0% for AGIs below $25k, 100.0% for AGIs $25k-50k, 100.0% for AGIs $50k-75k, 83.3% for AGIs $75k-100k, 100.0% for AGIs $100k-200k)
Averages for the 2012 tax year for zip code 62533, filed in 2013:
Average Adjusted Gross Income (AGI) in 2012: $57,522 (Individual Income Tax Returns)
Here:
$57,522
State:
$68,058
Salary/wage: $43,585 (reported on 83.7% of returns)
Here:
$43,585
State:
$55,396
(% of AGI for various income ranges: 69.8% for AGIs below $25k, 72.0% for AGIs $25k-50k, 71.5% for AGIs $50k-75k, 71.1% for AGIs $75k-100k, 53.8% for AGIs $100k-200k)
Taxable interest for individuals: $927 (reported on 44.9% of returns)
This zip code:
$927
Illinois:
$1,969
(% of AGI for various income ranges: 2.2% for AGIs below $25k, 1.0% for AGIs $25k-50k, 0.3% for AGIs $50k-75k, 0.2% for AGIs $75k-100k, 0.7% for AGIs $100k-200k)
Ordinary dividends: $1,927 (reported on 22.4% of returns)
Here:
$1,927
State:
$7,786
(% of AGI for various income ranges: 2.7% for AGIs below $25k, 0.7% for AGIs $50k-75k, 0.9% for AGIs $100k-200k)
Profit/loss from business: +$4,000 (reported on 10.2% of returns)
Here:
+$4,000
State:
+$12,903
Taxable individual retirement arrangement distribution: $7,720 (reported on 10.2% of returns)
62533:
$7,720
Illinois:
$17,929
(% of AGI for various income ranges: 4.5% for AGIs below $25k, 5.8% for AGIs $50k-75k)
Total itemized deductions: $16,646 (16% of AGI, reported on 26.5% of returns)
Here:
$16,646
State:
$26,433
Here:
16.1% of AGI
State:
19.2% of AGI
(% of AGI for various income ranges: 11.9% for AGIs $25k-50k, 12.4% for AGIs $50k-75k, 8.5% for AGIs $100k-200k)
Charity contributions: $3,400 (reported on 18.4% of returns)
Here:
$3,400
State:
$4,525
Taxes paid: $7,615 (reported on 26.5% of returns)
62533:
$7,615
State:
$11,968
(% of AGI for various income ranges: 2.6% for AGIs $25k-50k, 4.6% for AGIs $50k-75k, 5.2% for AGIs $100k-200k)
Earned income credit: $2,043 (reported on 14.3% of returns)
Here:
$2,043
State:
$2,349
(% of AGI for various income ranges: 6.7% for AGIs below $25k)
Percentage of individuals using paid preparers for their 2012 taxes: 55.1%
Here:
55%
State:
57%
(% for various income ranges: 52.9% for AGIs below $25k, 45.5% for AGIs $25k-50k, 62.5% for AGIs $50k-75k, 60.0% for AGIs $75k-100k, 62.5% for AGIs $100k-200k)
Averages for the 2004 tax year for zip code 62533, filed in 2005:
Average Adjusted Gross Income (AGI) in 2004: $38,771 (Individual Income Tax Returns)
Here:
$38,771
State:
$54,625
Salary/wage: $34,763 (reported on 81.1% of returns)
Here:
$34,763
State:
$46,811
(% of AGI for various income ranges: 85.6% for AGIs below $10k, 70.2% for AGIs $10k-25k, 71.0% for AGIs $25k-50k, 77.6% for AGIs $50k-75k, 67.6% for AGIs $75k-100k, 71.9% for AGIs over 100k)
Taxable interest for individuals: $1,007 (reported on 51.8% of returns)
This zip code:
$1,007
Illinois:
$2,101
(% of AGI for various income ranges: 2.8% for AGIs below $10k, 3.1% for AGIs $10k-25k, 1.5% for AGIs $25k-50k, 1.4% for AGIs $50k-75k, 0.7% for AGIs $75k-100k, 0.5% for AGIs over 100k)
Taxable dividends: $939 (reported on 25.0% of returns)
Here:
$939
State:
$4,306
(% of AGI for various income ranges: 2.4% for AGIs below $10k, 0.9% for AGIs $10k-25k, 0.8% for AGIs $25k-50k, 0.6% for AGIs $50k-75k, 0.4% for AGIs $75k-100k, 0.1% for AGIs over 100k)
Net capital gain/loss: +$1,301 (reported on 17.7% of returns)
Here:
+$1,301
State:
+$17,321
(% of AGI for various income ranges: -0.2% for AGIs $10k-25k, 0.2% for AGIs $25k-50k, 0.5% for AGIs $50k-75k, 0.5% for AGIs $75k-100k, 1.9% for AGIs over 100k)
Profit/loss from business: +$1,057 (reported on 13.3% of returns)
Here:
+$1,057
State:
+$11,771
(% of AGI for various income ranges: 1.4% for AGIs $10k-25k, 0.6% for AGIs $25k-50k, 0.0% for AGIs $50k-75k, 0.4% for AGIs $75k-100k)
Profit/loss from farming: +$8,114 (reported on 6.7% of returns)
Here:
+$8,114
State:
+$2,327
Total itemized deductions: $14,061 (22% of AGI, reported on 21.9% of returns)
Here:
$14,061
State:
$20,239
Here:
22.3% of AGI
State:
19.5% of AGI
(% of AGI for various income ranges: 8.1% for AGIs $10k-25k, 7.5% for AGIs $25k-50k, 8.2% for AGIs $50k-75k, 8.5% for AGIs $75k-100k, 8.5% for AGIs over 100k)
Charity contributions deductions: $2,632 (4% of AGI, reported on 18.1% of returns)
Here:
$2,632
State:
$3,719
Here:
4.1% of AGI
State:
3.4% of AGI
(% of AGI for various income ranges: 1.9% for AGIs $10k-25k, 0.5% for AGIs $25k-50k, 1.4% for AGIs $50k-75k, 1.3% for AGIs $75k-100k, 1.5% for AGIs over 100k)
Total tax: $4,778 (reported on 78.9% of returns)
62533:
$4,778
State:
$9,882
(% of AGI for various income ranges: 2.6% for AGIs below $10k, 4.4% for AGIs $10k-25k, 7.9% for AGIs $25k-50k, 9.5% for AGIs $50k-75k, 11.8% for AGIs $75k-100k, 14.4% for AGIs over 100k)
Earned income credit: $1,542 (reported on 9.1% of returns)
Here:
$1,542
State:
$1,788
Percentage of individuals using paid preparers for their 2004 taxes: 59.4%
Here:
59%
State:
61%
(% for various income ranges: 46.3% for AGIs below $10k, 63.0% for AGIs $10k-25k, 59.7% for AGIs $25k-50k, 67.3% for AGIs $50k-75k, 59.1% for AGIs $75k-100k, 65.5% for AGIs over 100k)
Household received Food Stamps/SNAP in the past 12 months: 44 Household did not receive Food Stamps/SNAP in the past 12 months: 296
Women who had a birth in the past 12 months: 10 (8 now married, 1 unmarried) Women who did not have a birth in the past 12 months: 132 (70 now married, 61 unmarried)
Housing units in zip code 62533 with a mortgage: 170 (7 second mortgage, 5 both second mortgage and home equity loan) Median monthly owner costs for units with a mortgage: $1,044 Median monthly owner costs for units without a mortgage: $634
Residents with income below the poverty level in 2022:
This zip code:
11.5%
Whole state:
11.9%
Residents with income below 50% of the poverty level in 2022:
This zip code:
2.6%
Whole state:
5.7%
Median number of rooms in houses and condos:
Here:
6.3
State:
6.4
Median number of rooms in apartments:
Here:
4.8
State:
4.1
Notable locations in this zip code not listed on our city pages
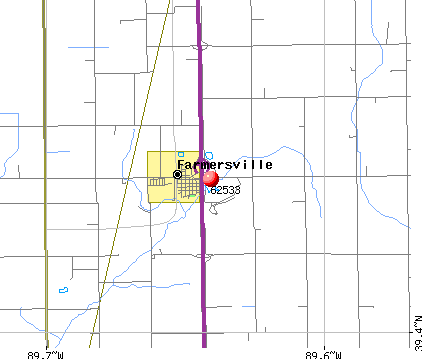
Notable locations in zip code 62533: Farmersville - Waggoner Area Ambulance Service (A), Farmersville - Waggoner Volunteer Fire Department (B). Display/hide their locations on the map
Size of family households: 95 2-persons, 45 3-persons, 11 4-persons, 31 5-persons, 8 6-persons, 29 7-or-more-persons
Size of nonfamily households: 82 1-person, 34 2-persons, 4 3-persons
174 married couples with children.
53 single-parent households (10 men, 43 women).
94.4% of residents of 62533 zip code speak English at home.
3.1% of residents speak Spanish at home (81% very well, 19% not well).
1.0% of residents speak other Indo-European language at home (100% very well).
0.4% of residents speak Asian or Pacific Island language at home (100% very well).
Foreign born population: 21 (2.7%) (43.1% of them are naturalized citizens)
This zip code:
2.7%
Whole state:
14.4%
38%Honduras
33%France
14%Hong Kong
10%Nicaragua
24%Italian
23%German
16%American
11%English
8%Irish
2%Scotch-Irish
1%Swedish
Year of entry for the foreign-born population
32010 or later
82000 to 2009
61990 to 1999
3Before 1990
Facilities with environmental interests located in this zip code:
M & M SERVICE CO (RURAL ROUTE 1 in FARMERSVILLE, IL)
STATE MASTER (Illinois EPA Project) - AIR PROGRAM AIR MINOR (AIRS/AFS) CRITERIA AND HAZARDOUS AIR POLLUTANT INVENTORY (Inventory of air pollution sources) Business SIC classification: GRAIN AND FIELD BEANS Alternative names: M& M SERVICE COMPANY-THOMASVILLE ELEV
HENDRICKS BROS (CITY in FARMERSVILLE, IL)
STATE MASTER (Illinois EPA Project) - AIR PROGRAM AIR MINOR (AIRS/AFS) Business SIC classification: PETROLEUM BULK STATIONS AND TERMINALS
KIPIN FUELS LLC (3 MILES WEST OF FARMERSVILLE in FARMERSVILLE, IL)
STATE MASTER (Illinois EPA Project) - AIR PROGRAM AIR MINOR (AIRS/AFS) Business SIC classification: PRODUCTS OF PETROLEUM AND COAL
IL BRG 068-0037 (CH 17 OVR FAI 55 in FARMERSVILLE, IL)
Small Quantity Generators, between 100 kg and 1000 kg of hazardous waste/month (Resource Conservation and Recovery Act (tracking hazardous waste)) - notification Organizations: IDOT (CONTACT/OWNER)
ILDOT BRG 068 0040 (TR 37 OVER FAI 55 in FARMERSVILLE, IL)
Small Quantity Generators, between 100 kg and 1000 kg of hazardous waste/month (Resource Conservation and Recovery Act (tracking hazardous waste)) - notification
JUMPIN JIMMY'S (30239 W. FRONTAGE ROAD in FARMERSVILLE, IL)
ENFORCEMENT/COMPLIANCE ACTIVITY (Integrated Compliance Information System)
M & M SERVICE CO. - THOMASVILLE SITE (2229 THOMASVILLE TRAIL in FARMERSVILLE, IL)
ENFORCEMENT/COMPLIANCE ACTIVITY (Integrated Compliance Information System)
Housing units lacking complete plumbing facilities: 1.3% Housing units lacking complete kitchen facilities: 1.7%
54.3%Utility gas
27.8%Electricity
17.6%Bottled, tank, or LP gas
0.6%No fuel used
Population in 1990: 1,047. Population change in the 1990s: +58 (+5.5%).
Place of birth for U.S.-born residents:
This state: 531
Northeast: 5
Midwest: 124
South: 18
West: 76
63% of the 62533 zip code residents lived in the same house 5 years ago. Out of people who lived in different houses, 32% lived in this county. Out of people who lived in different counties, 50% lived in Illinois.
94% of the 62533 zip code residents lived in the same house 1 year ago. Out of people who lived in different houses, 37% moved from this county. Out of people who lived in different houses, 33% moved from different county within same state. Out of people who lived in different houses, 27% moved from different state.
Private vs. public school enrollment:
Students in private schools in grades 1 to 8 (elementary and middle school): 26
Here:
29.1%
Illinois:
13.3%
Students in private schools in grades 9 to 12 (high school): 5
Here:
74.9%
Illinois:
9.9%
Students in private undergraduate colleges:
Here:
0.0%
Illinois:
27.4%
Occupation by median earnings in the past 12 months ($)
82,616Business and financial operations occupations
69,993Transportation occupations
57,198Construction and extraction occupations
56,880Health diagnosing and treating practitioners and other technical occupations
54,335Community and social service occupations
46,797Installation, maintenance, and repair occupations
Companies with federal contracts located in this zip code:
INTERSTATE HYDRAULICS INC (207 NEWTON in FARMERSVILLE, IL; small business) : $56,690 in 7 contractsfrom 2003 to 2005
Contracts for Valves, Powered, Boring Machines, Maintenance, Repair and Rebuilding of Equipment -- Miscellaneous, Miscellaneous Special Industry Machinery by U.S. Army Corps of Engineers - civil program financing only, Army Signed by year:2000: $0; 2001: $0; 2002: $0; 2003: $37,750; 2004: $0; 2005: $18,940; 2006: $0.
Biggest contracts:
$20,000 with U.S. Army Corps of Engineers - civil program financing only for Valves, Powered. Signed on 2003-07-08. Completion date: 2003-06-24.
$17,750, same as above.Signed on 2003-07-09. Completion date: 2003-06-24.
$3,990 with U.S. Army Corps of Engineers - civil program financing only for Boring Machines. Signed on 2005-01-18. Completion date: 2005-01-12.
$3,990 with Army for Boring Machines. Signed on 2005-01-18. Completion date: 2005-01-12.
Top industries in this zip code by the number of employees in 2005:
Other Services (except Public Administration): Commercial and Industrial Machinery and Equipment (except Automotive and Electronic) Repair and Maintenance (10-19 employees: 1 establishment, 1-4 employees: 1 establishment)
Construction: Commercial and Institutional Building Construction (10-19: 1)
Finance and Insurance: Insurance Agencies and Brokerages (10-19: 1)
Professional, Scientific, and Technical Services: Landscape Architectural Services (10-19: 1)
Wholesale Trade: Grain and Field Bean Merchant Wholesalers (5-9: 1, 1-4: 2)
Finance and Insurance: Commercial Banking (5-9: 1, 1-4: 1)
Other Services (except Public Administration): Religious Organizations (5-9: 1, 1-4: 1)
Fatal accident statistics in 2014:
Fatal accident count: 1
Vehicles involved in fatal accidents: 1
Fatal accidents caused by drunken drivers: 1
Fatalities: 1
Persons involved in fatal accidents: 1
Pedestrians involved in fatal accidents: 0
Fatal accident statistics in 2012:
Fatal accident count: 1
Vehicles involved in fatal accidents: 1
Fatal accidents caused by drunken drivers: 0
Fatalities: 1
Persons involved in fatal accidents: 1
Pedestrians involved in fatal accidents: 0
2002 - 2018 National Fire Incident Reporting System (NFIRS) incidents
According to the data from the years 2002 - 2018 the average number of fire incidents per year is 6. The highest number of fire incidents - 14 took place in 2008, and the least - 0 in 2005. The data has a dropping trend.
When looking into fire subcategories, the most reports belonged to: Outside Fires (43.6%), and Mobile Property/Vehicle Fires (27.3%).
Fire incident types reported to NFIRS in Zip Code 62533


 Nearest zip codes: 62572, 62530, 62538, 62560, 62558, 62690.


 According to the data from the years 2002 - 2018 the average number of fire incidents per year is 6. The highest number of fire incidents - 14 took place in 2008, and the least - 0 in 2005. The data has a dropping trend.
 When looking into fire subcategories, the most reports belonged to: Outside Fires (43.6%), and Mobile Property/Vehicle Fires (27.3%).