Estimated zip code population in 2022: 1,388 Zip code population in 2010: 1,508 Zip code population in 2000: 1,405
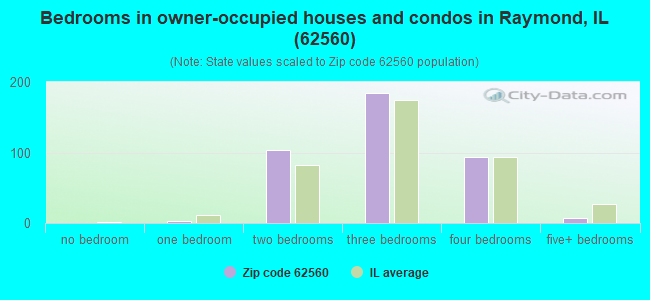
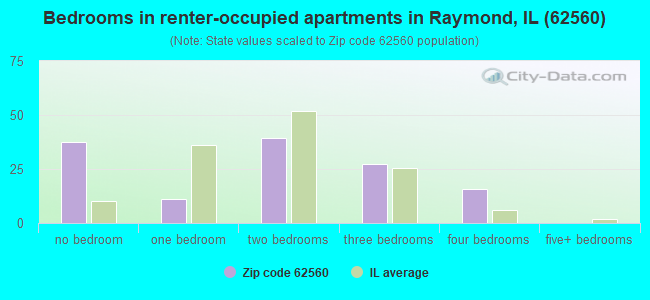
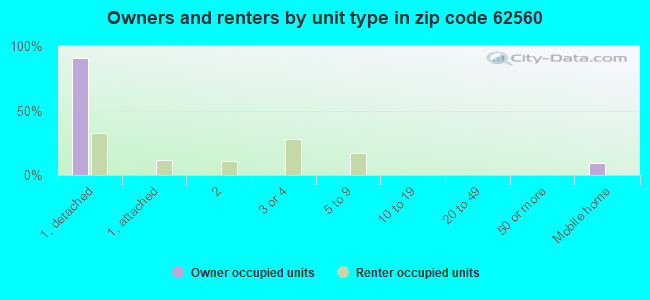
Houses and condos: 563 Renter-occupied apartments: 129
% of renters here:
25%
State:
33%
March 2022 cost of living index in zip code 62560: 83.7 (less than average, U.S. average is 100)
Land area: 63.6 sq. mi. Water area: 0.1 sq. mi.
Population density: 22 people per square mile
(very low).
OSM Map
General Map
Google Map
MSN Map
OSM Map
General Map
Google Map
MSN Map
OSM Map
General Map
Google Map
MSN Map
OSM Map
General Map
Google Map
MSN Map
Please wait while loading the map...
Real estate property taxes paid for housing units in 2022:
This zip code:
1.8% ($1,954)
Illinois:
2.0% ($4,912)
Median real estate property taxes paid for housing units with mortgages in 2022: $2,312 (2.3%) Median real estate property taxes paid for housing units with no mortgage in 2022: $1,657 (1.5%)
Business Search- 14 Million verified businesses
Males: 711
(51.2%)
Females: 677
(48.8%)
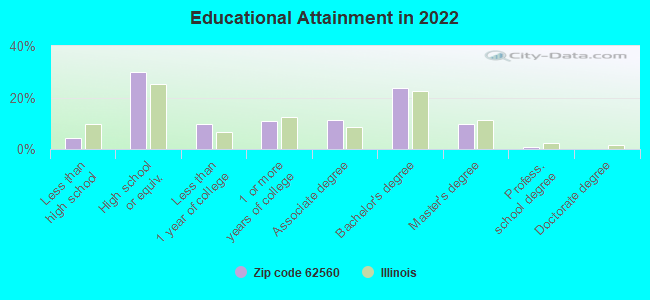
For population 25 years and over in 62560:
High school or higher: 95.0%
Bachelor's degree or higher: 33.7%
Graduate or professional degree: 10.5%
Unemployed: 3.5%
Mean travel time to work (commute): 22.9 minutes
For population 15 years and over in 62560:
Never married: 27.5%
Now married: 54.1%
Separated: 1.7%
Widowed: 6.2%
Divorced: 10.6%
Zip code 62560 compared to state average:
Median house value significantly below state average.
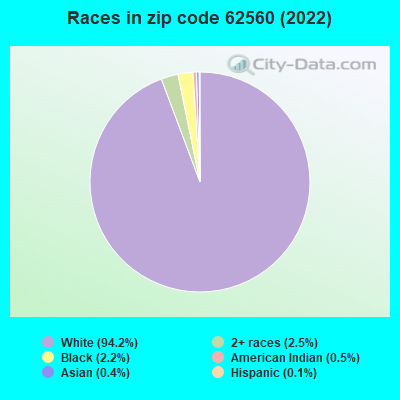
Black race population percentage significantly below state average.
Hispanic race population percentage significantly below state average.
Foreign-born population percentage significantly below state average.
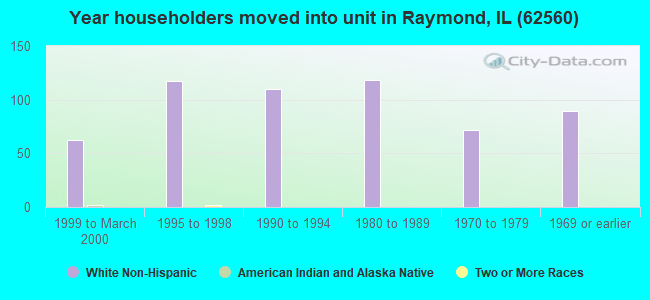
Length of stay since moving in above state average.
Estimated median house/condo value in 2022: $105,859
62560:
$105,859
Illinois:
$251,600
According to our research of Illinois and other state lists, there was 1 registered sex offender living in 62560 zip code as of May 30, 2024. The ratio of all residents to sex offenders in zip code 62560 is 1,268 to 1. The ratio of registered sex offenders to all residents in this zip code is lower than the state average.
Median resident age:
This zip code:
36.1 years
Illinois median age:
39.1 years
Average household size:
This zip code:
2.7 people
Illinois:
2.4 people
Averages for the 2020 tax year for zip code 62560, filed in 2021:
Average Adjusted Gross Income (AGI) in 2020: $64,314 (Individual Income Tax Returns)
Here:
$64,314
State:
$82,626
Salary/wage: $47,613 (reported on 78.3% of returns)
Here:
$47,613
State:
$66,640
(% of AGI for various income ranges: 1125.4% for AGIs below $25k, 3403.3% for AGIs $25k-50k, 5707.1% for AGIs $50k-75k, 9556.0% for AGIs $75k-100k, 18985.0% for AGIs $100k-200k)
Taxable interest for individuals: $1,245 (reported on 44.9% of returns)
This zip code:
$1,245
Illinois:
$2,376
(% of AGI for various income ranges: 32.3% for AGIs below $25k, 37.5% for AGIs $25k-50k, 57.1% for AGIs $50k-75k, 84.0% for AGIs $75k-100k, 361.7% for AGIs $100k-200k)
Ordinary dividends: $2,394 (reported on 24.6% of returns)
Here:
$2,394
State:
$9,061
(% of AGI for various income ranges: 24.6% for AGIs below $25k, 54.2% for AGIs $25k-50k, 108.0% for AGIs $75k-100k, 426.7% for AGIs $100k-200k)
Net capital gain/loss in AGI: +$5,621 (reported on 20.3% of returns)
Here:
+$5,621
State:
+$31,684
(% of AGI for various income ranges: 4.6% for AGIs below $25k, 18.3% for AGIs $25k-50k, 4.0% for AGIs $75k-100k, 1261.7% for AGIs $100k-200k)
Profit/loss from business: +$3,580 (reported on 14.5% of returns)
Here:
+$3,580
State:
+$12,175
(% of AGI for various income ranges: 146.2% for AGIs below $25k, 50.0% for AGIs $50k-75k, 221.7% for AGIs $100k-200k)
Taxable individual retirement arrangement distribution: $18,833 (reported on 13.0% of returns)
62560:
$18,833
Illinois:
$21,613
(% of AGI for various income ranges: 149.2% for AGIs below $25k, 801.4% for AGIs $50k-75k, 1566.7% for AGIs $100k-200k)
Earned income credit: $2,240 (reported on 14.5% of returns)
Here:
$2,240
State:
$2,311
(% of AGI for various income ranges: 103.1% for AGIs below $25k, 75.0% for AGIs $25k-50k)
Percentage of individuals using paid preparers for their 2020 taxes: 97.1%
Here:
97%
State:
93%
(% for various income ranges: 95.0% for AGIs below $25k, 100.0% for AGIs $25k-50k, 100.0% for AGIs $50k-75k, 100.0% for AGIs $75k-100k, 107.7% for AGIs $100k-200k, 0.0% for AGIs over 200k)
Averages for the 2012 tax year for zip code 62560, filed in 2013:
Average Adjusted Gross Income (AGI) in 2012: $58,732 (Individual Income Tax Returns)
Here:
$58,732
State:
$68,058
Salary/wage: $40,231 (reported on 79.7% of returns)
Here:
$40,231
State:
$55,396
(% of AGI for various income ranges: 75.0% for AGIs below $25k, 74.6% for AGIs $25k-50k, 56.8% for AGIs $50k-75k, 64.7% for AGIs $75k-100k, 41.1% for AGIs $100k-200k)
Taxable interest for individuals: $1,497 (reported on 55.1% of returns)
This zip code:
$1,497
Illinois:
$1,969
(% of AGI for various income ranges: 2.1% for AGIs below $25k, 1.6% for AGIs $25k-50k, 2.2% for AGIs $50k-75k, 1.3% for AGIs $75k-100k, 1.0% for AGIs $100k-200k)
Ordinary dividends: $2,510 (reported on 29.0% of returns)
Here:
$2,510
State:
$7,786
(% of AGI for various income ranges: 1.4% for AGIs below $25k, 0.4% for AGIs $25k-50k, 1.1% for AGIs $50k-75k, 1.9% for AGIs $75k-100k, 1.3% for AGIs $100k-200k)
Net capital gain/loss in AGI: +$10,538 (reported on 18.8% of returns)
Here:
+$10,538
State:
+$22,183
(% of AGI for various income ranges: 0.2% for AGIs below $25k, 0.4% for AGIs $50k-75k, 7.4% for AGIs $100k-200k)
Profit/loss from business: +$8,791 (reported on 15.9% of returns)
Here:
+$8,791
State:
+$12,903
(% of AGI for various income ranges: 0.3% for AGIs below $25k, 2.1% for AGIs $25k-50k, 2.7% for AGIs $50k-75k, 3.5% for AGIs $100k-200k)
Taxable individual retirement arrangement distribution: $5,811 (reported on 13.0% of returns)
62560:
$5,811
Illinois:
$17,929
(% of AGI for various income ranges: 4.2% for AGIs $25k-50k, 1.9% for AGIs $50k-75k, 2.1% for AGIs $75k-100k)
Total itemized deductions: $18,606 (17% of AGI, reported on 24.6% of returns)
Here:
$18,606
State:
$26,433
Here:
17.3% of AGI
State:
19.2% of AGI
(% of AGI for various income ranges: 10.1% for AGIs $25k-50k, 7.7% for AGIs $50k-75k, 6.0% for AGIs $75k-100k, 8.9% for AGIs $100k-200k)
Charity contributions: $3,550 (reported on 17.4% of returns)
Here:
$3,550
State:
$4,525
(% of AGI for various income ranges: 2.0% for AGIs below $25k, 0.8% for AGIs $50k-75k, 1.2% for AGIs $75k-100k, 1.3% for AGIs $100k-200k)
Taxes paid: $7,100 (reported on 24.6% of returns)
62560:
$7,100
State:
$11,968
(% of AGI for various income ranges: 2.2% for AGIs $25k-50k, 2.7% for AGIs $50k-75k, 2.2% for AGIs $75k-100k, 4.1% for AGIs $100k-200k)
Earned income credit: $2,189 (reported on 13.0% of returns)
Here:
$2,189
State:
$2,349
(% of AGI for various income ranges: 5.5% for AGIs below $25k, 1.1% for AGIs $25k-50k)
Percentage of individuals using paid preparers for their 2012 taxes: 66.7%
Here:
67%
State:
57%
(% for various income ranges: 56.5% for AGIs below $25k, 66.7% for AGIs $25k-50k, 75.0% for AGIs $50k-75k, 75.0% for AGIs $75k-100k, 72.7% for AGIs $100k-200k)
Averages for the 2004 tax year for zip code 62560, filed in 2005:
Average Adjusted Gross Income (AGI) in 2004: $42,485 (Individual Income Tax Returns)
Here:
$42,485
State:
$54,625
Salary/wage: $34,518 (reported on 81.0% of returns)
Here:
$34,518
State:
$46,811
(% of AGI for various income ranges: 135.0% for AGIs below $10k, 68.9% for AGIs $10k-25k, 69.2% for AGIs $25k-50k, 70.4% for AGIs $50k-75k, 70.4% for AGIs $75k-100k, 46.8% for AGIs over 100k)
Taxable interest for individuals: $1,830 (reported on 55.0% of returns)
This zip code:
$1,830
Illinois:
$2,101
(% of AGI for various income ranges: 9.8% for AGIs below $10k, 4.7% for AGIs $10k-25k, 2.2% for AGIs $25k-50k, 2.3% for AGIs $50k-75k, 0.7% for AGIs $75k-100k, 2.7% for AGIs over 100k)
Taxable dividends: $1,301 (reported on 32.1% of returns)
Here:
$1,301
State:
$4,306
(% of AGI for various income ranges: 4.6% for AGIs below $10k, 0.9% for AGIs $10k-25k, 0.8% for AGIs $25k-50k, 1.4% for AGIs $50k-75k, 0.9% for AGIs $75k-100k, 0.5% for AGIs over 100k)
Net capital gain/loss: +$8,290 (reported on 23.0% of returns)
Here:
+$8,290
State:
+$17,321
(% of AGI for various income ranges: -5.6% for AGIs below $10k, 0.6% for AGIs $10k-25k, 0.6% for AGIs $25k-50k, 1.7% for AGIs $50k-75k, 0.9% for AGIs $75k-100k, 17.5% for AGIs over 100k)
Profit/loss from business: +$3,396 (reported on 19.0% of returns)
Here:
+$3,396
State:
+$11,771
(% of AGI for various income ranges: -3.9% for AGIs below $10k, 4.0% for AGIs $10k-25k, 3.6% for AGIs $25k-50k, 0.5% for AGIs $50k-75k, 1.4% for AGIs $75k-100k)
Profit/loss from farming: +$12,179 (reported on 7.9% of returns)
Here:
+$12,179
State:
+$2,327
IRA payment deduction: $2,759 (reported on 4.1% of returns)
62560:
$2,759
Illinois:
$3,087
Total itemized deductions: $14,224 (20% of AGI, reported on 21.6% of returns)
Here:
$14,224
State:
$20,239
Here:
19.8% of AGI
State:
19.5% of AGI
(% of AGI for various income ranges: 51.1% for AGIs below $10k, 7.0% for AGIs $25k-50k, 6.8% for AGIs $50k-75k, 8.6% for AGIs $75k-100k, 6.8% for AGIs over 100k)
Charity contributions deductions: $2,765 (4% of AGI, reported on 16.9% of returns)
Here:
$2,765
State:
$3,719
Here:
3.7% of AGI
State:
3.4% of AGI
(% of AGI for various income ranges: 1.1% for AGIs $25k-50k, 1.0% for AGIs $50k-75k, 1.7% for AGIs $75k-100k, 1.2% for AGIs over 100k)
Total tax: $5,631 (reported on 78.7% of returns)
62560:
$5,631
State:
$9,882
(% of AGI for various income ranges: 4.2% for AGIs below $10k, 3.7% for AGIs $10k-25k, 7.8% for AGIs $25k-50k, 9.1% for AGIs $50k-75k, 12.0% for AGIs $75k-100k, 16.3% for AGIs over 100k)
Earned income credit: $1,838 (reported on 11.3% of returns)
Here:
$1,838
State:
$1,788
Percentage of individuals using paid preparers for their 2004 taxes: 72.6%
Here:
73%
State:
61%
(% for various income ranges: 62.9% for AGIs below $10k, 71.2% for AGIs $10k-25k, 74.7% for AGIs $25k-50k, 76.8% for AGIs $50k-75k, 78.6% for AGIs $75k-100k, 78.3% for AGIs over 100k)
Household received Food Stamps/SNAP in the past 12 months: 100 Household did not receive Food Stamps/SNAP in the past 12 months: 425
Women who had a birth in the past 12 months: 57 (36 now married, 21 unmarried) Women who did not have a birth in the past 12 months: 188 (89 now married, 98 unmarried)
Housing units in zip code 62560 with a mortgage: 217 (11 second mortgage, 10 both second mortgage and home equity loan) Median monthly owner costs for units with a mortgage: $1,178 Median monthly owner costs for units without a mortgage: $625
Residents with income below the poverty level in 2022:
This zip code:
17.6%
Whole state:
11.9%
Residents with income below 50% of the poverty level in 2022:
This zip code:
5.4%
Whole state:
5.7%
Median number of rooms in houses and condos:
Here:
6.6
State:
6.4
Median number of rooms in apartments:
Here:
4.2
State:
4.1
Notable locations in this zip code not listed on our city pages
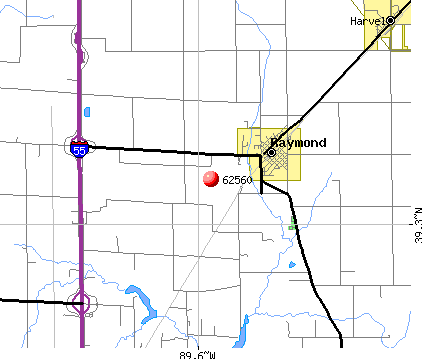
Notable locations in zip code 62560: Shoal Creek Farm (A), Zanesville Townhall (B), Raymond Harville Ambulance Service (C), Raymond - Harville Fire Department (D). Display/hide their locations on the map
Churches in zip code 62560 include: Raymond Christian Church (A), Raymond United Methodist Church (B), Pleasant Hill Church (C). Display/hide their locations on the map
Size of family households: 139 2-persons, 90 3-persons, 55 4-persons, 22 5-persons, 13 6-persons, 33 7-or-more-persons
Size of nonfamily households: 159 1-person, 8 2-persons
226 married couples with children.
105 single-parent households (22 men, 83 women).
96.1% of residents of 62560 zip code speak English at home.
3.1% of residents speak other Indo-European language at home (83% very well, 17% well).
Foreign born population: 11 (0.8%) (72.9% of them are naturalized citizens)
This zip code:
0.8%
Whole state:
14.4%
36%Serbia
36%Lebanon
27%Bhutan
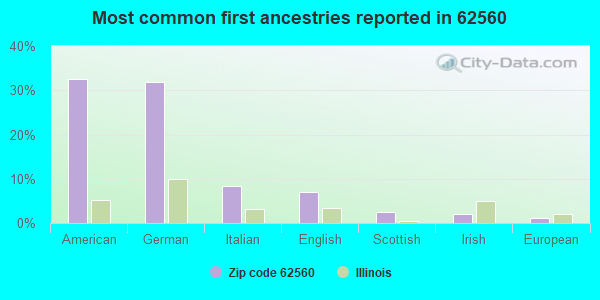
32%American
32%German
8%Italian
7%English
3%Scottish
2%Irish
1%European
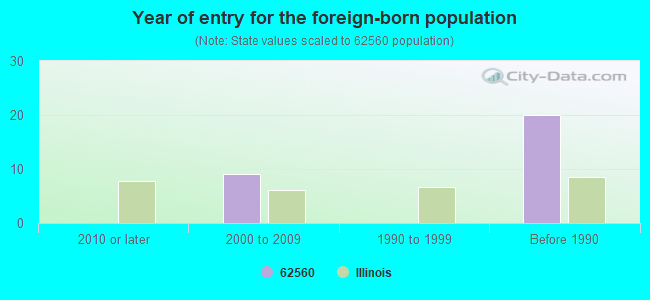
Year of entry for the foreign-born population
02010 or later
92000 to 2009
01990 to 1999
20Before 1990
Major facilities with environmental interests located in this zip code:
HOLIDAY INN CARLINVILLE (I 55 AND ROUTE 108 in RAYMOND, IL)
STATE MASTER (Illinois EPA Project) - National Pollutant Discharge Elimination System Permit National Pollutant Discharge Elimination System NON-MAJOR (Tracking pollutant discharge elimination systems) - permit National Pollutant Discharge Elimination System NON-MAJOR (Tracking pollutant discharge elimination systems) - permit Business SIC classification: SEWERAGE SYSTEMS; HOTELS AND MOTELS
RAYMOND STP (603 NORTH WEST STREET in RAYMOND, IL)
STATE MASTER (Illinois EPA Project) - National Pollutant Discharge Elimination System Permit National Pollutant Discharge Elimination System NON-MAJOR (Tracking pollutant discharge elimination systems) - permit National Pollutant Discharge Elimination System NON-MAJOR (Tracking pollutant discharge elimination systems) - permit Business SIC classification: SEWERAGE SYSTEMS Alternative names: RAYMOND STP, VILLAGE OF, RAYMOND, VILLAGE OF
HOME OIL CO INC (112 E SOUTHWORTH in RAYMOND, IL)
STATE MASTER (Illinois EPA Project) - AIR PROGRAM AIR MINOR (AIRS/AFS) CRITERIA AND HAZARDOUS AIR POLLUTANT INVENTORY (Inventory of air pollution sources) Business SIC classification: PETROLEUM BULK STATIONS AND TERMINALS
POGGENPOHL READY MIX (31 SPARKS in RAYMOND, IL)
STATE MASTER (Illinois EPA Project) - AIR PROGRAM AIR MINOR (AIRS/AFS) CRITERIA AND HAZARDOUS AIR POLLUTANT INVENTORY (Inventory of air pollution sources) Business SIC classification: READY-MIXED CONCRETE; LUMBER AND OTHER BUILDING MATERIALS DEALERS Business NAICS classification: READY-MIX CONCRETE MANUFACTURING. Alternative names: RUSSELL POGGENPOHL
ARMES CUSTOM WOOD FINISHING (108 S RAILROAD in RAYMOND, IL)
STATE MASTER (Illinois EPA Project) - HAZARDOUS WASTE PROGRAM Conditionally Exempt Small Quantity Generators, less than 100 kg/month of hazardous waste (Resource Conservation and Recovery Act (tracking hazardous waste)) Business NAICS classification: WOOD PRESERVATION.
HOME OIL CO (N RAILROAD AND E ST in RAYMOND, IL)
STATE MASTER (Illinois EPA Project) - AIR PROGRAM AIR MINOR (AIRS/AFS) Business SIC classification: PETROLEUM BULK STATIONS AND TERMINALS
KINNEY CONTRACTORS INC (19342 E FRONTAGE RD in RAYMOND, IL)
STATE MASTER (Illinois EPA Project) - AIR PROGRAM AIR MINOR (AIRS/AFS) Business SIC classification: READY-MIXED CONCRETE
MICKS AUTO BODY (307 S RAILROAD ST in RAYMOND, IL)
STATE MASTER (Illinois EPA Project) - HAZARDOUS WASTE PROGRAM Conditionally Exempt Small Quantity Generators, less than 100 kg/month of hazardous waste (Resource Conservation and Recovery Act (tracking hazardous waste))
MONTGOMERY SERVICE CO (RTE 48 in RAYMOND, IL)
STATE MASTER (Illinois EPA Project) - AIR PROGRAM AIR MINOR (AIRS/AFS) Business SIC classification: PETROLEUM BULK STATIONS AND TERMINALS
LINCOLNWOOD HIGH SCHOOL (PO BOX 110 in RAYMOND, IL)
(Geographic Names Information System) (National Center for Education Statistics) - STATE ID-1006800200001 Organizations: PANHANDLE COMM UNIT SCH DIST 2 (SCHOOL DISTRICT)
DAVES COLLISION SHOP (512 N OBANNON in RAYMOND, IL)
STATE MASTER (Illinois EPA Project) - SOLID WASTE PROGRAM, HAZARDOUS WASTE PROGRAM Conditionally Exempt Small Quantity Generators, less than 100 kg/month of hazardous waste (Resource Conservation and Recovery Act (tracking hazardous waste)) - notification Organizations: WATSON DAVID (CONTACT/OWNER)
RAYMOND GRADE SCHOOL (PO BOX 80 in RAYMOND, IL)
(Geographic Names Information System) (National Center for Education Statistics) - STATE ID-1006800202005 Organizations: PANHANDLE COMM UNIT SCH DIST 2 (SCHOOL DISTRICT)
LINCOLNWOOD JR HIGH SCHOOL (P O BOX 110 in RAYMOND, IL)
(National Center for Education Statistics) - STATE ID-1006800201002 Organizations: PANHANDLE COMM UNIT SCH DIST 2 (SCHOOL DISTRICT)
Housing units lacking complete plumbing facilities: 3.3% Housing units lacking complete kitchen facilities: 3.4%
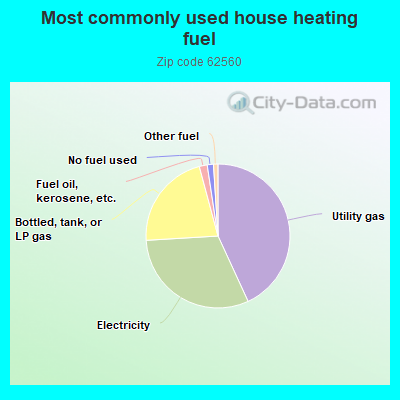
43.4%Utility gas
31.1%Electricity
21.9%Bottled, tank, or LP gas
1.8%Fuel oil, kerosene, etc.
1.4%No fuel used
1.0%Other fuel
Population in 1990: 1,660.
Place of birth for U.S.-born residents:
This state: 1,227
Northeast: 19
Midwest: 43
South: 37
West: 23
71% of the 62560 zip code residents lived in the same house 5 years ago. Out of people who lived in different houses, 66% lived in this county. Out of people who lived in different counties, 50% lived in Illinois.
95% of the 62560 zip code residents lived in the same house 1 year ago. Out of people who lived in different houses, 50% moved from this county. Out of people who lived in different houses, 41% moved from different county within same state. Out of people who lived in different houses, 9% moved from different state.
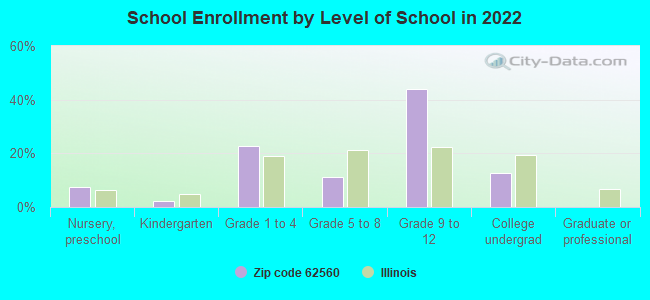
Private vs. public school enrollment:
Students in private schools in grades 1 to 8 (elementary and middle school):
Here:
0.0%
Illinois:
13.3%
Students in private schools in grades 9 to 12 (high school):
Here:
0.0%
Illinois:
9.9%
Students in private undergraduate colleges: 24
Here:
50.4%
Illinois:
27.4%
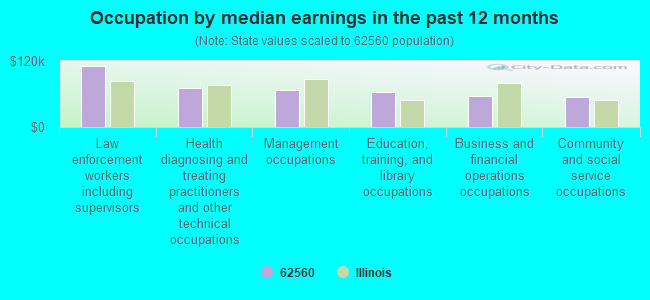
Occupation by median earnings in the past 12 months ($)
111,544Law enforcement workers including supervisors
71,588Health diagnosing and treating practitioners and other technical occupations
67,616Management occupations
63,337Education, training, and library occupations
56,216Business and financial operations occupations
55,241Community and social service occupations
Top industries in this zip code by the number of employees in 2005:
Real Estate and Rental and Leasing: Lessors of Nonresidential Buildings (except Miniwarehouses) (50-99 employees: 1 establishment)
Management of Companies and Enterprises: Offices of Bank Holding Companies (20-49: 1)
Finance and Insurance: Commercial Banking (10-19: 1, 5-9: 1)
Wholesale Trade: Farm and Garden Machinery and Equipment Merchant Wholesalers (10-19: 1, 5-9: 1)
Health Care and Social Assistance: Child Day Care Services (10-19: 1)
Construction: Highway, Street, and Bridge Construction (10-19: 1)
Wholesale Trade: Grain and Field Bean Merchant Wholesalers (10-19: 1)
Fatal accident statistics in 2014:
Fatal accident count: 1
Vehicles involved in fatal accidents: 2
Fatal accidents caused by drunken drivers: 0
Fatalities: 3
Persons involved in fatal accidents: 4
Pedestrians involved in fatal accidents: 0
Fatal accident statistics in 2012:
Fatal accident count: 1
Vehicles involved in fatal accidents: 2
Fatal accidents caused by drunken drivers: 0
Fatalities: 1
Persons involved in fatal accidents: 3
Pedestrians involved in fatal accidents: 1
2002 - 2018 National Fire Incident Reporting System (NFIRS) incidents
According to the data from the years 2002 - 2018 the average number of fire incidents per year is 11. The highest number of fire incidents - 18 took place in 2018, and the least - 2 in 2004. The data has a growing trend.
When looking into fire subcategories, the most reports belonged to: Outside Fires (42.6%), and Mobile Property/Vehicle Fires (27.7%).
Fire incident types reported to NFIRS in Zip Code 62560

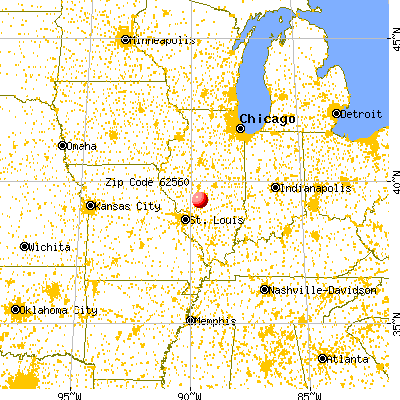


 Nearest zip codes: 62015, 62538, 62572, 62056, 62533, 62089.


 According to the data from the years 2002 - 2018 the average number of fire incidents per year is 11. The highest number of fire incidents - 18 took place in 2018, and the least - 2 in 2004. The data has a growing trend.
 When looking into fire subcategories, the most reports belonged to: Outside Fires (42.6%), and Mobile Property/Vehicle Fires (27.7%).