Estimated zip code population in 2022: 886 Zip code population in 2010: 1,154 Zip code population in 2000: 1,227
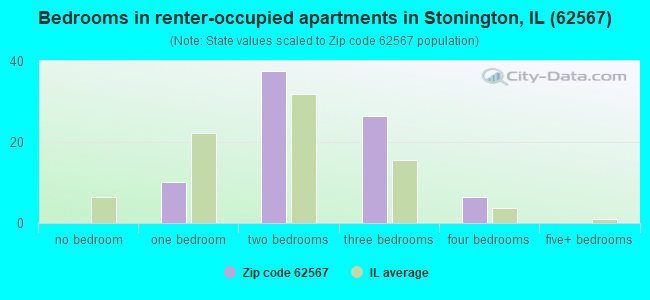
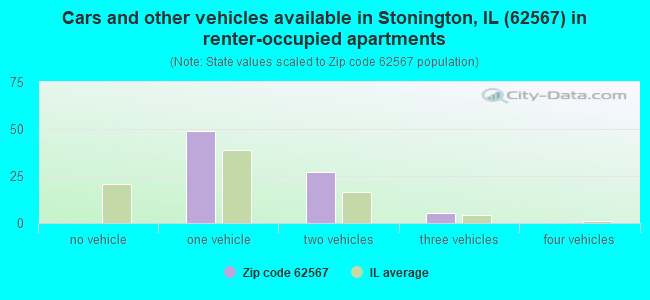
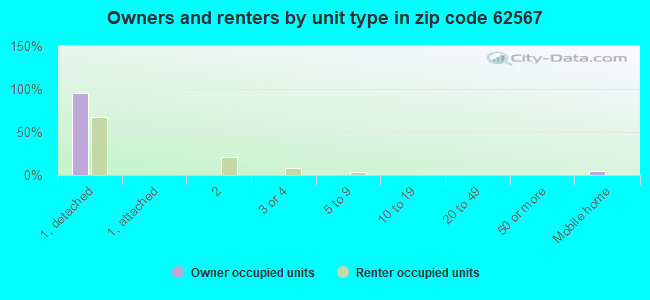
Houses and condos: 455 Renter-occupied apartments: 82
% of renters here:
20%
State:
33%
March 2022 cost of living index in zip code 62567: 84.8 (less than average, U.S. average is 100)
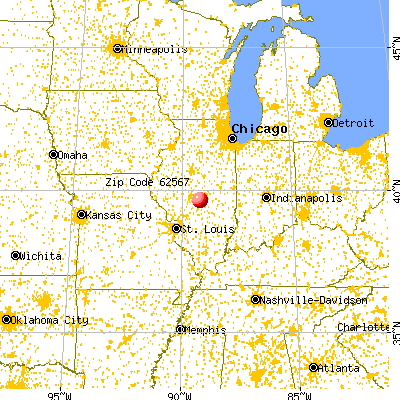
Land area: 38.6 sq. mi. Water area: 0.0 sq. mi.
Population density: 23 people per square mile
(very low).
OSM Map
General Map
Google Map
MSN Map
OSM Map
General Map
Google Map
MSN Map
OSM Map
General Map
Google Map
MSN Map
OSM Map
General Map
Google Map
MSN Map
Please wait while loading the map...
Real estate property taxes paid for housing units in 2022:
This zip code:
1.5% ($1,785)
Illinois:
2.0% ($4,912)
Median real estate property taxes paid for housing units with mortgages in 2022: $1,726 (1.8%) Median real estate property taxes paid for housing units with no mortgage in 2022: $1,894 (1.4%)
Business Search- 14 Million verified businesses
Males: 473
(53.4%)
Females: 413
(46.6%)
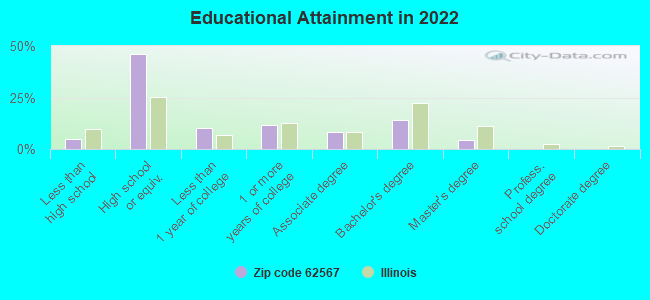
For population 25 years and over in 62567:
High school or higher: 93.7%
Bachelor's degree or higher: 18.5%
Graduate or professional degree: 4.7%
Unemployed: 3.3%
Mean travel time to work (commute): 21.1 minutes
For population 15 years and over in 62567:
Never married: 25.7%
Now married: 41.1%
Separated: 0.0%
Widowed: 12.4%
Divorced: 20.7%
Zip code 62567 compared to state average:
Median house value below state average.
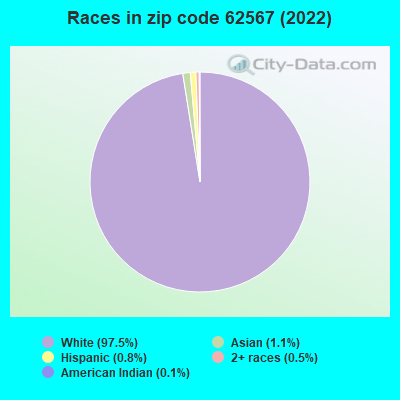
Black race population percentage significantly below state average.
Hispanic race population percentage significantly below state average.
Median age significantly above state average.
Foreign-born population percentage significantly below state average.
Renting percentage below state average.
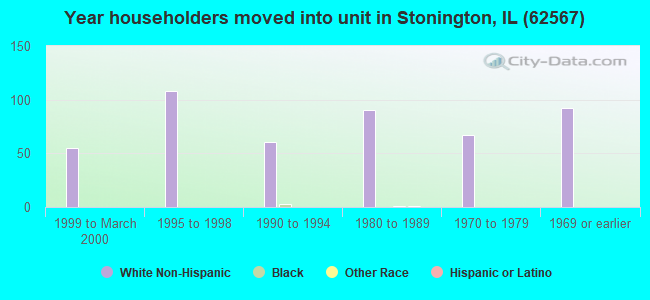
Length of stay since moving in significantly above state average.
Percentage of population with a bachelor's degree or higher below state average.
Averages for the 2020 tax year for zip code 62567, filed in 2021:
Average Adjusted Gross Income (AGI) in 2020: $53,958 (Individual Income Tax Returns)
Here:
$53,958
State:
$82,626
Salary/wage: $46,752 (reported on 80.8% of returns)
Here:
$46,752
State:
$66,640
(% of AGI for various income ranges: 975.4% for AGIs below $25k, 3994.5% for AGIs $25k-50k, 7318.0% for AGIs $50k-75k, 8018.0% for AGIs $75k-100k, 21020.0% for AGIs $100k-200k)
Taxable interest for individuals: $711 (reported on 36.5% of returns)
This zip code:
$711
Illinois:
$2,376
(% of AGI for various income ranges: 6.9% for AGIs below $25k, 21.8% for AGIs $25k-50k, 30.0% for AGIs $50k-75k, 20.0% for AGIs $75k-100k, 256.7% for AGIs $100k-200k)
Ordinary dividends: $1,512 (reported on 15.4% of returns)
Here:
$1,512
State:
$9,061
(% of AGI for various income ranges: 53.6% for AGIs $25k-50k, 206.7% for AGIs $100k-200k)
Net capital gain/loss in AGI: +$717 (reported on 11.5% of returns)
Here:
+$717
State:
+$31,684
(% of AGI for various income ranges: 27.3% for AGIs $25k-50k, 43.3% for AGIs $100k-200k)
Profit/loss from business: +$4,650 (reported on 11.5% of returns)
Here:
+$4,650
State:
+$12,175
(% of AGI for various income ranges: 144.6% for AGIs below $25k, 182.0% for AGIs $75k-100k)
Taxable individual retirement arrangement distribution: $9,525 (reported on 7.7% of returns)
62567:
$9,525
Illinois:
$21,613
(% of AGI for various income ranges: 762.0% for AGIs $50k-75k)
Earned income credit: $1,789 (reported on 17.3% of returns)
Here:
$1,789
State:
$2,311
(% of AGI for various income ranges: 76.2% for AGIs below $25k, 56.4% for AGIs $25k-50k)
Percentage of individuals using paid preparers for their 2020 taxes: 98.1%
Here:
98%
State:
93%
(% for various income ranges: 93.8% for AGIs below $25k, 100.0% for AGIs $25k-50k, 100.0% for AGIs $50k-75k, 100.0% for AGIs $75k-100k, 100.0% for AGIs $100k-200k)
Averages for the 2012 tax year for zip code 62567, filed in 2013:
Average Adjusted Gross Income (AGI) in 2012: $51,098 (Individual Income Tax Returns)
Here:
$51,098
State:
$68,058
Salary/wage: $37,165 (reported on 84.2% of returns)
Here:
$37,165
State:
$55,396
(% of AGI for various income ranges: 72.4% for AGIs below $25k, 81.3% for AGIs $25k-50k, 77.0% for AGIs $50k-75k, 72.9% for AGIs $75k-100k, 36.9% for AGIs $100k-200k)
Taxable interest for individuals: $1,165 (reported on 35.1% of returns)
This zip code:
$1,165
Illinois:
$1,969
(% of AGI for various income ranges: 1.7% for AGIs below $25k, 0.4% for AGIs $25k-50k, 0.9% for AGIs $50k-75k, 1.0% for AGIs $100k-200k)
Ordinary dividends: $3,736 (reported on 19.3% of returns)
Here:
$3,736
State:
$7,786
(% of AGI for various income ranges: 1.4% for AGIs below $25k, 1.0% for AGIs $50k-75k, 2.8% for AGIs $100k-200k)
Profit/loss from business: +$7,350 (reported on 14.0% of returns)
Here:
+$7,350
State:
+$12,903
(% of AGI for various income ranges: 2.4% for AGIs below $25k, 7.5% for AGIs $25k-50k, 3.7% for AGIs $75k-100k)
Taxable individual retirement arrangement distribution: $5,660 (reported on 8.8% of returns)
62567:
$5,660
Illinois:
$17,929
Total itemized deductions: $16,850 (13% of AGI, reported on 14.0% of returns)
Here:
$16,850
State:
$26,433
Here:
12.9% of AGI
State:
19.2% of AGI
Charity contributions: $3,667 (reported on 10.5% of returns)
Here:
$3,667
State:
$4,525
Taxes paid: $6,711 (reported on 15.8% of returns)
62567:
$6,711
State:
$11,968
Earned income credit: $2,175 (reported on 21.1% of returns)
Here:
$2,175
State:
$2,349
(% of AGI for various income ranges: 7.4% for AGIs below $25k, 1.4% for AGIs $25k-50k)
Percentage of individuals using paid preparers for their 2012 taxes: 63.2%
Here:
63%
State:
57%
(% for various income ranges: 54.5% for AGIs below $25k, 57.1% for AGIs $25k-50k, 70.0% for AGIs $50k-75k, 80.0% for AGIs $75k-100k, 83.3% for AGIs $100k-200k)
Averages for the 2004 tax year for zip code 62567, filed in 2005:
Average Adjusted Gross Income (AGI) in 2004: $37,439 (Individual Income Tax Returns)
Here:
$37,439
State:
$54,625
Salary/wage: $30,795 (reported on 84.2% of returns)
Here:
$30,795
State:
$46,811
(% of AGI for various income ranges: 83.7% for AGIs below $10k, 63.4% for AGIs $10k-25k, 74.5% for AGIs $25k-50k, 77.9% for AGIs $50k-75k, 80.2% for AGIs $75k-100k, 32.3% for AGIs over 100k)
Taxable interest for individuals: $1,242 (reported on 48.8% of returns)
This zip code:
$1,242
Illinois:
$2,101
(% of AGI for various income ranges: 4.4% for AGIs below $10k, 2.7% for AGIs $10k-25k, 2.0% for AGIs $25k-50k, 1.1% for AGIs $50k-75k, 0.5% for AGIs $75k-100k, 1.7% for AGIs over 100k)
Taxable dividends: $1,800 (reported on 27.2% of returns)
Here:
$1,800
State:
$4,306
(% of AGI for various income ranges: 2.1% for AGIs below $10k, 0.6% for AGIs $10k-25k, 0.8% for AGIs $25k-50k, 0.2% for AGIs $50k-75k, 0.4% for AGIs $75k-100k, 5.9% for AGIs over 100k)
Net capital gain/loss: +$2,254 (reported on 12.9% of returns)
Here:
+$2,254
State:
+$17,321
(% of AGI for various income ranges: 0.5% for AGIs $10k-25k, 0.1% for AGIs $25k-50k, 0.5% for AGIs $50k-75k, 3.7% for AGIs $75k-100k)
Profit/loss from business: +$3,775 (reported on 16.2% of returns)
Here:
+$3,775
State:
+$11,771
Profit/loss from farming: +$40,037 (reported on 4.9% of returns)
Here:
+$40,037
State:
+$2,327
IRA payment deduction: $2,143 (reported on 2.5% of returns)
62567:
$2,143
Illinois:
$3,087
Total itemized deductions: $11,892 (20% of AGI, reported on 13.4% of returns)
Here:
$11,892
State:
$20,239
Here:
20.5% of AGI
State:
19.5% of AGI
(% of AGI for various income ranges: 4.8% for AGIs $10k-25k, 4.0% for AGIs $25k-50k, 3.8% for AGIs $50k-75k, 10.0% for AGIs $75k-100k)
Charity contributions deductions: $2,431 (4% of AGI, reported on 10.5% of returns)
Here:
$2,431
State:
$3,719
Here:
3.9% of AGI
State:
3.4% of AGI
Total tax: $4,918 (reported on 75.1% of returns)
62567:
$4,918
State:
$9,882
(% of AGI for various income ranges: 2.1% for AGIs below $10k, 3.9% for AGIs $10k-25k, 7.2% for AGIs $25k-50k, 9.4% for AGIs $50k-75k, 11.4% for AGIs $75k-100k, 20.2% for AGIs over 100k)
Earned income credit: $1,761 (reported on 12.9% of returns)
Here:
$1,761
State:
$1,788
Percentage of individuals using paid preparers for their 2004 taxes: 71.3%
Here:
71%
State:
61%
(% for various income ranges: 64.3% for AGIs below $10k, 72.4% for AGIs $10k-25k, 74.2% for AGIs $25k-50k, 67.7% for AGIs $50k-75k, 77.8% for AGIs $75k-100k, 88.2% for AGIs over 100k)
Household received Food Stamps/SNAP in the past 12 months: 50 Household did not receive Food Stamps/SNAP in the past 12 months: 352
Women who had a birth in the past 12 months: 2 (2 now married, 0 unmarried) Women who did not have a birth in the past 12 months: 114 (50 now married, 63 unmarried)
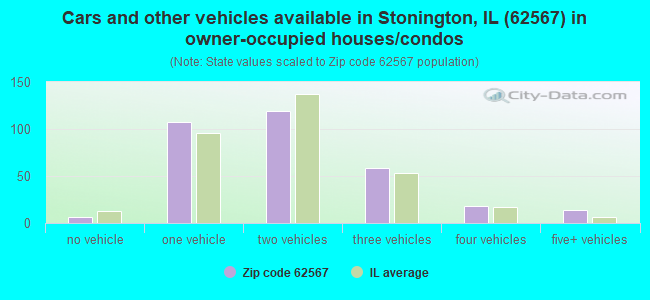
Housing units in zip code 62567 with a mortgage: 158 (10 second mortgage, 5 both second mortgage and home equity loan) Median monthly owner costs for units with a mortgage: $1,050 Median monthly owner costs for units without a mortgage: $543
Residents with income below the poverty level in 2022:
This zip code:
15.1%
Whole state:
11.9%
Residents with income below 50% of the poverty level in 2022:
This zip code:
5.4%
Whole state:
5.7%
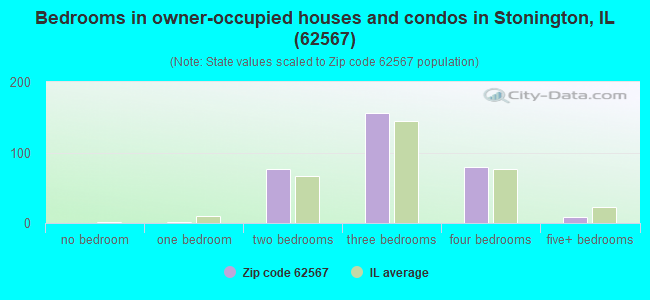
Median number of rooms in houses and condos:
Here:
6.7
State:
6.4
Median number of rooms in apartments:
Here:
5.2
State:
4.1
Notable locations in this zip code not listed on our city pages
Churches in zip code 62567 include: Old Stonington Church (A), Church of the Nazarene (B), Holy Trinity Catholic Church (C), Joy Assembly Church (D), Stonington United Methodist Church (E). Display/hide their locations on the map
Size of family households: 135 2-persons, 28 3-persons, 29 4-persons, 7 5-persons
Size of nonfamily households: 153 1-person, 54 2-persons
78 married couples with children.
14 single-parent households (2 men, 12 women).
97.6% of residents of 62567 zip code speak English at home.
0.9% of residents speak Spanish at home (100% very well).
0.2% of residents speak other Indo-European language at home (100% very well).
0.6% of residents speak Asian or Pacific Island language at home (80% well, 20% not at all).
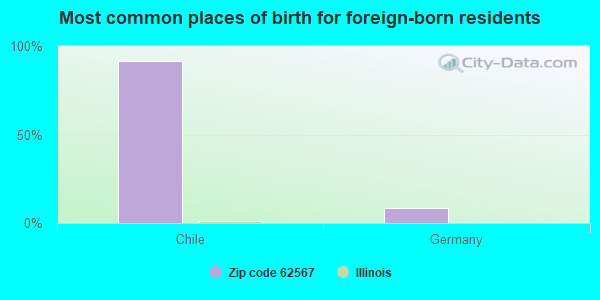
Foreign born population: 11 (1.4%) (0.0% of them are naturalized citizens)
:
1.4%
Whole state:
14.4%
92%Chile
8%Germany
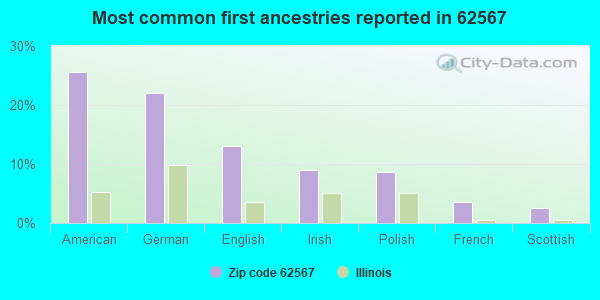
26%American
22%German
13%English
9%Irish
9%Polish
4%French
3%Scottish
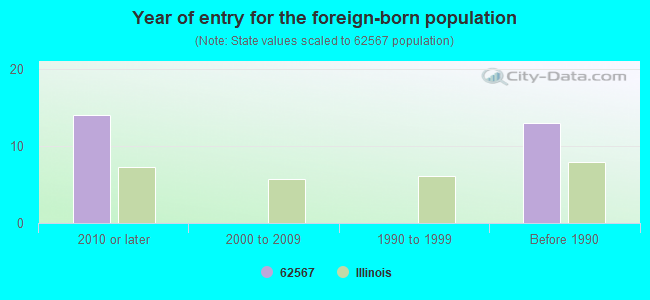
Year of entry for the foreign-born population
142010 or later
02000 to 2009
01990 to 1999
13Before 1990
Facilities with environmental interests located in this zip code:
MONSANTO (RTE 48 in STONINGTON, IL)
STATE MASTER (Illinois EPA Project) - SOLID WASTE PROGRAM, HAZARDOUS WASTE PROGRAM (Resource Conservation and Recovery Act (tracking hazardous waste)) Organizations: MONSANTO CO (CONTACT/OWNER)
Alternative names: ASGROW SEED CO
ASGROW SEED CO LLC (1982 IL RT 48 in STONINGTON, IL)
STATE MASTER (Illinois EPA Project) - AIR PROGRAM AIR MINOR (AIRS/AFS) Business SIC classification: CROP PREPARATION SERVICES FOR MARKET, EXCEPT COTTON GINNING
CHRISTIAN COUNTY FARMERS SUPPLY CO (P.O. BOX in STONINGTON, IL)
STATE MASTER (Illinois EPA Project) - AIR PROGRAM AIR MINOR (AIRS/AFS) Business SIC classification: BOOKS, PERIODICALS, AND NEWSPAPERS
CHRISTIAN COUNTY FARMERS SUPPLY CO (OFF RTE 48 in STONINGTON, IL)
COMPLIANCE ACTIVITY (Tracking inspections of insecticide, fungicide, and rodenticide, and toxic substances) (Resource Conservation and Recovery Act (tracking hazardous waste))
NORFOLK SOUTHERN TRAIN DERAILMENT (RTE 48 in STONINGTON, IL)
Large Quantity Generators, more that 1000 kg of hazardous waste/month (Resource Conservation and Recovery Act (tracking hazardous waste)) Organizations: NORFOLK SOUTHERN RAILWAY (CONTACT/OPERATOR)
NORFOLK AND WESTERN RAILWAY CO (175 S AMERICAN LEGION DR in STONINGTON, IL)
(Resource Conservation and Recovery Act (tracking hazardous waste)) Organizations: NORFOLK & WESTERN RAILWAY CO (CONTACT/OWNER)
CHRISTIAN COUNTY FARMERS SUPPLY COMPANY (5 STATE ROUTE 48 in STONINGTON, IL)
ENFORCEMENT/COMPLIANCE ACTIVITY (Integrated Compliance Information System) COMPLIANCE ACTIVITY (Tracking inspections of insecticide, fungicide, and rodenticide, and toxic substances) Alternative names: CHRISTIAN CTY FARMERS SUP, STONINGTON PLANT
Housing units lacking complete plumbing facilities: 2.7% Housing units lacking complete kitchen facilities: 4.5%
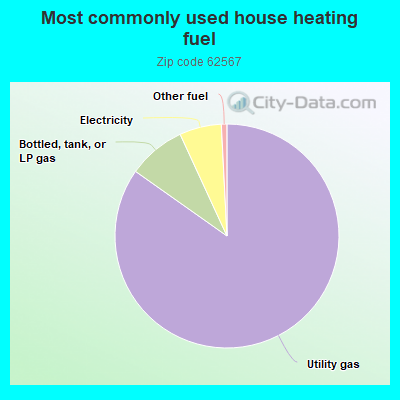
85.3%Utility gas
8.4%Bottled, tank, or LP gas
6.1%Electricity
0.8%Other fuel
Population in 1990: 1,280.
Place of birth for U.S.-born residents:
This state: 691
Northeast: 6
Midwest: 76
South: 73
West: 8
61% of the 62567 zip code residents lived in the same house 5 years ago. Out of people who lived in different houses, 57% lived in this county. Out of people who lived in different counties, 50% lived in Illinois.
94% of the 62567 zip code residents lived in the same house 1 year ago. Out of people who lived in different houses, 93% moved from this county.
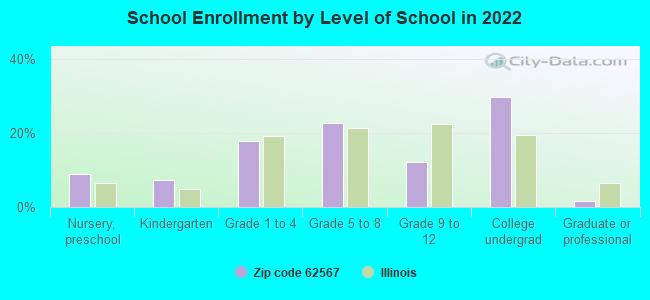
Private vs. public school enrollment:
Students in private schools in grades 1 to 8 (elementary and middle school):
Here:
0.0%
Illinois:
13.3%
Students in private schools in grades 9 to 12 (high school):
Here:
0.0%
Illinois:
9.9%
Students in private undergraduate colleges:
Here:
0.0%
Illinois:
27.4%
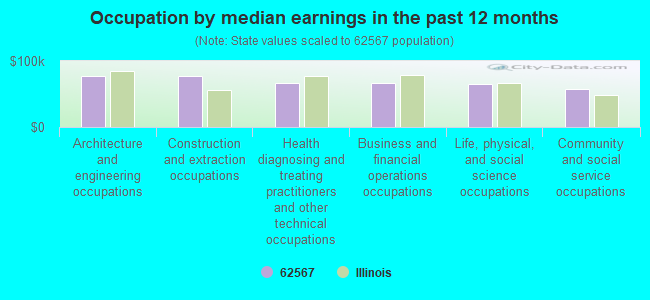
Occupation by median earnings in the past 12 months ($)
77,895Architecture and engineering occupations
77,840Construction and extraction occupations
67,368Health diagnosing and treating practitioners and other technical occupations
66,217Business and financial operations occupations
65,617Life, physical, and social science occupations
57,342Community and social service occupations
Top industries in this zip code by the number of employees in 2005:
Professional, Scientific, and Technical Services: Research and Development in the Physical, Engineering, and Life Sciences (20-49: 1)
Health Care and Social Assistance: Child Day Care Services (10-19: 1)
Construction: Other Heavy and Civil Engineering Construction (10-19: 1)
Wholesale Trade: Grain and Field Bean Merchant Wholesalers (10-19: 1)
Other Services (except Public Administration): General Automotive Repair (5-9: 1)
Finance and Insurance: Insurance Agencies and Brokerages (5-9: 1)
Construction: Painting and Wall Covering Contractors (5-9: 1)
Other Services (except Public Administration): Religious Organizations (1-4: 3)
Fatal accident statistics in 2014:
Fatal accident count: 1
Vehicles involved in fatal accidents: 1
Fatal accidents caused by drunken drivers: 0
Fatalities: 1
Persons involved in fatal accidents: 1
Pedestrians involved in fatal accidents: 1
Fatal accident statistics in 2013:
Fatal accident count: 1
Vehicles involved in fatal accidents: 3
Fatal accidents caused by drunken drivers: 1
Fatalities: 1
Persons involved in fatal accidents: 3
Pedestrians involved in fatal accidents: 0
2002 - 2018 National Fire Incident Reporting System (NFIRS) incidents
According to the data from the years 2002 - 2018 the average number of fire incidents per year is 11. The highest number of fire incidents - 28 took place in 2017, and the least - 0 in 2003. The data has a growing trend.
When looking into fire subcategories, the most reports belonged to: Outside Fires (51.3%), and Structure Fires (38.5%).
Fire incident types reported to NFIRS in Zip Code 62567


 Nearest zip codes: 62513, 62568, 62547, 62514, 62555, 62531.


 According to the data from the years 2002 - 2018 the average number of fire incidents per year is 11. The highest number of fire incidents - 28 took place in 2017, and the least - 0 in 2003. The data has a growing trend.
 When looking into fire subcategories, the most reports belonged to: Outside Fires (51.3%), and Structure Fires (38.5%).