Estimated zip code population in 2022: 970 Zip code population in 2010: 821 Zip code population in 2000: 964
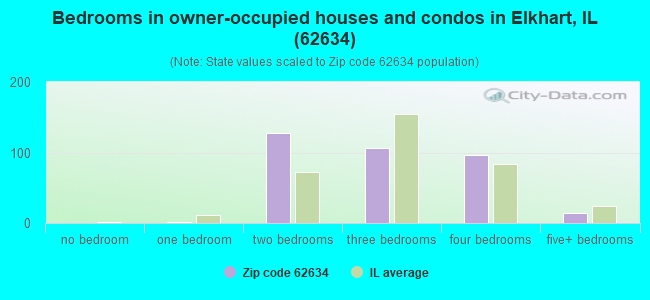
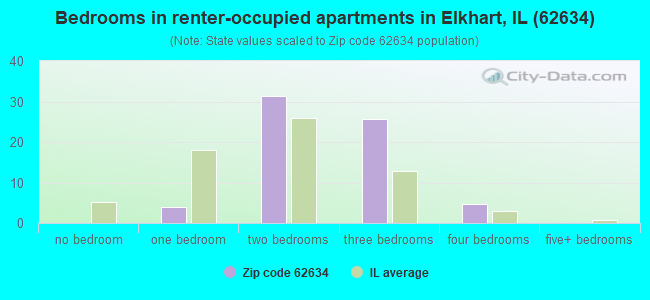
Houses and condos: 441 Renter-occupied apartments: 67
% of renters here:
16%
State:
33%
March 2022 cost of living index in zip code 62634: 84.1 (less than average, U.S. average is 100)
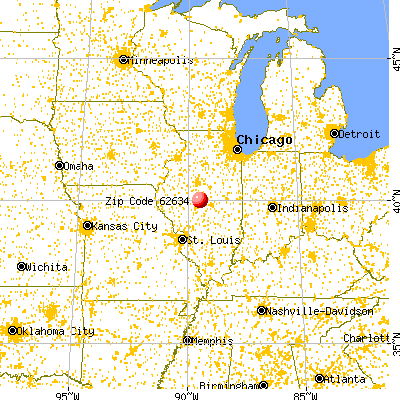
Land area: 56.2 sq. mi. Water area: 0.0 sq. mi.
Population density: 17 people per square mile
(very low).
OSM Map
General Map
Google Map
MSN Map
OSM Map
General Map
Google Map
MSN Map
OSM Map
General Map
Google Map
MSN Map
OSM Map
General Map
Google Map
MSN Map
Please wait while loading the map...
Real estate property taxes paid for housing units in 2022:
This zip code:
1.6% ($2,258)
Illinois:
2.0% ($4,912)
Median real estate property taxes paid for housing units with mortgages in 2022: $2,491 (1.5%) Median real estate property taxes paid for housing units with no mortgage in 2022: $2,021 (1.9%)
Business Search- 14 Million verified businesses
Males: 499
(51.4%)
Females: 471
(48.6%)
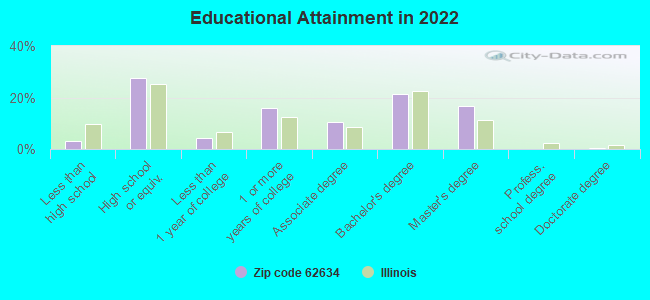
For population 25 years and over in 62634:
High school or higher: 96.1%
Bachelor's degree or higher: 38.4%
Graduate or professional degree: 17.1%
Unemployed: 4.2%
Mean travel time to work (commute): 22.6 minutes
For population 15 years and over in 62634:
Never married: 14.9%
Now married: 68.3%
Separated: 0.9%
Widowed: 4.2%
Divorced: 11.8%
Zip code 62634 compared to state average:
Median house value below state average.
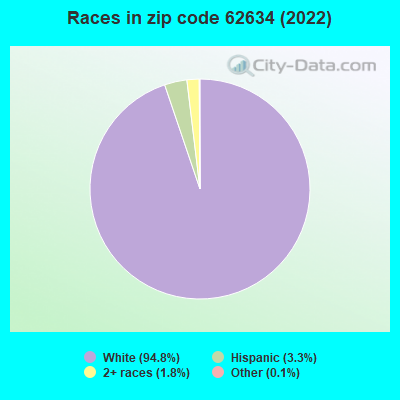
Black race population percentage significantly below state average.
Hispanic race population percentage significantly below state average.
Foreign-born population percentage significantly below state average.
Renting percentage below state average.
Length of stay since moving in significantly above state average.
Averages for the 2020 tax year for zip code 62634, filed in 2021:
Average Adjusted Gross Income (AGI) in 2020: $72,170 (Individual Income Tax Returns)
Here:
$72,170
State:
$82,626
Salary/wage: $53,551 (reported on 84.1% of returns)
Here:
$53,551
State:
$66,640
(% of AGI for various income ranges: 1214.3% for AGIs below $25k, 3582.5% for AGIs $25k-50k, 5926.7% for AGIs $50k-75k, 8607.5% for AGIs $75k-100k, 12106.0% for AGIs $100k-200k)
Taxable interest for individuals: $577 (reported on 50.0% of returns)
This zip code:
$577
Illinois:
$2,376
(% of AGI for various income ranges: 8.6% for AGIs below $25k, 17.5% for AGIs $25k-50k, 41.7% for AGIs $50k-75k, 42.5% for AGIs $75k-100k, 130.0% for AGIs $100k-200k)
Ordinary dividends: $1,700 (reported on 15.9% of returns)
Here:
$1,700
State:
$9,061
(% of AGI for various income ranges: 76.7% for AGIs $50k-75k, 146.0% for AGIs $100k-200k)
Net capital gain/loss in AGI: +$2,486 (reported on 15.9% of returns)
Here:
+$2,486
State:
+$31,684
(% of AGI for various income ranges: 180.0% for AGIs $50k-75k, 132.0% for AGIs $100k-200k)
Profit/loss from business: +$4,840 (reported on 11.4% of returns)
Here:
+$4,840
State:
+$12,175
(% of AGI for various income ranges: 97.5% for AGIs $25k-50k, 410.0% for AGIs $75k-100k)
Taxable individual retirement arrangement distribution: $11,480 (reported on 11.4% of returns)
62634:
$11,480
Illinois:
$21,613
(% of AGI for various income ranges: 956.7% for AGIs $50k-75k)
Earned income credit: $1,680 (reported on 11.4% of returns)
Here:
$1,680
State:
$2,311
(% of AGI for various income ranges: 68.6% for AGIs below $25k, 45.0% for AGIs $25k-50k)
Percentage of individuals using paid preparers for their 2020 taxes: 100.0%
Here:
100%
State:
93%
(% for various income ranges: 100.0% for AGIs below $25k, 100.0% for AGIs $25k-50k, 100.0% for AGIs $50k-75k, 100.0% for AGIs $75k-100k, 100.0% for AGIs $100k-200k, 100.0% for AGIs over 200k)
Averages for the 2012 tax year for zip code 62634, filed in 2013:
Average Adjusted Gross Income (AGI) in 2012: $64,830 (Individual Income Tax Returns)
Here:
$64,830
State:
$68,058
Salary/wage: $43,127 (reported on 86.0% of returns)
Here:
$43,127
State:
$55,396
(% of AGI for various income ranges: 73.7% for AGIs below $25k, 74.9% for AGIs $25k-50k, 72.8% for AGIs $50k-75k, 66.0% for AGIs $75k-100k, 42.0% for AGIs $100k-200k)
Taxable interest for individuals: $660 (reported on 46.5% of returns)
This zip code:
$660
Illinois:
$1,969
(% of AGI for various income ranges: 0.8% for AGIs below $25k, 0.3% for AGIs $25k-50k, 0.1% for AGIs $50k-75k, 0.2% for AGIs $75k-100k, 0.7% for AGIs $100k-200k)
Ordinary dividends: $1,357 (reported on 16.3% of returns)
Here:
$1,357
State:
$7,786
Net capital gain/loss in AGI: +$9,633 (reported on 14.0% of returns)
Here:
+$9,633
State:
+$22,183
Profit/loss from business: +$6,483 (reported on 14.0% of returns)
Here:
+$6,483
State:
+$12,903
Taxable individual retirement arrangement distribution: $5,700 (reported on 9.3% of returns)
62634:
$5,700
Illinois:
$17,929
Total itemized deductions: $20,025 (18% of AGI, reported on 27.9% of returns)
Here:
$20,025
State:
$26,433
Here:
17.6% of AGI
State:
19.2% of AGI
(% of AGI for various income ranges: 11.3% for AGIs $25k-50k, 16.8% for AGIs $50k-75k, 7.9% for AGIs $100k-200k)
Charity contributions: $4,612 (reported on 18.6% of returns)
Here:
$4,612
State:
$4,525
Taxes paid: $6,608 (reported on 30.2% of returns)
62634:
$6,608
State:
$11,968
(% of AGI for various income ranges: 2.6% for AGIs $25k-50k, 4.8% for AGIs $50k-75k, 3.7% for AGIs $100k-200k)
Earned income credit: $2,050 (reported on 9.3% of returns)
Here:
$2,050
State:
$2,349
(% of AGI for various income ranges: 2.8% for AGIs below $25k, 1.1% for AGIs $25k-50k)
Percentage of individuals using paid preparers for their 2012 taxes: 62.8%
Here:
63%
State:
57%
(% for various income ranges: 50.0% for AGIs below $25k, 60.0% for AGIs $25k-50k, 66.7% for AGIs $50k-75k, 75.0% for AGIs $75k-100k, 75.0% for AGIs $100k-200k)
Averages for the 2004 tax year for zip code 62634, filed in 2005:
Average Adjusted Gross Income (AGI) in 2004: $41,787 (Individual Income Tax Returns)
Here:
$41,787
State:
$54,625
Salary/wage: $32,106 (reported on 82.2% of returns)
Here:
$32,106
State:
$46,811
(% of AGI for various income ranges: 115.3% for AGIs below $10k, 72.4% for AGIs $10k-25k, 74.4% for AGIs $25k-50k, 69.3% for AGIs $50k-75k, 64.6% for AGIs $75k-100k, 37.8% for AGIs over 100k)
Taxable interest for individuals: $1,089 (reported on 54.0% of returns)
This zip code:
$1,089
Illinois:
$2,101
(% of AGI for various income ranges: 4.7% for AGIs below $10k, 3.9% for AGIs $10k-25k, 1.4% for AGIs $25k-50k, 1.5% for AGIs $50k-75k, 0.8% for AGIs $75k-100k, 0.6% for AGIs over 100k)
Taxable dividends: $548 (reported on 26.3% of returns)
Here:
$548
State:
$4,306
(% of AGI for various income ranges: 3.4% for AGIs below $10k, 0.4% for AGIs $10k-25k, 0.3% for AGIs $25k-50k, 0.3% for AGIs $50k-75k, 0.3% for AGIs $75k-100k, 0.3% for AGIs over 100k)
Net capital gain/loss: +$973 (reported on 16.9% of returns)
Here:
+$973
State:
+$17,321
(% of AGI for various income ranges: 4.0% for AGIs below $10k, -0.4% for AGIs $10k-25k, -0.3% for AGIs $25k-50k, -0.4% for AGIs $50k-75k, 2.2% for AGIs over 100k)
Profit/loss from business: +$5,625 (reported on 12.8% of returns)
Here:
+$5,625
State:
+$11,771
(% of AGI for various income ranges: -2.0% for AGIs $10k-25k, -0.1% for AGIs $25k-50k, 4.9% for AGIs $50k-75k, 3.6% for AGIs $75k-100k)
Profit/loss from farming: +$28,952 (reported on 9.6% of returns)
Here:
+$28,952
State:
+$2,327
Total itemized deductions: $14,806 (20% of AGI, reported on 21.3% of returns)
Here:
$14,806
State:
$20,239
Here:
20.1% of AGI
State:
19.5% of AGI
(% of AGI for various income ranges: 7.0% for AGIs $10k-25k, 7.1% for AGIs $25k-50k, 7.9% for AGIs $50k-75k, 6.6% for AGIs $75k-100k, 8.9% for AGIs over 100k)
Charity contributions deductions: $2,342 (4% of AGI, reported on 16.7% of returns)
Here:
$2,342
State:
$3,719
Here:
3.5% of AGI
State:
3.4% of AGI
(% of AGI for various income ranges: 1.1% for AGIs $25k-50k, 1.2% for AGIs $50k-75k, 1.1% for AGIs $75k-100k, 0.8% for AGIs over 100k)
Total tax: $6,012 (reported on 77.3% of returns)
62634:
$6,012
State:
$9,882
(% of AGI for various income ranges: 2.5% for AGIs below $10k, 4.2% for AGIs $10k-25k, 7.4% for AGIs $25k-50k, 10.8% for AGIs $50k-75k, 12.3% for AGIs $75k-100k, 17.2% for AGIs over 100k)
Earned income credit: $1,718 (reported on 8.9% of returns)
Here:
$1,718
State:
$1,788
Percentage of individuals using paid preparers for their 2004 taxes: 73.0%
Here:
73%
State:
61%
(% for various income ranges: 55.8% for AGIs below $10k, 70.1% for AGIs $10k-25k, 78.2% for AGIs $25k-50k, 84.4% for AGIs $50k-75k, 65.8% for AGIs $75k-100k, 93.1% for AGIs over 100k)
Likely homosexual households (counted as self-reported same-sex unmarried-partner households)
Lesbian couples: 0.2% of all households
Gay men: 0.0% of all households
Household received Food Stamps/SNAP in the past 12 months: 25 Household did not receive Food Stamps/SNAP in the past 12 months: 385
Women who had a birth in the past 12 months: 10 (10 now married, 0 unmarried) Women who did not have a birth in the past 12 months: 169 (119 now married, 48 unmarried)
Housing units in zip code 62634 with a mortgage: 233 (16 second mortgage, 16 both second mortgage and home equity loan) Houses without a mortgage: 1
Median monthly owner costs for units with a mortgage: $1,500 Median monthly owner costs for units without a mortgage: $513
Residents with income below the poverty level in 2022:
This zip code:
3.4%
Whole state:
11.9%
Residents with income below 50% of the poverty level in 2022:
This zip code:
2.8%
Whole state:
5.7%
Median number of rooms in houses and condos:
Here:
6.7
State:
6.4
Median number of rooms in apartments:
Here:
4.7
State:
4.1
Notable locations in this zip code not listed on our city pages
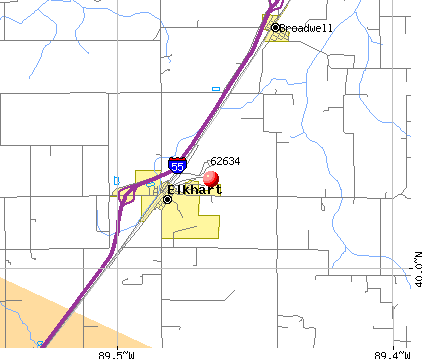
Notable locations in zip code 62634: Elkhart Rural Fire Protection District (A), Lincoln Rural Fire Protection District Station 2 Bravo Fire Department (B). Display/hide their locations on the map
Churches in zip code 62634 include: Elkhart Christian Church (A), Elkhart Methodist Church (B), Saint Patricks Church (C), Saint John Chapel (D). Display/hide their locations on the map
Cemeteries: Elkhart Cemetery (1), Foster Cemetery (2), Kline Cemetery (3), Latham Thompson Cemetery (4), Lawrence Cemetery (5), Wright Cemetery (6), Turley Cemetery (7). Display/hide their locations on the map
Size of family households: 113 2-persons, 49 3-persons, 91 4-persons, 18 5-persons, 5 6-persons, 1 7-or-more-persons
Size of nonfamily households: 115 1-person, 19 2-persons
223 married couples with children.
18 single-parent households (5 men, 13 women).
99.0% of residents of 62634 zip code speak English at home.
0.3% of residents speak Spanish at home (33% very well, 67% well).
Foreign born population: 0 (0.0%)
:
0.0%
Whole state:
14.4%
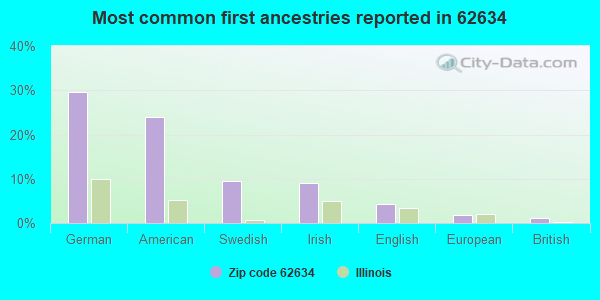
30%German
24%American
9%Swedish
9%Irish
4%English
2%European
1%British
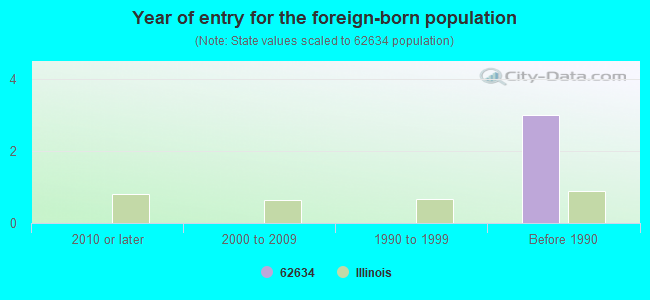
Year of entry for the foreign-born population
02010 or later
02000 to 2009
01990 to 1999
3Before 1990
Facilities with environmental interests located in this zip code:
PRAIRIE ENERGY POWER PLANT (ELKHART MINE RD in ELKHART, IL)
STATE MASTER (Illinois EPA Project) - AIR PROGRAM AIR MINOR (AIRS/AFS) Business SIC classification: ELECTRIC SERVICES
DAVIS?JERRY LEE & RONALD E. (SERVICE ROAD 2 - OLD RT. 66 W. in ELKHART, IL)
National Pollutant Discharge Elimination System NON-MAJOR (Tracking pollutant discharge elimination systems) - permit Alternative names: DAVIS, JERRY LEE & RONALD E.
ICG ILLINOIS LLC-VIPER MINE (ELKHART MINE ROAD in ELKHART, IL)
National Pollutant Discharge Elimination System NON-MAJOR (Tracking pollutant discharge elimination systems) - permit Business SIC classification: BITUMINOUS COAL UNDERGROUND MINING
Housing units lacking complete plumbing facilities: 0.6% Housing units lacking complete kitchen facilities: 0.6%
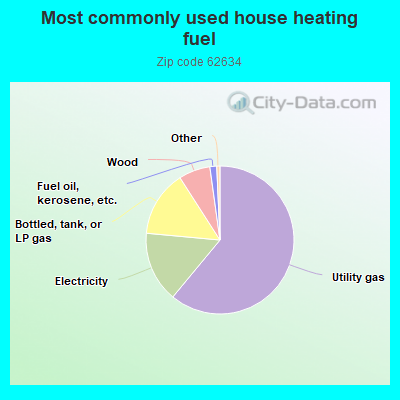
61.2%Utility gas
15.5%Electricity
14.5%Bottled, tank, or LP gas
6.9%Wood
1.5%Fuel oil, kerosene, etc.
Population in 1990: 922. Population change in the 1990s: +42 (+4.6%).
Place of birth for U.S.-born residents:
This state: 816
Northeast: 4
Midwest: 40
South: 25
West: 77
70% of the 62634 zip code residents lived in the same house 5 years ago. Out of people who lived in different houses, 65% lived in this county. Out of people who lived in different counties, 50% lived in Illinois.
95% of the 62634 zip code residents lived in the same house 1 year ago. Out of people who lived in different houses, 10% moved from this county. Out of people who lived in different houses, 94% moved from different county within same state.
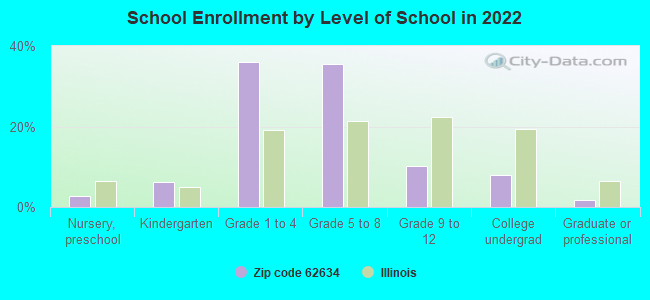
Private vs. public school enrollment:
Students in private schools in grades 1 to 8 (elementary and middle school): 10
Here:
6.4%
Illinois:
13.3%
Students in private schools in grades 9 to 12 (high school):
Here:
0.0%
Illinois:
9.9%
Students in private undergraduate colleges:
Here:
5.2%
Illinois:
27.4%
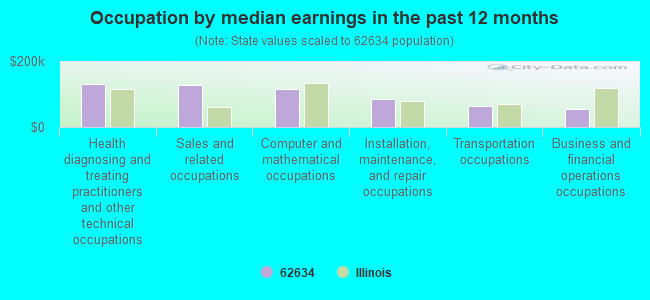
Occupation by median earnings in the past 12 months ($)
130,806Health diagnosing and treating practitioners and other technical occupations
127,748Sales and related occupations
115,705Computer and mathematical occupations
84,117Installation, maintenance, and repair occupations
62,357Transportation occupations
53,111Business and financial operations occupations
Top industries in this zip code by the number of employees in 2005:
Wholesale Trade: Grain and Field Bean Merchant Wholesalers (10-19 employees: 1 establishment, 1-4 employees: 1 establishment)
Other Services (except Public Administration): General Automotive Repair (5-9: 1)
Other Services (except Public Administration): Religious Organizations (1-4: 3)
Other Services (except Public Administration): Commercial and Industrial Machinery and Equipment (except Automotive and Electronic) Repair and Maintenance (1-4: 1)
2002 - 2018 National Fire Incident Reporting System (NFIRS) incidents
Based on the data from the years 2002 - 2018 the average number of fires per year is 11. The highest number of fires - 23 took place in 2010, and the least - 2 in 2003. The data has a growing trend.
When looking into fire subcategories, the most reports belonged to: Mobile Property/Vehicle Fires (35.6%), and Outside Fires (32.8%).
Fire incident types reported to NFIRS in Zip Code 62634


 Nearest zip codes: 62693, 62519, 62541, 62666, 62656, 62561.


 Based on the data from the years 2002 - 2018 the average number of fires per year is 11. The highest number of fires - 23 took place in 2010, and the least - 2 in 2003. The data has a growing trend.
 When looking into fire subcategories, the most reports belonged to: Mobile Property/Vehicle Fires (35.6%), and Outside Fires (32.8%).