Estimated zip code population in 2022: 402 Zip code population in 2010: 488 Zip code population in 2000: 554
Houses and condos: 234 Renter-occupied apartments: 37
% of renters here:
22%
State:
33%
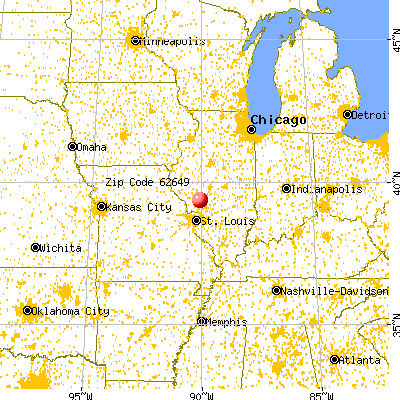
March 2022 cost of living index in zip code 62649: 84.5 (less than average, U.S. average is 100)
Land area: 37.7 sq. mi. Water area: 0.2 sq. mi.
Population density: 11 people per square mile
(very low).
OSM Map
General Map
Google Map
MSN Map
OSM Map
General Map
Google Map
MSN Map
OSM Map
General Map
Google Map
MSN Map
OSM Map
General Map
Google Map
MSN Map
Please wait while loading the map...
Real estate property taxes paid for housing units in 2022:
This zip code:
1.3% ($1,815)
Illinois:
2.0% ($4,912)
Median real estate property taxes paid for housing units with mortgages in 2022: $1,315 (0.9%) Median real estate property taxes paid for housing units with no mortgage in 2022: $2,218 (1.6%)
Business Search- 14 Million verified businesses
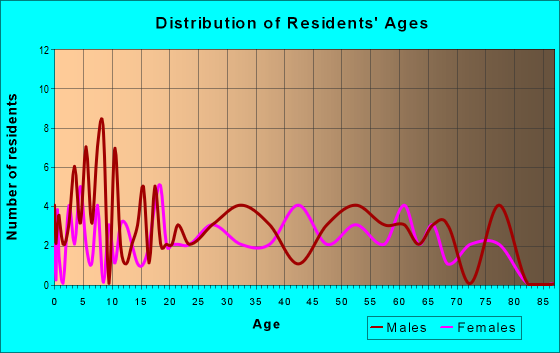
Males: 190
(47.3%)
Females: 211
(52.7%)
For population 25 years and over in 62649:
High school or higher: 95.7%
Bachelor's degree or higher: 17.5%
Graduate or professional degree: 2.3%
Unemployed: 7.2%
Mean travel time to work (commute): 39.6 minutes
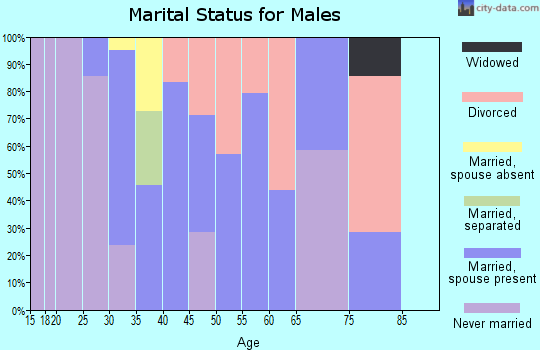
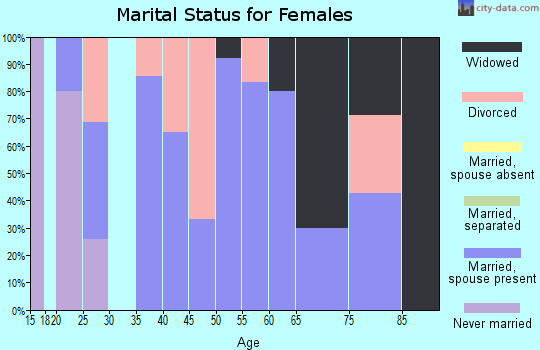
For population 15 years and over in 62649:
Never married: 20.8%
Now married: 47.2%
Separated: 3.3%
Widowed: 7.7%
Divorced: 21.1%
Zip code 62649 compared to state average:
Median house value below state average.
Black race population percentage significantly below state average.
Hispanic race population percentage significantly below state average.
Median age significantly above state average.
Foreign-born population percentage significantly below state average.
Length of stay since moving in significantly above state average.
Number of college students significantly below state average.
Percentage of population with a bachelor's degree or higher below state average.
Averages for the 2020 tax year for zip code 62649, filed in 2021:
Average Adjusted Gross Income (AGI) in 2020: $59,723 (Individual Income Tax Returns)
Here:
$59,723
State:
$82,626
Salary/wage: $46,747 (reported on 77.3% of returns)
Here:
$46,747
State:
$66,640
(% of AGI for various income ranges: 1086.0% for AGIs below $25k, 2820.0% for AGIs $25k-50k, 4540.0% for AGIs $75k-100k)
Taxable interest for individuals: $400 (reported on 36.4% of returns)
This zip code:
$400
Illinois:
$2,376
(% of AGI for various income ranges: 12.0% for AGIs below $25k)
Ordinary dividends: $1,100 (reported on 18.2% of returns)
Here:
$1,100
State:
$9,061
(% of AGI for various income ranges: )
Net capital gain/loss in AGI: +$3,667 (reported on 13.6% of returns)
Here:
+$3,667
State:
+$31,684
(% of AGI for various income ranges: 183.3% for AGIs $25k-50k)
Profit/loss from business: +$13,100 (reported on 13.6% of returns)
Here:
+$13,100
State:
+$12,175
(% of AGI for various income ranges: 655.0% for AGIs $25k-50k)
Earned income credit: $2,067 (reported on 13.6% of returns)
Here:
$2,067
State:
$2,311
(% of AGI for various income ranges: 124.0% for AGIs below $25k)
Percentage of individuals using paid preparers for their 2020 taxes: 100.0%
Here:
100%
State:
93%
(% for various income ranges: 100.0% for AGIs below $25k, 100.0% for AGIs $25k-50k, 100.0% for AGIs $50k-75k, 100.0% for AGIs $75k-100k, 100.0% for AGIs $100k-200k)
Averages for the 2012 tax year for zip code 62649, filed in 2013:
Average Adjusted Gross Income (AGI) in 2012: $46,950 (Individual Income Tax Returns)
Here:
$46,950
State:
$68,058
Salary/wage: $37,239 (reported on 81.8% of returns)
Here:
$37,239
State:
$55,396
(% of AGI for various income ranges: 47.6% for AGIs below $25k, 90.5% for AGIs $25k-50k, 107.3% for AGIs $50k-75k)
Taxable interest for individuals: $470 (reported on 45.5% of returns)
This zip code:
$470
Illinois:
$1,969
(% of AGI for various income ranges: 1.5% for AGIs below $25k, 0.3% for AGIs $25k-50k, 0.6% for AGIs $50k-75k)
Ordinary dividends: $500 (reported on 18.2% of returns)
Here:
$500
State:
$7,786
Net capital gain/loss in AGI: +$600 (reported on 13.6% of returns)
Here:
+$600
State:
+$22,183
Profit/loss from business: +$4,525 (reported on 18.2% of returns)
Here:
+$4,525
State:
+$12,903
Total itemized deductions: $18,467 (19% of AGI, reported on 13.6% of returns)
Here:
$18,467
State:
$26,433
Here:
19.3% of AGI
State:
19.2% of AGI
Charity contributions: $1,700 (reported on 9.1% of returns)
Here:
$1,700
State:
$4,525
Taxes paid: $5,000 (reported on 18.2% of returns)
62649:
$5,000
State:
$11,968
Earned income credit: $2,525 (reported on 18.2% of returns)
Here:
$2,525
State:
$2,349
(% of AGI for various income ranges: 9.1% for AGIs below $25k)
Percentage of individuals using paid preparers for their 2012 taxes: 72.7%
Here:
73%
State:
57%
(% for various income ranges: 62.5% for AGIs below $25k, 83.3% for AGIs $25k-50k, 100.0% for AGIs $50k-75k)
Averages for the 2004 tax year for zip code 62649, filed in 2005:
Average Adjusted Gross Income (AGI) in 2004: $35,883 (Individual Income Tax Returns)
Here:
$35,883
State:
$54,625
Salary/wage: $30,845 (reported on 81.7% of returns)
Here:
$30,845
State:
$46,811
(% of AGI for various income ranges: 80.5% for AGIs below $10k, 57.2% for AGIs $10k-25k, 80.8% for AGIs $25k-50k, 80.7% for AGIs $50k-75k, 127.3% for AGIs $75k-100k)
Taxable interest for individuals: $630 (reported on 50.7% of returns)
This zip code:
$630
Illinois:
$2,101
(% of AGI for various income ranges: 5.0% for AGIs below $10k, 2.7% for AGIs $10k-25k, 0.5% for AGIs $25k-50k, 0.2% for AGIs $50k-75k, 1.6% for AGIs $75k-100k)
Taxable dividends: $424 (reported on 15.5% of returns)
Here:
$424
State:
$4,306
Net capital gain/loss: +$130 (reported on 10.8% of returns)
Here:
+$130
State:
+$17,321
Profit/loss from business: +$5,500 (reported on 11.3% of returns)
Here:
+$5,500
State:
+$11,771
Total itemized deductions: $16,522 (21% of AGI, reported on 10.8% of returns)
Here:
$16,522
State:
$20,239
Here:
21.4% of AGI
State:
19.5% of AGI
Charity contributions deductions: $667 (1% of AGI, reported on 5.6% of returns)
Here:
$667
State:
$3,719
Here:
0.9% of AGI
State:
3.4% of AGI
Total tax: $4,799 (reported on 70.0% of returns)
62649:
$4,799
State:
$9,882
(% of AGI for various income ranges: 3.0% for AGIs below $10k, 4.4% for AGIs $10k-25k, 6.6% for AGIs $25k-50k, 9.2% for AGIs $50k-75k, 10.0% for AGIs $75k-100k, 16.9% for AGIs over 100k)
Earned income credit: $1,735 (reported on 16.0% of returns)
Here:
$1,735
State:
$1,788
Percentage of individuals using paid preparers for their 2004 taxes: 70.9%
Here:
71%
State:
61%
(% for various income ranges: 69.6% for AGIs below $10k, 64.2% for AGIs $10k-25k, 73.3% for AGIs $25k-50k, 79.3% for AGIs $50k-75k, 120.0% for AGIs $75k-100k)
Household received Food Stamps/SNAP in the past 12 months: 20 Household did not receive Food Stamps/SNAP in the past 12 months: 147
Women who had a birth in the past 12 months: 5 (0 now married, 4 unmarried) Women who did not have a birth in the past 12 months: 57 (25 now married, 31 unmarried)
Housing units in zip code 62649 with a mortgage: 32 Median monthly owner costs for units with a mortgage: $912 Median monthly owner costs for units without a mortgage: $657
Residents with income below the poverty level in 2022:
This zip code:
4.6%
Whole state:
11.9%
Residents with income below 50% of the poverty level in 2022:
This zip code:
3.2%
Whole state:
5.7%
Median number of rooms in houses and condos:
Here:
6.1
State:
6.4
Median number of rooms in apartments:
Here:
5.0
State:
4.1
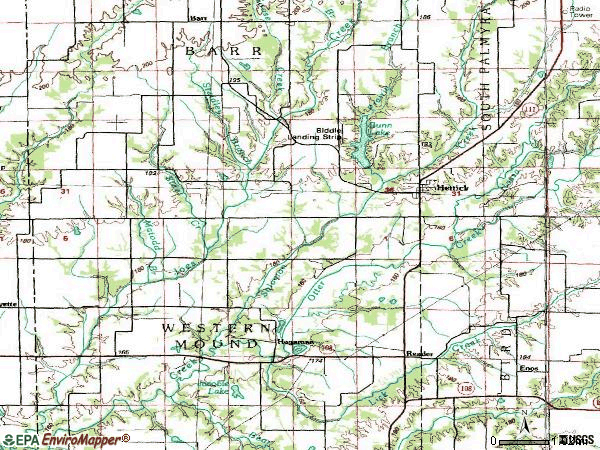
Notable locations in this zip code not listed on our city pages
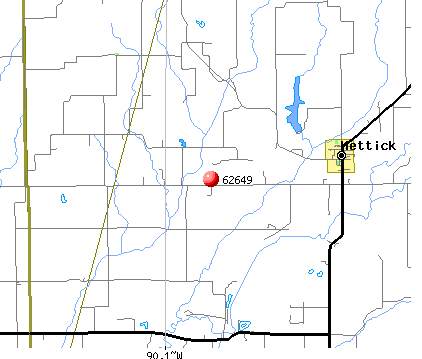
Notable locations in zip code 62649: Northwestern Area Ambulance and Rescue Service (A), Hettick Volunteer Fire Department (B). Display/hide their locations on the map
Cemeteries: Bethel Cemetery (1), Solomon A M Cemetery (2), Solomon G O Cemetery (3), Gilead Baptist Cemetery (4), Bethel Bapyist Cemetery (5), Andrew Cemetery (6), Stultz Cemetery (7). Display/hide their locations on the map
Streams, rivers, and creeks: Miller Branch (A), Matodd Branch (B), Prairie Branch (C), Nassa Creek (D), Goose Creek (E), Steidley Branch (F), Steer Creek (G). Display/hide their locations on the map
Size of family households: 36 2-persons, 31 3-persons, 9 4-persons, 10 5-persons, 5 6-persons
Size of nonfamily households: 65 1-person, 10 2-persons
23 married couples with children.
30 single-parent households (30 men).
98.7% of residents of 62649 zip code speak English at home.
1.3% of residents speak Spanish at home (100% very well).
Foreign born population: 0 (0.0%)
:
0.0%
Whole state:
14.4%
33%German
26%Irish
13%English
8%European
6%American
3%Portuguese
2%Czech
Facilities with environmental interests located in this zip code:
HETTICK STP (191 BUTLER STREET in HETTICK, IL)
STATE MASTER (Illinois EPA Project) - DRINKING WATER PROGRAM STATE MASTER (Illinois EPA Project) - National Pollutant Discharge Elimination System Permit National Pollutant Discharge Elimination System NON-MAJOR (Tracking pollutant discharge elimination systems) - permit Business SIC classification: SEWERAGE SYSTEMS Alternative names: HETTICK STP, VILLAGE OF
HETTICK STP (P.O. BOX 110 in HETTICK, IL)
National Pollutant Discharge Elimination System NON-MAJOR (Tracking pollutant discharge elimination systems) - permit Business SIC classification: SEWERAGE SYSTEMS Alternative names: HETTICK STP, VILLAGE OF
Housing units lacking complete plumbing facilities: 15.3% Housing units lacking complete kitchen facilities: 6.7%
47.9%Utility gas
40.0%Bottled, tank, or LP gas
8.5%Electricity
3.0%No fuel used
1.2%Wood
Population in 1990: 518. Population change in the 1990s: +36 (+6.9%).
Place of birth for U.S.-born residents:
This state: 358
Northeast: 1
Midwest: 27
South: 4
West: 9
59% of the 62649 zip code residents lived in the same house 5 years ago. Out of people who lived in different houses, 71% lived in this county. Out of people who lived in different counties, 50% lived in Illinois.
95% of the 62649 zip code residents lived in the same house 1 year ago. Out of people who lived in different houses, 88% moved from different county within same state. Out of people who lived in different houses, 12% moved from different state.
Private vs. public school enrollment:
Students in private schools in grades 1 to 8 (elementary and middle school):
Here:
0.0%
Illinois:
13.3%
Students in private schools in grades 9 to 12 (high school):
Here:
0.0%
Illinois:
9.9%
Occupation by median earnings in the past 12 months ($)
170,856Construction and extraction occupations
119,514Business and financial operations occupations
59,536Office and administrative support occupations
49,618Health diagnosing and treating practitioners and other technical occupations
39,293Management occupations
38,254Production occupations
Top industries in this zip code by the number of employees in 2005:
Accommodation and Food Services: Limited-Service Restaurants (10-19 employees: 1 establishment)
Accommodation and Food Services: Full-Service Restaurants (10-19: 1)
Construction: Water and Sewer Line and Related Structures Construction (5-9: 1)
Wholesale Trade: Grain and Field Bean Merchant Wholesalers (5-9: 1)
Construction: Site Preparation Contractors (1-4: 1)
Other Services (except Public Administration): Religious Organizations (1-4: 1)
Home Mortgage Disclosure Act Aggregated Statistics For Year 2009 (Based on 2 partial tracts)
A) FHA, FSA/RHS & VA Home Purchase Loans
B) Conventional Home Purchase Loans
C) Refinancings
D) Home Improvement Loans
F) Non-occupant Loans on < 5 Family Dwellings (A B C & D)
G) Loans On Manufactured Home Dwelling (A B C & D)
Number
Average Value
Number
Average Value
Number
Average Value
Number
Average Value
Number
Average Value
Number
Average Value
LOANS ORIGINATED
1
$38,100
1
$96,460
21
$109,740
2
$33,235
2
$107,810
1
$16,480
APPLICATIONS APPROVED, NOT ACCEPTED
0
$0
0
$0
2
$137,935
0
$0
0
$0
0
$0
APPLICATIONS DENIED
0
$0
1
$65,660
2
$107,810
0
$0
1
$32,150
0
$0
APPLICATIONS WITHDRAWN
0
$0
0
$0
1
$41,610
0
$0
0
$0
0
$0
FILES CLOSED FOR INCOMPLETENESS
0
$0
0
$0
0
$0
0
$0
0
$0
0
$0
Aggregated Statistics For Year 2008 (Based on 2 partial tracts)
A) FHA, FSA/RHS & VA Home Purchase Loans
B) Conventional Home Purchase Loans
C) Refinancings
D) Home Improvement Loans
G) Loans On Manufactured Home Dwelling (A B C & D)
Number
Average Value
Number
Average Value
Number
Average Value
Number
Average Value
Number
Average Value
LOANS ORIGINATED
1
$98,350
3
$60,887
11
$90,197
1
$70,790
1
$77,820
APPLICATIONS APPROVED, NOT ACCEPTED
0
$0
1
$58,630
1
$118,890
0
$0
1
$34,590
APPLICATIONS DENIED
1
$49,180
2
$41,880
2
$100,110
2
$30,260
1
$50,800
APPLICATIONS WITHDRAWN
0
$0
0
$0
1
$96,460
0
$0
0
$0
FILES CLOSED FOR INCOMPLETENESS
0
$0
0
$0
0
$0
0
$0
0
$0
Aggregated Statistics For Year 2007 (Based on 2 partial tracts)
B) Conventional Home Purchase Loans
C) Refinancings
D) Home Improvement Loans
F) Non-occupant Loans on < 5 Family Dwellings (A B C & D)
G) Loans On Manufactured Home Dwelling (A B C & D)
Number
Average Value
Number
Average Value
Number
Average Value
Number
Average Value
Number
Average Value
LOANS ORIGINATED
5
$54,580
9
$81,750
4
$26,075
2
$30,940
2
$34,990
APPLICATIONS APPROVED, NOT ACCEPTED
0
$0
0
$0
1
$18,910
0
$0
0
$0
APPLICATIONS DENIED
2
$42,555
4
$68,225
1
$38,640
0
$0
0
$0
APPLICATIONS WITHDRAWN
1
$64,310
1
$42,150
0
$0
0
$0
0
$0
FILES CLOSED FOR INCOMPLETENESS
0
$0
0
$0
0
$0
0
$0
0
$0
Aggregated Statistics For Year 2006 (Based on 2 partial tracts)
A) FHA, FSA/RHS & VA Home Purchase Loans
B) Conventional Home Purchase Loans
C) Refinancings
D) Home Improvement Loans
F) Non-occupant Loans on < 5 Family Dwellings (A B C & D)
G) Loans On Manufactured Home Dwelling (A B C & D)
Number
Average Value
Number
Average Value
Number
Average Value
Number
Average Value
Number
Average Value
Number
Average Value
LOANS ORIGINATED
1
$27,830
6
$91,553
8
$82,884
1
$25,940
1
$29,990
1
$54,580
APPLICATIONS APPROVED, NOT ACCEPTED
0
$0
1
$105,920
2
$109,565
0
$0
0
$0
0
$0
APPLICATIONS DENIED
0
$0
1
$88,090
5
$89,760
1
$40,530
0
$0
1
$70,250
APPLICATIONS WITHDRAWN
0
$0
1
$81,600
4
$143,950
0
$0
0
$0
0
$0
FILES CLOSED FOR INCOMPLETENESS
0
$0
0
$0
1
$81,060
0
$0
0
$0
0
$0
Aggregated Statistics For Year 2005 (Based on 2 partial tracts)
A) FHA, FSA/RHS & VA Home Purchase Loans
B) Conventional Home Purchase Loans
C) Refinancings
D) Home Improvement Loans
F) Non-occupant Loans on < 5 Family Dwellings (A B C & D)
G) Loans On Manufactured Home Dwelling (A B C & D)
Number
Average Value
Number
Average Value
Number
Average Value
Number
Average Value
Number
Average Value
Number
Average Value
LOANS ORIGINATED
1
$21,890
5
$68,684
5
$97,272
2
$7,565
2
$33,640
0
$0
APPLICATIONS APPROVED, NOT ACCEPTED
0
$0
1
$37,020
1
$58,090
0
$0
0
$0
1
$25,940
APPLICATIONS DENIED
0
$0
2
$34,720
4
$177,658
1
$12,160
0
$0
1
$56,740
APPLICATIONS WITHDRAWN
0
$0
1
$88,900
3
$128,163
1
$63,500
0
$0
0
$0
FILES CLOSED FOR INCOMPLETENESS
0
$0
0
$0
0
$0
0
$0
0
$0
0
$0
Aggregated Statistics For Year 2004 (Based on 2 partial tracts)
B) Conventional Home Purchase Loans
C) Refinancings
D) Home Improvement Loans
F) Non-occupant Loans on < 5 Family Dwellings (A B C & D)
G) Loans On Manufactured Home Dwelling (A B C & D)


 Nearest zip codes: 62674, 62630, 62044, 62667, 62063, 62081.