Estimated zip code population in 2022: 552 Zip code population in 2010: 464 Zip code population in 2000: 598
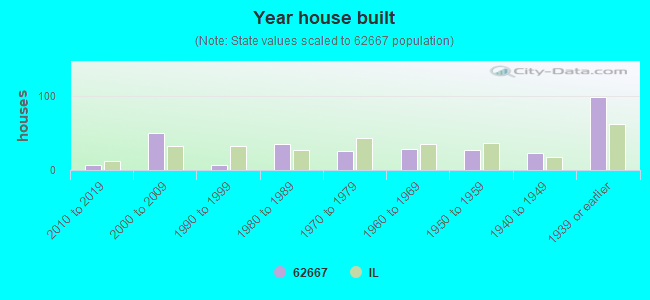
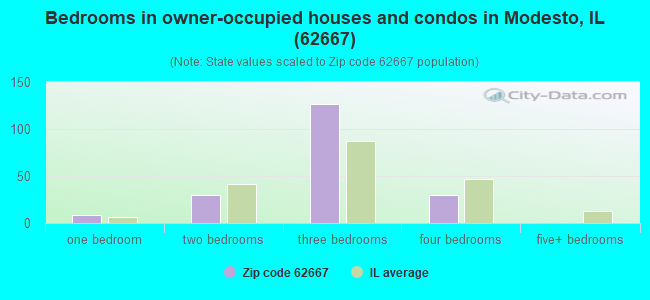
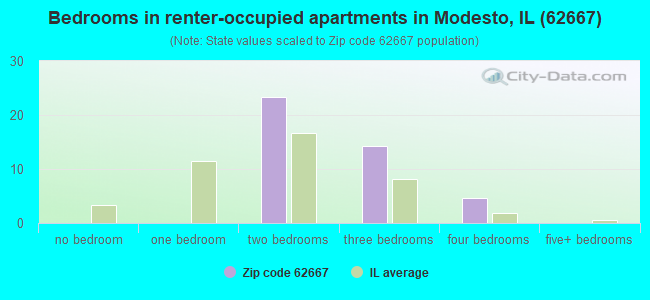
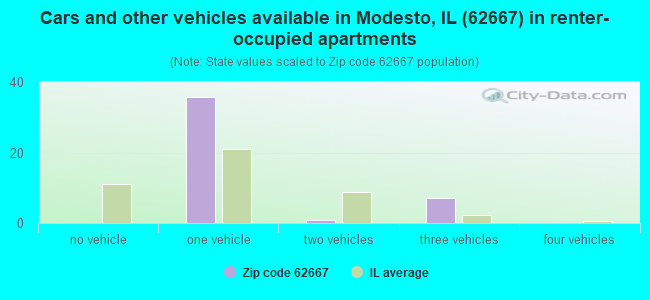
Houses and condos: 303 Renter-occupied apartments: 43
% of renters here:
18%
State:
33%
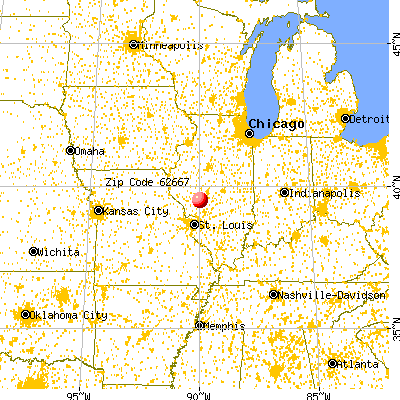
March 2022 cost of living index in zip code 62667: 84.6 (less than average, U.S. average is 100)
Land area: 36.9 sq. mi. Water area: 0.0 sq. mi.
Population density: 15 people per square mile
(very low).
OSM Map
General Map
Google Map
MSN Map
OSM Map
General Map
Google Map
MSN Map
OSM Map
General Map
Google Map
MSN Map
OSM Map
General Map
Google Map
MSN Map
Please wait while loading the map...
Real estate property taxes paid for housing units in 2022:
This zip code:
1.6% ($2,561)
Illinois:
2.0% ($4,912)
Median real estate property taxes paid for housing units with mortgages in 2022: $2,115 (1.6%) Median real estate property taxes paid for housing units with no mortgage in 2022: $3,579 (2.2%)
Business Search- 14 Million verified businesses
Males: 270
(49.0%)
Females: 281
(51.0%)
For population 25 years and over in 62667:
High school or higher: 86.6%
Bachelor's degree or higher: 32.4%
Graduate or professional degree: 5.6%
Unemployed: 3.4%
Mean travel time to work (commute): 20.7 minutes
For population 15 years and over in 62667:
Never married: 22.4%
Now married: 70.4%
Separated: 2.0%
Widowed: 1.8%
Divorced: 3.4%
Zip code 62667 compared to state average:
Median house value below state average.
Black race population percentage significantly below state average.
Hispanic race population percentage significantly below state average.
Median age significantly above state average.
Foreign-born population percentage significantly below state average.
Renting percentage below state average.
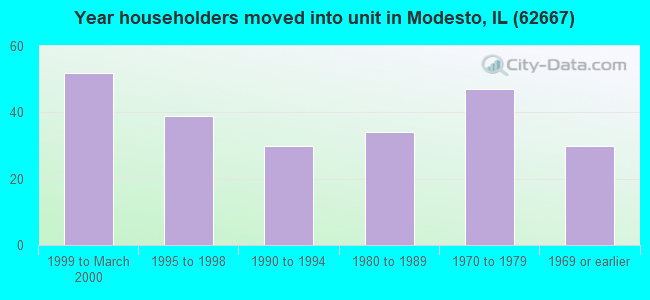
Length of stay since moving in significantly above state average.
Estimated median house/condo value in 2022: $163,209
62667:
$163,209
Illinois:
$251,600
Median resident age:
This zip code:
50.0 years
Illinois median age:
39.1 years
Average household size:
This zip code:
2.3 people
Illinois:
2.4 people
Averages for the 2020 tax year for zip code 62667, filed in 2021:
Average Adjusted Gross Income (AGI) in 2020: $60,283 (Individual Income Tax Returns)
Here:
$60,283
State:
$82,626
Salary/wage: $44,135 (reported on 73.9% of returns)
Here:
$44,135
State:
$66,640
(% of AGI for various income ranges: 1105.0% for AGIs below $25k, 2832.5% for AGIs $25k-50k, 8790.0% for AGIs $50k-75k, 4040.0% for AGIs $75k-100k)
Taxable interest for individuals: $500 (reported on 39.1% of returns)
This zip code:
$500
Illinois:
$2,376
(% of AGI for various income ranges: 60.0% for AGIs below $25k, 25.0% for AGIs $50k-75k)
Ordinary dividends: $1,467 (reported on 13.0% of returns)
Here:
$1,467
State:
$9,061
(% of AGI for various income ranges: 220.0% for AGIs $50k-75k)
Net capital gain/loss in AGI: +$9,433 (reported on 13.0% of returns)
Here:
+$9,433
State:
+$31,684
(% of AGI for various income ranges: 707.5% for AGIs $25k-50k)
Profit/loss from business: +$5,600 (reported on 13.0% of returns)
Here:
+$5,600
State:
+$12,175
(% of AGI for various income ranges: 420.0% for AGIs below $25k)
Earned income credit: $2,400 (reported on 8.7% of returns)
Here:
$2,400
State:
$2,311
(% of AGI for various income ranges: 120.0% for AGIs below $25k)
Percentage of individuals using paid preparers for their 2020 taxes: 100.0%
Here:
100%
State:
93%
(% for various income ranges: 100.0% for AGIs below $25k, 100.0% for AGIs $25k-50k, 100.0% for AGIs $50k-75k, 100.0% for AGIs $75k-100k, 100.0% for AGIs $100k-200k)
Averages for the 2012 tax year for zip code 62667, filed in 2013:
Average Adjusted Gross Income (AGI) in 2012: $60,983 (Individual Income Tax Returns)
Here:
$60,983
State:
$68,058
Salary/wage: $37,472 (reported on 78.3% of returns)
Here:
$37,472
State:
$55,396
(% of AGI for various income ranges: 63.2% for AGIs below $25k, 64.4% for AGIs $25k-50k, 125.3% for AGIs $50k-75k, 31.8% for AGIs $100k-200k)
Taxable interest for individuals: $964 (reported on 47.8% of returns)
This zip code:
$964
Illinois:
$1,969
(% of AGI for various income ranges: 3.2% for AGIs below $25k, 0.3% for AGIs $25k-50k, 0.6% for AGIs $50k-75k, 0.8% for AGIs $100k-200k)
Ordinary dividends: $883 (reported on 26.1% of returns)
Here:
$883
State:
$7,786
Net capital gain/loss in AGI: +$3,233 (reported on 13.0% of returns)
Here:
+$3,233
State:
+$22,183
Profit/loss from business: +$2,300 (reported on 13.0% of returns)
Here:
+$2,300
State:
+$12,903
Total itemized deductions: $17,950 (12% of AGI, reported on 17.4% of returns)
Here:
$17,950
State:
$26,433
Here:
12.0% of AGI
State:
19.2% of AGI
Taxes paid: $8,075 (reported on 17.4% of returns)
62667:
$8,075
State:
$11,968
Earned income credit: $2,375 (reported on 17.4% of returns)
Here:
$2,375
State:
$2,349
(% of AGI for various income ranges: 10.6% for AGIs below $25k)
Percentage of individuals using paid preparers for their 2012 taxes: 69.6%
Here:
70%
State:
57%
(% for various income ranges: 75.0% for AGIs below $25k, 60.0% for AGIs $25k-50k, 100.0% for AGIs $50k-75k, 75.0% for AGIs $100k-200k)
Averages for the 2004 tax year for zip code 62667, filed in 2005:
Average Adjusted Gross Income (AGI) in 2004: $36,743 (Individual Income Tax Returns)
Here:
$36,743
State:
$54,625
Salary/wage: $30,566 (reported on 74.3% of returns)
Here:
$30,566
State:
$46,811
(% of AGI for various income ranges: 58.1% for AGIs below $10k, 60.0% for AGIs $10k-25k, 78.5% for AGIs $25k-50k, 75.1% for AGIs $50k-75k, 81.2% for AGIs $75k-100k)
Taxable interest for individuals: $1,043 (reported on 56.3% of returns)
This zip code:
$1,043
Illinois:
$2,101
(% of AGI for various income ranges: 10.4% for AGIs below $10k, 3.4% for AGIs $10k-25k, 0.8% for AGIs $25k-50k, 0.5% for AGIs $50k-75k, 4.0% for AGIs $75k-100k)
Taxable dividends: $738 (reported on 26.5% of returns)
Here:
$738
State:
$4,306
(% of AGI for various income ranges: 4.6% for AGIs below $10k, 0.3% for AGIs $25k-50k, 0.5% for AGIs $50k-75k, 1.2% for AGIs $75k-100k)
Net capital gain/loss: +$541 (reported on 15.1% of returns)
Here:
+$541
State:
+$17,321
Profit/loss from business: +$1,756 (reported on 16.7% of returns)
Here:
+$1,756
State:
+$11,771
Profit/loss from farming: +$4,926 (reported on 11.0% of returns)
Here:
+$4,926
State:
+$2,327
Total itemized deductions: $12,615 (21% of AGI, reported on 10.6% of returns)
Here:
$12,615
State:
$20,239
Here:
20.9% of AGI
State:
19.5% of AGI
Charity contributions deductions: $2,333 (4% of AGI, reported on 7.3% of returns)
Here:
$2,333
State:
$3,719
Here:
3.7% of AGI
State:
3.4% of AGI
Total tax: $4,899 (reported on 76.7% of returns)
62667:
$4,899
State:
$9,882
(% of AGI for various income ranges: 3.5% for AGIs below $10k, 5.1% for AGIs $10k-25k, 7.4% for AGIs $25k-50k, 9.2% for AGIs $50k-75k, 13.1% for AGIs $75k-100k, 18.3% for AGIs over 100k)
Earned income credit: $1,000 (reported on 12.7% of returns)
Here:
$1,000
State:
$1,788
Percentage of individuals using paid preparers for their 2004 taxes: 68.6%
Here:
69%
State:
61%
(% for various income ranges: 62.7% for AGIs below $10k, 66.7% for AGIs $10k-25k, 74.1% for AGIs $25k-50k, 71.1% for AGIs $50k-75k, 120.0% for AGIs $75k-100k)
Household received Food Stamps/SNAP in the past 12 months: 22 Household did not receive Food Stamps/SNAP in the past 12 months: 213
Women who did not have a birth in the past 12 months: 136 (82 now married, 52 unmarried)
Housing units in zip code 62667 with a mortgage: 50 (1 second mortgage) Median monthly owner costs for units with a mortgage: $1,037 Median monthly owner costs for units without a mortgage: $827
Residents with income below the poverty level in 2022:
This zip code:
5.1%
Whole state:
11.9%
Residents with income below 50% of the poverty level in 2022:
This zip code:
4.5%
Whole state:
5.7%
Median number of rooms in houses and condos:
Here:
5.6
State:
6.4
Median number of rooms in apartments:
Here:
5.2
State:
4.1
Notable locations in this zip code not listed on our city pages
Cemeteries: Blue Grass Cemetery (1), Nifong Cemetery (2), Oak Grove Cemetery (3), Panther Creek Cemetery (4), Pulliam Cemetery (5), Sims Old Cemetery (6). Display/hide their locations on the map
Size of family households: 89 2-persons, 76 3-persons, 20 4-persons, 7 5-persons
Size of nonfamily households: 35 1-person, 7 2-persons
60 married couples with children.
12 single-parent households (6 men, 6 women).
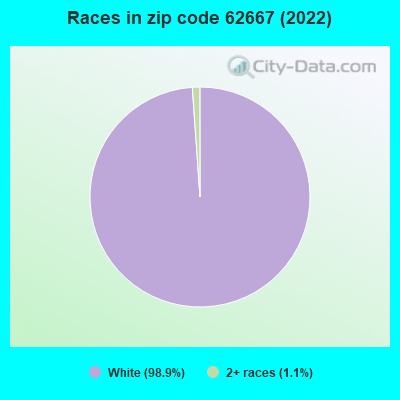
99.4% of residents of 62667 zip code speak English at home.
0.2% of residents speak other Indo-European language at home (100% very well).
Foreign born population: 0 (0.0%)
:
0.0%
Whole state:
14.4%
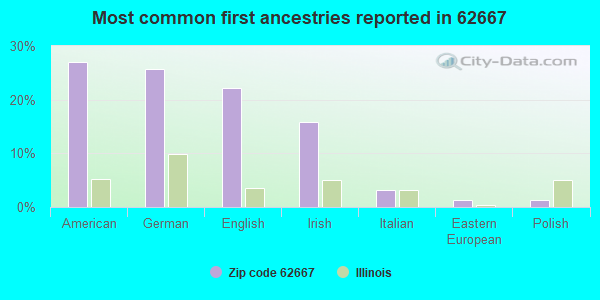
27%American
26%German
22%English
16%Irish
3%Italian
1%Eastern European
1%Polish
Year of entry for the foreign-born population
02010 or later
02000 to 2009
01990 to 1999
5Before 1990
Facilities with environmental interests located in this zip code:
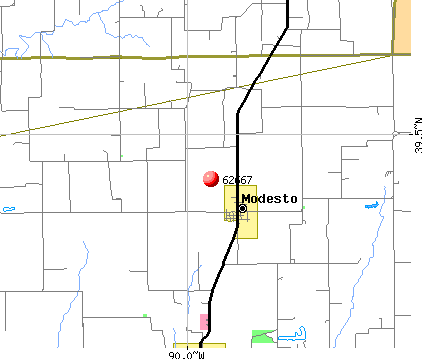
PLOWMAN OIL CO (132 R EAST STATE in MODESTO, IL)
STATE MASTER (Illinois EPA Project) - AIR PROGRAM AIR MINOR (AIRS/AFS) Business SIC classification: PETROLEUM BULK STATIONS AND TERMINALS
PATTERSON AUTO BODY (R R 1 in MODESTO, IL)
STATE MASTER (Illinois EPA Project) - HAZARDOUS WASTE PROGRAM Conditionally Exempt Small Quantity Generators, less than 100 kg/month of hazardous waste (Resource Conservation and Recovery Act (tracking hazardous waste)) - notification Organizations: PATTERSON JERRY (CONTACT/OWNER)
Housing units lacking complete plumbing facilities: 0.5% Housing units lacking complete kitchen facilities: 1.6%
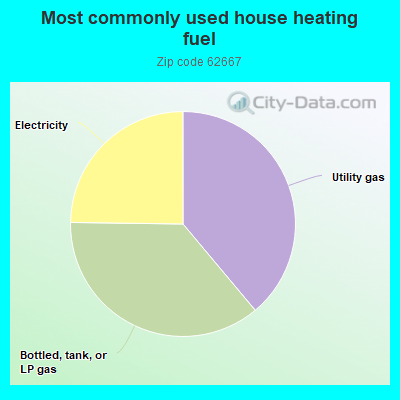
39.1%Utility gas
36.5%Bottled, tank, or LP gas
24.9%Electricity
Population in 1990: 564. Population change in the 1990s: +34 (+6.0%).
Place of birth for U.S.-born residents:
This state: 487
Northeast: 2
Midwest: 34
South: 10
West: 10
53% of the 62667 zip code residents lived in the same house 5 years ago. Out of people who lived in different houses, 64% lived in this county. Out of people who lived in different counties, 50% lived in Illinois.
98% of the 62667 zip code residents lived in the same house 1 year ago. Out of people who lived in different houses, 44% moved from this county. Out of people who lived in different houses, 44% moved from different county within same state.
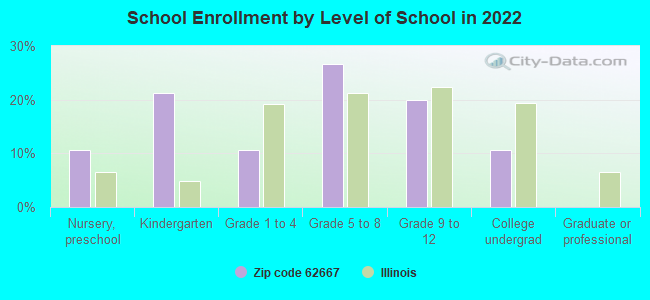
Private vs. public school enrollment:
Students in private schools in grades 1 to 8 (elementary and middle school):
Here:
0.0%
Illinois:
13.3%
Students in private schools in grades 9 to 12 (high school):
Here:
0.0%
Illinois:
9.9%
Students in private undergraduate colleges: 1
Here:
21.2%
Illinois:
27.4%
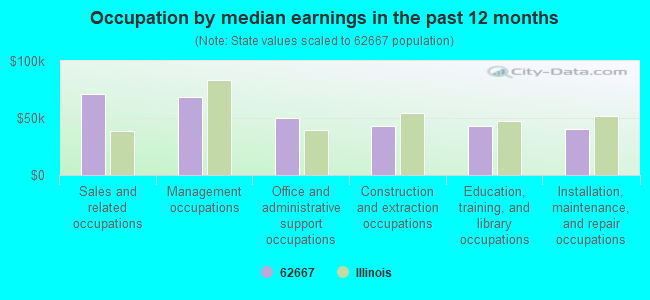
Occupation by median earnings in the past 12 months ($)
70,695Sales and related occupations
68,215Management occupations
50,416Office and administrative support occupations
43,220Construction and extraction occupations
42,602Education, training, and library occupations
39,916Installation, maintenance, and repair occupations
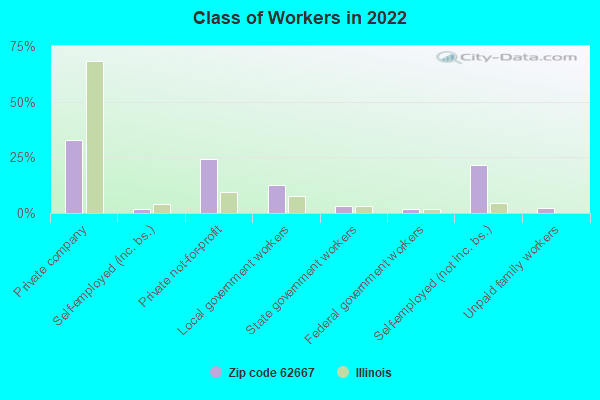
Top industries in this zip code by the number of employees in 2005:
Administrative and Support and Waste Management and Remediation Services: Temporary Help Services (250-499 employees: 1 establishment)
Accommodation and Food Services: Full-Service Restaurants (5-9: 1)
Finance and Insurance: Commercial Banking (5-9: 1)
Construction: Site Preparation Contractors (1-4: 2)
Other Services (except Public Administration): Religious Organizations (1-4: 2)
Other Services (except Public Administration): Automotive Body, Paint, and Interior Repair and Maintenance (1-4: 1)
Construction: Electrical Contractors (1-4: 1)
Accommodation and Food Services: Drinking Places (Alcoholic Beverages) (1-4: 1)
Home Mortgage Disclosure Act Aggregated Statistics For Year 2009 (Based on 2 partial tracts)
A) FHA, FSA/RHS & VA Home Purchase Loans
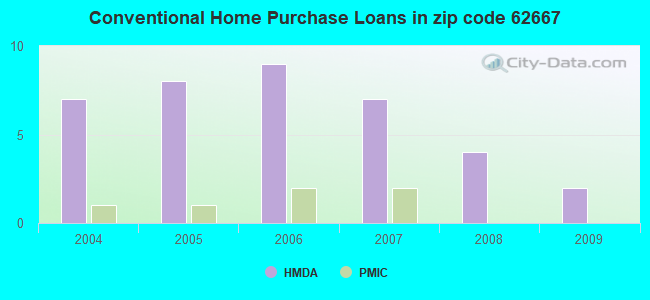
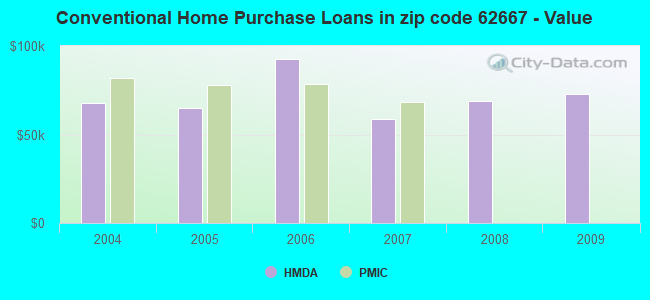
B) Conventional Home Purchase Loans
C) Refinancings
D) Home Improvement Loans
F) Non-occupant Loans on < 5 Family Dwellings (A B C & D)
G) Loans On Manufactured Home Dwelling (A B C & D)
Number
Average Value
Number
Average Value
Number
Average Value
Number
Average Value
Number
Average Value
Number
Average Value
LOANS ORIGINATED
1
$57,670
2
$73,005
32
$109,011
3
$33,537
3
$108,793
1
$24,950
APPLICATIONS APPROVED, NOT ACCEPTED
0
$0
0
$0
3
$139,197
0
$0
0
$0
0
$0
APPLICATIONS DENIED
0
$0
2
$49,695
3
$108,793
0
$0
1
$48,670
0
$0
APPLICATIONS WITHDRAWN
0
$0
0
$0
1
$62,990
0
$0
0
$0
0
$0
FILES CLOSED FOR INCOMPLETENESS
0
$0
0
$0
0
$0
0
$0
0
$0
0
$0
Aggregated Statistics For Year 2008 (Based on 2 partial tracts)
A) FHA, FSA/RHS & VA Home Purchase Loans
B) Conventional Home Purchase Loans
C) Refinancings
D) Home Improvement Loans
G) Loans On Manufactured Home Dwelling (A B C & D)
Number
Average Value
Number
Average Value
Number
Average Value
Number
Average Value
Number
Average Value
LOANS ORIGINATED
2
$74,440
4
$69,120
17
$88,344
2
$53,580
2
$58,895
APPLICATIONS APPROVED, NOT ACCEPTED
0
$0
1
$88,750
2
$89,980
0
$0
1
$52,350
APPLICATIONS DENIED
1
$74,440
3
$42,263
3
$101,023
2
$45,810
1
$76,890
APPLICATIONS WITHDRAWN
0
$0
0
$0
1
$146,010
0
$0
0
$0
FILES CLOSED FOR INCOMPLETENESS
0
$0
0
$0
0
$0
0
$0
0
$0
Aggregated Statistics For Year 2007 (Based on 2 partial tracts)
B) Conventional Home Purchase Loans
C) Refinancings
D) Home Improvement Loans
F) Non-occupant Loans on < 5 Family Dwellings (A B C & D)
G) Loans On Manufactured Home Dwelling (A B C & D)
Number
Average Value
Number
Average Value
Number
Average Value
Number
Average Value
Number
Average Value
LOANS ORIGINATED
7
$59,013
14
$79,551
5
$31,574
2
$46,830
2
$52,965
APPLICATIONS APPROVED, NOT ACCEPTED
0
$0
0
$0
1
$28,630
0
$0
0
$0
APPLICATIONS DENIED
3
$42,943
6
$68,848
2
$29,245
0
$0
0
$0
APPLICATIONS WITHDRAWN
1
$97,340
2
$31,900
0
$0
0
$0
0
$0
FILES CLOSED FOR INCOMPLETENESS
0
$0
0
$0
0
$0
0
$0
0
$0
Aggregated Statistics For Year 2006 (Based on 2 partial tracts)
A) FHA, FSA/RHS & VA Home Purchase Loans
B) Conventional Home Purchase Loans
C) Refinancings
D) Home Improvement Loans
F) Non-occupant Loans on < 5 Family Dwellings (A B C & D)
G) Loans On Manufactured Home Dwelling (A B C & D)
Number
Average Value
Number
Average Value
Number
Average Value
Number
Average Value
Number
Average Value
Number
Average Value
LOANS ORIGINATED
1
$42,130
9
$92,389
12
$83,641
2
$19,630
1
$45,400
1
$82,620
APPLICATIONS APPROVED, NOT ACCEPTED
0
$0
2
$80,165
3
$110,567
0
$0
0
$0
0
$0
APPLICATIONS DENIED
0
$0
2
$66,665
7
$97,050
2
$30,675
0
$0
2
$53,170
APPLICATIONS WITHDRAWN
0
$0
1
$123,520
6
$145,263
0
$0
0
$0
0
$0
FILES CLOSED FOR INCOMPLETENESS
0
$0
0
$0
1
$122,700
0
$0
0
$0
0
$0
Aggregated Statistics For Year 2005 (Based on 2 partial tracts)
A) FHA, FSA/RHS & VA Home Purchase Loans
B) Conventional Home Purchase Loans
C) Refinancings
D) Home Improvement Loans
F) Non-occupant Loans on < 5 Family Dwellings (A B C & D)
G) Loans On Manufactured Home Dwelling (A B C & D)
Number
Average Value
Number
Average Value
Number
Average Value
Number
Average Value
Number
Average Value
Number
Average Value
LOANS ORIGINATED
1
$33,130
8
$64,980
7
$105,171
3
$7,633
2
$50,920
0
$0
APPLICATIONS APPROVED, NOT ACCEPTED
0
$0
1
$56,030
1
$87,930
0
$0
0
$0
1
$39,260
APPLICATIONS DENIED
0
$0
3
$35,037
5
$215,134
1
$18,400
0
$0
2
$42,945
APPLICATIONS WITHDRAWN
0
$0
2
$67,280
4
$145,502
2
$48,055
0
$0
0
$0
FILES CLOSED FOR INCOMPLETENESS
0
$0
0
$0
0
$0
0
$0
0
$0
0
$0
Aggregated Statistics For Year 2004 (Based on 2 partial tracts)
B) Conventional Home Purchase Loans
C) Refinancings
D) Home Improvement Loans
F) Non-occupant Loans on < 5 Family Dwellings (A B C & D)
G) Loans On Manufactured Home Dwelling (A B C & D)


 Nearest zip codes: 62674, 62692, 62638, 62649, 62640, 62672.