Estimated zip code population in 2022: 2,834 Zip code population in 2010: 3,033 Zip code population in 2000: 3,077
Houses and condos: 1,581 Renter-occupied apartments: 185
% of renters here:
18%
State:
33%
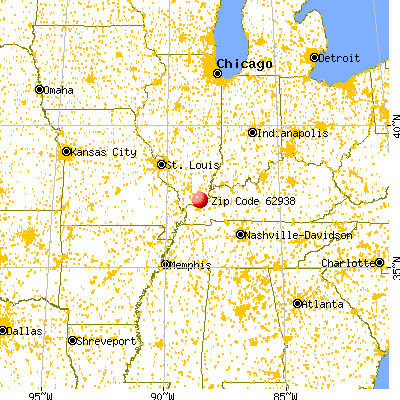
March 2022 cost of living index in zip code 62938: 83.1 (low, U.S. average is 100)
Land area: 168.2 sq. mi. Water area: 3.5 sq. mi.
Population density: 17 people per square mile
(very low).
OSM Map
General Map
Google Map
MSN Map
OSM Map
General Map
Google Map
MSN Map
OSM Map
General Map
Google Map
MSN Map
OSM Map
General Map
Google Map
MSN Map
Please wait while loading the map...
Real estate property taxes paid for housing units in 2022:
This zip code:
1.3% ($1,664)
Illinois:
2.0% ($4,912)
Median real estate property taxes paid for housing units with mortgages in 2022: $1,547 (1.2%) Median real estate property taxes paid for housing units with no mortgage in 2022: $2,067 (1.6%)
Business Search- 14 Million verified businesses
Males: 1,505
(53.1%)
Females: 1,328
(46.9%)
For population 25 years and over in 62938:
High school or higher: 85.8%
Bachelor's degree or higher: 17.0%
Graduate or professional degree: 4.8%
Unemployed: 7.4%
Mean travel time to work (commute): 27.5 minutes
For population 15 years and over in 62938:
Never married: 27.0%
Now married: 49.1%
Separated: 1.2%
Widowed: 7.1%
Divorced: 15.6%
Zip code 62938 compared to state average:
Median house value below state average.
Black race population percentage significantly below state average.
Hispanic race population percentage significantly below state average.
Median age significantly above state average.
Foreign-born population percentage significantly below state average.
Renting percentage below state average.
Length of stay since moving in significantly above state average.
Percentage of population with a bachelor's degree or higher below state average.
Averages for the 2020 tax year for zip code 62938, filed in 2021:
Average Adjusted Gross Income (AGI) in 2020: $53,702 (Individual Income Tax Returns)
Here:
$53,702
State:
$82,626
Salary/wage: $43,686 (reported on 72.4% of returns)
Here:
$43,686
State:
$66,640
(% of AGI for various income ranges: 961.6% for AGIs below $25k, 3148.9% for AGIs $25k-50k, 5280.0% for AGIs $50k-75k, 8170.0% for AGIs $75k-100k, 18264.3% for AGIs $100k-200k)
Taxable interest for individuals: $1,015 (reported on 32.4% of returns)
This zip code:
$1,015
Illinois:
$2,376
(% of AGI for various income ranges: 27.2% for AGIs below $25k, 30.0% for AGIs $25k-50k, 39.1% for AGIs $50k-75k, 41.2% for AGIs $75k-100k, 210.0% for AGIs $100k-200k)
Ordinary dividends: $2,794 (reported on 15.2% of returns)
Here:
$2,794
State:
$9,061
(% of AGI for various income ranges: 16.8% for AGIs below $25k, 31.1% for AGIs $25k-50k, 96.4% for AGIs $50k-75k, 51.2% for AGIs $75k-100k, 288.6% for AGIs $100k-200k)
Net capital gain/loss in AGI: +$4,181 (reported on 15.2% of returns)
Here:
+$4,181
State:
+$31,684
(% of AGI for various income ranges: 4.4% for AGIs below $25k, 128.9% for AGIs $25k-50k, 89.1% for AGIs $50k-75k, 135.0% for AGIs $75k-100k, 314.3% for AGIs $100k-200k)
Profit/loss from business: +$5,200 (reported on 14.3% of returns)
Here:
+$5,200
State:
+$12,175
(% of AGI for various income ranges: 90.8% for AGIs below $25k, 211.1% for AGIs $25k-50k, 32.5% for AGIs $75k-100k, 210.0% for AGIs $100k-200k)
Taxable individual retirement arrangement distribution: $15,445 (reported on 10.5% of returns)
62938:
$15,445
Illinois:
$21,613
(% of AGI for various income ranges: 65.6% for AGIs below $25k, 133.3% for AGIs $25k-50k, 457.3% for AGIs $50k-75k, 1131.4% for AGIs $100k-200k)
Total itemized deductions: $27,333 (reported on 2.9% of returns)
Here:
$27,333
State:
$34,948
(% of AGI for various income ranges: 745.5% for AGIs $50k-75k)
Taxes paid: $6,933 (reported on 2.9% of returns)
62938:
$6,933
State:
$8,563
(% of AGI for various income ranges: 260.0% for AGIs $75k-100k)
Earned income credit: $2,379 (reported on 18.1% of returns)
Here:
$2,379
State:
$2,311
(% of AGI for various income ranges: 110.4% for AGIs below $25k, 97.8% for AGIs $25k-50k)
Percentage of individuals using paid preparers for their 2020 taxes: 94.3%
Here:
94%
State:
93%
(% for various income ranges: 94.7% for AGIs below $25k, 91.7% for AGIs $25k-50k, 94.1% for AGIs $50k-75k, 91.7% for AGIs $75k-100k, 116.7% for AGIs $100k-200k, 0.0% for AGIs over 200k)
Averages for the 2012 tax year for zip code 62938, filed in 2013:
Average Adjusted Gross Income (AGI) in 2012: $45,281 (Individual Income Tax Returns)
Here:
$45,281
State:
$68,058
Salary/wage: $39,680 (reported on 74.5% of returns)
Here:
$39,680
State:
$55,396
(% of AGI for various income ranges: 62.6% for AGIs below $25k, 61.4% for AGIs $25k-50k, 66.7% for AGIs $50k-75k, 69.7% for AGIs $75k-100k, 65.2% for AGIs $100k-200k)
Taxable interest for individuals: $1,093 (reported on 41.5% of returns)
This zip code:
$1,093
Illinois:
$1,969
(% of AGI for various income ranges: 2.2% for AGIs below $25k, 1.4% for AGIs $25k-50k, 0.8% for AGIs $50k-75k, 0.6% for AGIs $75k-100k, 0.7% for AGIs $100k-200k)
Ordinary dividends: $2,241 (reported on 16.0% of returns)
Here:
$2,241
State:
$7,786
(% of AGI for various income ranges: 1.1% for AGIs below $25k, 0.9% for AGIs $25k-50k, 0.9% for AGIs $50k-75k, 1.0% for AGIs $100k-200k)
Net capital gain/loss in AGI: +$1,033 (reported on 14.2% of returns)
Here:
+$1,033
State:
+$22,183
(% of AGI for various income ranges: 0.1% for AGIs below $25k, 0.3% for AGIs $25k-50k, 0.2% for AGIs $75k-100k, 0.8% for AGIs $100k-200k)
Profit/loss from business: +$5,053 (reported on 16.0% of returns)
Here:
+$5,053
State:
+$12,903
(% of AGI for various income ranges: 5.9% for AGIs below $25k, 1.2% for AGIs $25k-50k, 0.5% for AGIs $50k-75k, 2.0% for AGIs $75k-100k, 1.4% for AGIs $100k-200k)
Taxable individual retirement arrangement distribution: $13,338 (reported on 12.3% of returns)
62938:
$13,338
Illinois:
$17,929
(% of AGI for various income ranges: 4.2% for AGIs below $25k, 3.5% for AGIs $25k-50k, 6.1% for AGIs $50k-75k, 3.6% for AGIs $100k-200k)
Total itemized deductions: $18,450 (23% of AGI, reported on 18.9% of returns)
Here:
$18,450
State:
$26,433
Here:
23.3% of AGI
State:
19.2% of AGI
(% of AGI for various income ranges: 6.1% for AGIs below $25k, 6.6% for AGIs $25k-50k, 6.5% for AGIs $50k-75k, 9.3% for AGIs $75k-100k, 9.0% for AGIs $100k-200k)
Charity contributions: $3,925 (reported on 11.3% of returns)
Here:
$3,925
State:
$4,525
(% of AGI for various income ranges: 1.9% for AGIs below $25k, 0.8% for AGIs $50k-75k, 1.0% for AGIs $75k-100k, 1.3% for AGIs $100k-200k)
Taxes paid: $5,095 (reported on 18.9% of returns)
62938:
$5,095
State:
$11,968
(% of AGI for various income ranges: 1.0% for AGIs below $25k, 1.0% for AGIs $25k-50k, 1.7% for AGIs $50k-75k, 2.6% for AGIs $75k-100k, 3.3% for AGIs $100k-200k)
Earned income credit: $2,252 (reported on 19.8% of returns)
Here:
$2,252
State:
$2,349
(% of AGI for various income ranges: 7.1% for AGIs below $25k, 0.9% for AGIs $25k-50k)
Percentage of individuals using paid preparers for their 2012 taxes: 67.0%
Here:
67%
State:
57%
(% for various income ranges: 58.1% for AGIs below $25k, 68.0% for AGIs $25k-50k, 72.2% for AGIs $50k-75k, 80.0% for AGIs $75k-100k, 80.0% for AGIs $100k-200k)
Averages for the 2004 tax year for zip code 62938, filed in 2005:
Average Adjusted Gross Income (AGI) in 2004: $32,156 (Individual Income Tax Returns)
Here:
$32,156
State:
$54,625
Salary/wage: $29,847 (reported on 77.6% of returns)
Here:
$29,847
State:
$46,811
(% of AGI for various income ranges: 449.8% for AGIs below $10k, 62.4% for AGIs $10k-25k, 74.8% for AGIs $25k-50k, 72.1% for AGIs $50k-75k, 83.9% for AGIs $75k-100k, 45.0% for AGIs over 100k)
Taxable interest for individuals: $1,398 (reported on 47.3% of returns)
This zip code:
$1,398
Illinois:
$2,101
(% of AGI for various income ranges: 46.5% for AGIs below $10k, 2.6% for AGIs $10k-25k, 1.7% for AGIs $25k-50k, 2.1% for AGIs $50k-75k, 0.6% for AGIs $75k-100k, 1.7% for AGIs over 100k)
Taxable dividends: $1,261 (reported on 18.5% of returns)
Here:
$1,261
State:
$4,306
(% of AGI for various income ranges: 13.0% for AGIs below $10k, 0.5% for AGIs $10k-25k, 0.7% for AGIs $25k-50k, 0.5% for AGIs $50k-75k, 0.2% for AGIs $75k-100k, 1.6% for AGIs over 100k)
Net capital gain/loss: +$2,056 (reported on 15.8% of returns)
Here:
+$2,056
State:
+$17,321
(% of AGI for various income ranges: -2.3% for AGIs below $10k, 0.2% for AGIs $10k-25k, 0.3% for AGIs $25k-50k, 1.5% for AGIs $50k-75k, -0.2% for AGIs $75k-100k, 4.2% for AGIs over 100k)
Profit/loss from business: +$3,266 (reported on 13.5% of returns)
Here:
+$3,266
State:
+$11,771
(% of AGI for various income ranges: -27.0% for AGIs below $10k, 3.4% for AGIs $10k-25k, 0.6% for AGIs $25k-50k, 0.6% for AGIs $50k-75k, 4.9% for AGIs $75k-100k)
Total itemized deductions: $14,512 (25% of AGI, reported on 15.1% of returns)
Here:
$14,512
State:
$20,239
Here:
25.4% of AGI
State:
19.5% of AGI
(% of AGI for various income ranges: 5.3% for AGIs $10k-25k, 5.7% for AGIs $25k-50k, 7.9% for AGIs $50k-75k, 8.7% for AGIs $75k-100k, 7.4% for AGIs over 100k)
Charity contributions deductions: $3,213 (6% of AGI, reported on 10.7% of returns)
Here:
$3,213
State:
$3,719
Here:
5.6% of AGI
State:
3.4% of AGI
(% of AGI for various income ranges: 0.8% for AGIs $10k-25k, 0.9% for AGIs $25k-50k, 1.5% for AGIs $50k-75k, 1.3% for AGIs $75k-100k, 0.7% for AGIs over 100k)
Total tax: $3,961 (reported on 72.4% of returns)
62938:
$3,961
State:
$9,882
(% of AGI for various income ranges: 11.6% for AGIs below $10k, 3.4% for AGIs $10k-25k, 6.6% for AGIs $25k-50k, 9.0% for AGIs $50k-75k, 10.8% for AGIs $75k-100k, 18.8% for AGIs over 100k)
Earned income credit: $1,651 (reported on 16.6% of returns)
Here:
$1,651
State:
$1,788
Percentage of individuals using paid preparers for their 2004 taxes: 70.7%
Here:
71%
State:
61%
(% for various income ranges: 58.4% for AGIs below $10k, 74.5% for AGIs $10k-25k, 72.2% for AGIs $25k-50k, 77.6% for AGIs $50k-75k, 64.4% for AGIs $75k-100k, 93.3% for AGIs over 100k)
Household received Food Stamps/SNAP in the past 12 months: 149 Household did not receive Food Stamps/SNAP in the past 12 months: 877
Women who had a birth in the past 12 months: 28 (24 now married, 3 unmarried) Women who did not have a birth in the past 12 months: 370 (156 now married, 213 unmarried)
Housing units in zip code 62938 with a mortgage: 362 (22 second mortgage, 22 both second mortgage and home equity loan) Median monthly owner costs for units with a mortgage: $1,077 Median monthly owner costs for units without a mortgage: $531
Residents with income below the poverty level in 2022:
This zip code:
22.0%
Whole state:
11.9%
Residents with income below 50% of the poverty level in 2022:
This zip code:
3.6%
Whole state:
5.7%
Median number of rooms in houses and condos:
Here:
5.8
State:
6.4
Median number of rooms in apartments:
Here:
3.8
State:
4.1
Notable locations in this zip code not listed on our city pages
Notable locations in zip code 62938: Golconda Marina (A), Oak Point Campground (B), Shawnee Camp (C), Ropers Landing (D), Signal Point Trail Point of Interest (E), Duck Bay Campground (F), Goose Bay Picnic Area (G), Lake Glendale Recreation Area (H), Steamboat Hill Campground (I), Golconda Civilian Conservation Center (J), Indian Kitchen Point of Interest (K), Hobbs Fish Farm (L), Barton Landing Light (M), Rural Pope County Fire Protection District Station 4 (N), Rural Pope County Fire Protection District Station 1 (O), Golconda Volunteer Fire Department (P), Pope County Volunteer Ambulance Service (Q). Display/hide their locations on the map
Churches in zip code 62938 include: Bay Valley United Methodist Church (A), Dutton Chapel (B), Sincere Church (C), Dixon Springs Church (D), Antioch Church (E), Bethany Church (F), Bethesda Church (G), Independence Church (H), Mount Pleasant Church (I). Display/hide their locations on the map
Cemeteries: Henley Cemetery (1), Williams Cemetery (2), Vaughn Cemetery (3), Thompson Cemetery (4), Sturgill Cemetery (5), Soward Cemetery (6), Sheldon Cemetery (7). Display/hide their locations on the map
Streams, rivers, and creeks: Lusk Creek (A), Bear Creek (B), Little Grand Pierre Creek (C), Hobbs Creek (D), Flick Branch (E), Flat Lick Branch (F), Cooney Creek (G), Cave Creek (H), Caney Creek (I). Display/hide their locations on the map
Parks in zip code 62938 include: Dixon Springs State Park (1), Golconda Historic District (2), Ohio River Recreation Area (3). Display/hide their locations on the map
In group quarters: 181 (-1 institutionalized population)
Size of family households: 388 2-persons, 104 3-persons, 96 4-persons, 65 5-persons, 10 6-persons
Size of nonfamily households: 352 1-person, 8 2-persons
162 married couples with children.
154 single-parent households (6 men, 148 women).
94.5% of residents of 62938 zip code speak English at home.
4.6% of residents speak Spanish at home (78% very well, 22% well).
0.7% of residents speak other Indo-European language at home (89% very well, 11% not well).
Foreign born population: 26 (0.9%) (19.4% of them are naturalized citizens)
This zip code:
0.9%
Whole state:
14.4%
35%Greece
35%Honduras
12%Barbados
8%North Macedonia (Macedonia)
17%English
16%Irish
16%German
14%American
2%Polish
2%Italian
2%European
Year of entry for the foreign-born population
92010 or later
22000 to 2009
01990 to 1999
14Before 1990
Facilities with environmental interests located in this zip code:
POPE COUNTY ELEMENTARY SCHOOL (ROUTE 2, BOX 22 in GOLCONDA, IL)
STATE MASTER (Illinois EPA Project) - National Pollutant Discharge Elimination System Permit (National Center for Education Statistics) - STATE ID-2007600102002 National Pollutant Discharge Elimination System NON-MAJOR (Tracking pollutant discharge elimination systems) - permit National Pollutant Discharge Elimination System NON-MAJOR (Tracking pollutant discharge elimination systems) - permit Business SIC classification: ELEMENTARY AND SECONDARY SCHOOLS Organizations: POPE CO COMM UNIT DIST 1 (SCHOOL DISTRICT)
Alternative names: POPE COUNTY ELEM SCHOOL
POPE COUNTY HIGH SCHOOL (ROUTE 2, BOX 22 in GOLCONDA, IL)
STATE MASTER (Illinois EPA Project) - National Pollutant Discharge Elimination System Permit (National Center for Education Statistics) - STATE ID-2007600100001 National Pollutant Discharge Elimination System NON-MAJOR (Tracking pollutant discharge elimination systems) - permit National Pollutant Discharge Elimination System NON-MAJOR (Tracking pollutant discharge elimination systems) - permit Business SIC classification: ELEMENTARY AND SECONDARY SCHOOLS Organizations: POPE CO COMM UNIT DIST 1 (SCHOOL DISTRICT)
Alternative names: POPE COUNTY HIGH SCHOOL DIST 1, POPE COUNTY HIGH SCHOOL STP, POPE COUNTY HS DIST 1 STP
IL DOC-DIXON SPRINGS WORK CAMP (5 DIXON SPRINGS STATE PARK in GOLCONDA, IL)
STATE MASTER (Illinois EPA Project) - National Pollutant Discharge Elimination System Permit National Pollutant Discharge Elimination System NON-MAJOR (Tracking pollutant discharge elimination systems) - permit Business SIC classification: CORRECTIONAL INSTITUTIONS Alternative names: DIXON SPRINGS WORK CAMP STP, VIENNA CORRECTIONAL CENTER
ILDOT BRIDGE 076 005 (IL 146 OVER LUSK CRK 1MI N in GOLCONDA, IL)
Small Quantity Generators, between 100 kg and 1000 kg of hazardous waste/month (Resource Conservation and Recovery Act (tracking hazardous waste)) - notification
LOCK AND DAM 51 (OLD 51 SITE in GOLCONDA, IL) . Federal Facility. ARMY CORPS OF ENGINEERS
Small Quantity Generators, between 100 kg and 1000 kg of hazardous waste/month (Resource Conservation and Recovery Act (tracking hazardous waste)) - notification Organizations: U S ARMY CORPS OF ENGINEERS (CONTACT/OWNER)
POPE COUNTY HIGHWAY DEPT (COUNTY BRIDGE 076 3000 in GOLCONDA, IL)
Small Quantity Generators, between 100 kg and 1000 kg of hazardous waste/month (Resource Conservation and Recovery Act (tracking hazardous waste)) - notification Organizations: POPE COUNTY HWY DEPT (CONTACT/OWNER)
Housing units lacking complete plumbing facilities: 23.1% Housing units lacking complete kitchen facilities: 6.6%
37.5%Bottled, tank, or LP gas
31.2%Electricity
28.6%Utility gas
1.7%Wood
1.1%Other fuel
Population in 1990: 2,997. Population change in the 1990s: +80 (+2.7%).
Place of birth for U.S.-born residents:
This state: 1,790
Northeast: 11
Midwest: 272
South: 674
West: 32
60% of the 62938 zip code residents lived in the same house 5 years ago. Out of people who lived in different houses, 38% lived in this county. Out of people who lived in different counties, 50% lived in Illinois.
84% of the 62938 zip code residents lived in the same house 1 year ago. Out of people who lived in different houses, 16% moved from this county. Out of people who lived in different houses, 29% moved from different county within same state. Out of people who lived in different houses, 60% moved from different state. Out of people who lived in different houses, 3% moved from abroad.
Private vs. public school enrollment:
Students in private schools in grades 1 to 8 (elementary and middle school):
Here:
0.0%
Illinois:
13.3%
Students in private schools in grades 9 to 12 (high school): 15
Here:
10.0%
Illinois:
9.9%
Students in private undergraduate colleges:
Here:
0.0%
Illinois:
27.4%
Occupation by median earnings in the past 12 months ($)
78,238Management occupations
58,349Installation, maintenance, and repair occupations
56,767Construction and extraction occupations
50,390Health technologists and technicians
47,527Transportation occupations
39,998Education, training, and library occupations
Top industries in this zip code by the number of employees in 2005:
Health Care and Social Assistance: Residential Mental Retardation Facilities (20-49 employees: 1 establishment, 10-19 employees: 1 establishment, 5-9 employees: 2 establishments)
Health Care and Social Assistance: Other Individual and Family Services (20-49: 1, 1-4: 1)
Health Care and Social Assistance: Nursing Care Facilities (20-49: 1)
Mining: Construction Sand and Gravel Mining (20-49: 1)
Other Services (except Public Administration): Religious Organizations (10-19: 1, 1-4: 5)
Health Care and Social Assistance: Ambulance Services (10-19: 1)
People in group quarters in 2010:
175 people in workers' group living quarters and job corps centers
173 people in state prisons
33 people in nursing facilities/skilled-nursing facilities
8 people in group homes intended for adults
People in group quarters in 2000:
214 people in job corps and vocational training facilities
55 people in nursing homes
12 people in other group homes
6 people in homes for the mentally ill
Fatal accident statistics in 2014:
Fatal accident count: 1
Vehicles involved in fatal accidents: 2
Fatal accidents caused by drunken drivers: 0
Fatalities: 1
Persons involved in fatal accidents: 5
Pedestrians involved in fatal accidents: 0
Fatal accident statistics in 2011:
Fatal accident count: 2
Vehicles involved in fatal accidents: 2
Fatal accidents caused by drunken drivers: 0
Fatalities: 2
Persons involved in fatal accidents: 6
Pedestrians involved in fatal accidents: 0
2002 - 2018 National Fire Incident Reporting System (NFIRS) incidents
Based on the data from the years 2002 - 2018 the average number of fires per year is 21. The highest number of reported fires - 44 took place in 2007, and the least - 4 in 2002. The data has an increasing trend.
When looking into fire subcategories, the most incidents belonged to: Outside Fires (51.8%), and Structure Fires (27.4%).
Fire incident types reported to NFIRS in Zip Code 62938


 Nearest zip codes: 62928, 42047, 62985, 62947, 62982, 42081.


 Based on the data from the years 2002 - 2018 the average number of fires per year is 21. The highest number of reported fires - 44 took place in 2007, and the least - 4 in 2002. The data has an increasing trend.
 When looking into fire subcategories, the most incidents belonged to: Outside Fires (51.8%), and Structure Fires (27.4%).