Estimated zip code population in 2022: 1,528 Zip code population in 2010: 1,730 Zip code population in 2000: 1,520
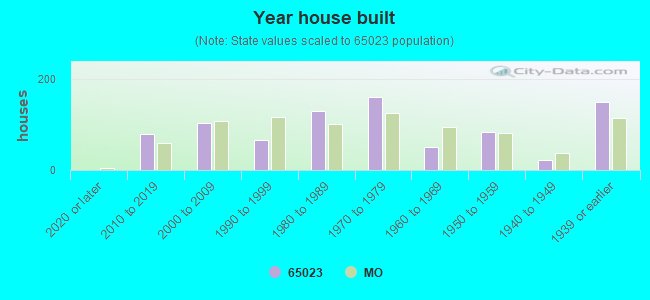
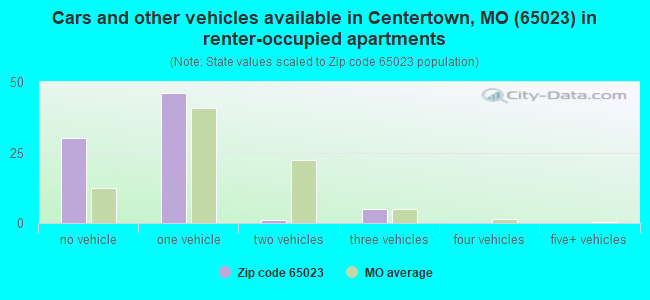
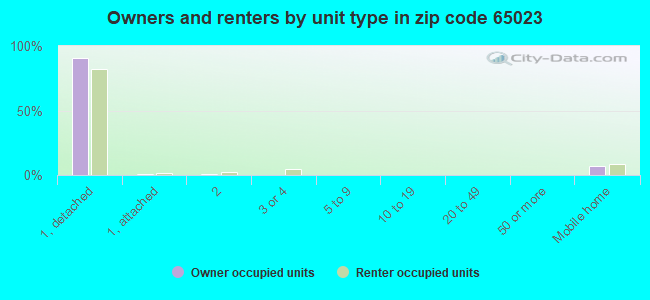
Houses and condos: 840 Renter-occupied apartments: 82
% of renters here:
12%
State:
32%
March 2022 cost of living index in zip code 65023: 77.6 (low, U.S. average is 100)
Land area: 53.8 sq. mi. Water area: 0.9 sq. mi.
Population density: 28 people per square mile
(very low).
OSM Map
General Map
Google Map
MSN Map
OSM Map
General Map
Google Map
MSN Map
OSM Map
General Map
Google Map
MSN Map
OSM Map
General Map
Google Map
MSN Map
Please wait while loading the map...
Real estate property taxes paid for housing units in 2022:
This zip code:
0.6% ($1,404)
Missouri:
0.8% ($1,810)
Median real estate property taxes paid for housing units with mortgages in 2022: $1,307 (0.6%) Median real estate property taxes paid for housing units with no mortgage in 2022: $1,503 (0.8%)
Business Search- 14 Million verified businesses
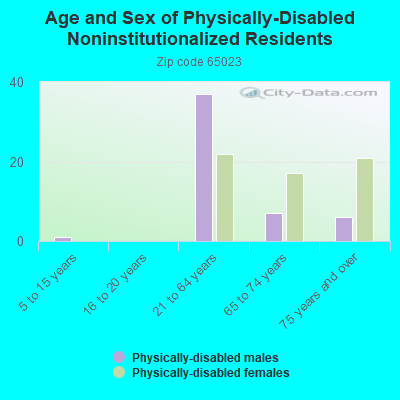
Males: 856
(56.0%)
Females: 672
(44.0%)
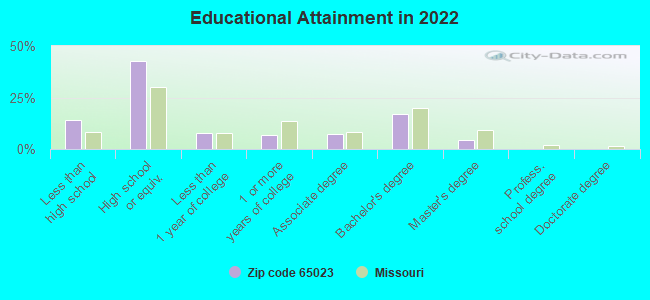
For population 25 years and over in 65023:
High school or higher: 85.0%
Bachelor's degree or higher: 21.1%
Graduate or professional degree: 4.6%
Unemployed: 5.6%
Mean travel time to work (commute): 22.7 minutes
For population 15 years and over in 65023:
Never married: 19.4%
Now married: 62.4%
Separated: 0.3%
Widowed: 5.4%
Divorced: 12.5%
Zip code 65023 compared to state average:
Black race population percentage significantly below state average.
Hispanic race population percentage below state average.
Median age significantly above state average.
Foreign-born population percentage significantly below state average.
Renting percentage significantly below state average.
Length of stay since moving in significantly above state average.
Number of college students significantly below state average.
Estimated median house/condo value in 2022: $222,642
65023:
$222,642
Missouri:
$221,200
According to our research of Missouri and other state lists, there were 5 registered sex offenders living in 65023 zip code as of May 23, 2024. The ratio of all residents to sex offenders in zip code 65023 is 327 to 1. The ratio of registered sex offenders to all residents in this zip code is near the state average.
Median resident age:
This zip code:
51.2 years
Missouri median age:
39.1 years
Average household size:
This zip code:
2.2 people
Missouri:
2.4 people
Averages for the 2020 tax year for zip code 65023, filed in 2021:
Average Adjusted Gross Income (AGI) in 2020: $70,955 (Individual Income Tax Returns)
Here:
$70,955
State:
$68,151
Salary/wage: $57,929 (reported on 80.2% of returns)
Here:
$57,929
State:
$56,131
(% of AGI for various income ranges: 1338.8% for AGIs below $25k, 3980.0% for AGIs $25k-50k, 5771.8% for AGIs $50k-75k, 9791.2% for AGIs $75k-100k, 16853.3% for AGIs $100k-200k)
Taxable interest for individuals: $895 (reported on 46.2% of returns)
This zip code:
$895
Missouri:
$1,586
(% of AGI for various income ranges: 20.6% for AGIs below $25k, 29.3% for AGIs $25k-50k, 42.7% for AGIs $50k-75k, 142.5% for AGIs $75k-100k, 153.3% for AGIs $100k-200k)
Ordinary dividends: $2,775 (reported on 22.0% of returns)
Here:
$2,775
State:
$10,947
(% of AGI for various income ranges: 20.0% for AGIs below $25k, 48.7% for AGIs $25k-50k, 120.9% for AGIs $50k-75k, 118.8% for AGIs $75k-100k, 246.7% for AGIs $100k-200k)
Net capital gain/loss in AGI: +$16,506 (reported on 17.6% of returns)
Here:
+$16,506
State:
+$18,453
(% of AGI for various income ranges: 80.0% for AGIs $25k-50k, 55.5% for AGIs $50k-75k, 130.0% for AGIs $75k-100k, 2636.7% for AGIs $100k-200k)
Profit/loss from business: +$11,817 (reported on 13.2% of returns)
Here:
+$11,817
State:
+$12,260
(% of AGI for various income ranges: 146.2% for AGIs below $25k, 125.3% for AGIs $25k-50k, 420.9% for AGIs $50k-75k, 592.2% for AGIs $100k-200k)
Taxable individual retirement arrangement distribution: $13,627 (reported on 12.1% of returns)
65023:
$13,627
Missouri:
$19,719
(% of AGI for various income ranges: 106.2% for AGIs below $25k, 176.7% for AGIs $25k-50k, 743.6% for AGIs $50k-75k, 273.3% for AGIs $100k-200k)
Total itemized deductions: $30,450 (reported on 4.4% of returns)
Here:
$30,450
State:
$36,651
(% of AGI for various income ranges: 280.0% for AGIs below $25k, 855.6% for AGIs $100k-200k)
Charity contributions: $10,400 (reported on 3.3% of returns)
Here:
$10,400
State:
$15,671
(% of AGI for various income ranges: 390.0% for AGIs $75k-100k)
Taxes paid: $6,575 (reported on 4.4% of returns)
65023:
$6,575
State:
$7,608
(% of AGI for various income ranges: 48.8% for AGIs below $25k, 205.6% for AGIs $100k-200k)
Earned income credit: $2,100 (reported on 9.9% of returns)
Here:
$2,100
State:
$2,315
(% of AGI for various income ranges: 58.1% for AGIs below $25k, 64.0% for AGIs $25k-50k)
Percentage of individuals using paid preparers for their 2020 taxes: 91.2%
Here:
91%
State:
93%
(% for various income ranges: 87.5% for AGIs below $25k, 90.5% for AGIs $25k-50k, 87.5% for AGIs $50k-75k, 100.0% for AGIs $75k-100k, 93.3% for AGIs $100k-200k, 100.0% for AGIs over 200k)
Averages for the 2012 tax year for zip code 65023, filed in 2013:
Average Adjusted Gross Income (AGI) in 2012: $52,174 (Individual Income Tax Returns)
Here:
$52,174
State:
$55,896
Salary/wage: $44,745 (reported on 83.5% of returns)
Here:
$44,745
State:
$46,205
(% of AGI for various income ranges: 71.5% for AGIs below $25k, 75.8% for AGIs $25k-50k, 75.1% for AGIs $50k-75k, 73.8% for AGIs $75k-100k, 64.6% for AGIs $100k-200k)
Taxable interest for individuals: $680 (reported on 52.9% of returns)
This zip code:
$680
Missouri:
$1,559
(% of AGI for various income ranges: 1.6% for AGIs below $25k, 0.6% for AGIs $25k-50k, 0.8% for AGIs $50k-75k, 0.6% for AGIs $75k-100k, 0.5% for AGIs $100k-200k)
Ordinary dividends: $2,133 (reported on 21.2% of returns)
Here:
$2,133
State:
$7,410
(% of AGI for various income ranges: 1.6% for AGIs below $25k, 0.6% for AGIs $25k-50k, 0.7% for AGIs $50k-75k, 0.4% for AGIs $75k-100k, 1.3% for AGIs $100k-200k)
Net capital gain/loss in AGI: +$3,636 (reported on 16.5% of returns)
Here:
+$3,636
State:
+$11,579
(% of AGI for various income ranges: 0.4% for AGIs below $25k, 0.9% for AGIs $25k-50k, 0.4% for AGIs $50k-75k, 2.1% for AGIs $75k-100k, 1.5% for AGIs $100k-200k)
Profit/loss from business: +$7,000 (reported on 15.3% of returns)
Here:
+$7,000
State:
+$11,688
(% of AGI for various income ranges: 5.4% for AGIs below $25k, 0.3% for AGIs $25k-50k, 2.9% for AGIs $50k-75k, 4.0% for AGIs $75k-100k)
Taxable individual retirement arrangement distribution: $11,160 (reported on 11.8% of returns)
65023:
$11,160
Missouri:
$14,773
(% of AGI for various income ranges: 2.8% for AGIs below $25k, 3.5% for AGIs $25k-50k, 2.9% for AGIs $50k-75k, 4.6% for AGIs $75k-100k)
Total itemized deductions: $18,604 (21% of AGI, reported on 27.1% of returns)
Here:
$18,604
State:
$22,730
Here:
20.9% of AGI
State:
19.2% of AGI
(% of AGI for various income ranges: 9.4% for AGIs $25k-50k, 9.9% for AGIs $50k-75k, 11.2% for AGIs $75k-100k, 10.9% for AGIs $100k-200k)
Charity contributions: $3,235 (reported on 23.5% of returns)
Here:
$3,235
State:
$4,745
(% of AGI for various income ranges: 0.8% for AGIs $25k-50k, 1.4% for AGIs $50k-75k, 1.6% for AGIs $75k-100k, 2.1% for AGIs $100k-200k)
Taxes paid: $5,648 (reported on 27.1% of returns)
65023:
$5,648
State:
$8,399
(% of AGI for various income ranges: 1.5% for AGIs $25k-50k, 2.6% for AGIs $50k-75k, 3.1% for AGIs $75k-100k, 4.7% for AGIs $100k-200k)
Earned income credit: $1,990 (reported on 11.8% of returns)
Here:
$1,990
State:
$2,288
(% of AGI for various income ranges: 3.8% for AGIs below $25k, 1.0% for AGIs $25k-50k)
Percentage of individuals using paid preparers for their 2012 taxes: 58.8%
Here:
59%
State:
55%
(% for various income ranges: 48.1% for AGIs below $25k, 60.0% for AGIs $25k-50k, 61.1% for AGIs $50k-75k, 72.7% for AGIs $75k-100k, 66.7% for AGIs $100k-200k)
Averages for the 2004 tax year for zip code 65023, filed in 2005:
Average Adjusted Gross Income (AGI) in 2004: $43,403 (Individual Income Tax Returns)
Here:
$43,403
State:
$44,591
Salary/wage: $37,326 (reported on 86.0% of returns)
Here:
$37,326
State:
$38,941
(% of AGI for various income ranges: 93.1% for AGIs below $10k, 80.0% for AGIs $10k-25k, 84.1% for AGIs $25k-50k, 81.4% for AGIs $50k-75k, 81.4% for AGIs $75k-100k, 43.3% for AGIs over 100k)
Taxable interest for individuals: $963 (reported on 53.1% of returns)
This zip code:
$963
Missouri:
$1,801
(% of AGI for various income ranges: 3.0% for AGIs below $10k, 3.0% for AGIs $10k-25k, 1.3% for AGIs $25k-50k, 0.7% for AGIs $50k-75k, 0.8% for AGIs $75k-100k, 1.0% for AGIs over 100k)
Taxable dividends: $1,305 (reported on 23.1% of returns)
Here:
$1,305
State:
$3,677
(% of AGI for various income ranges: 1.6% for AGIs below $10k, 0.7% for AGIs $10k-25k, 0.2% for AGIs $25k-50k, 0.4% for AGIs $50k-75k, 0.3% for AGIs $75k-100k, 1.7% for AGIs over 100k)
Net capital gain/loss: +$2,441 (reported on 16.8% of returns)
Here:
+$2,441
State:
+$8,915
(% of AGI for various income ranges: -1.6% for AGIs below $10k, 1.6% for AGIs $10k-25k, 1.1% for AGIs $25k-50k, 0.4% for AGIs $50k-75k, 1.0% for AGIs $75k-100k, 1.4% for AGIs over 100k)
Profit/loss from business: +$12,795 (reported on 16.9% of returns)
Here:
+$12,795
State:
+$9,793
(% of AGI for various income ranges: -5.5% for AGIs below $10k, 1.5% for AGIs $10k-25k, 3.1% for AGIs $25k-50k, 3.7% for AGIs $50k-75k, 4.4% for AGIs $75k-100k, 11.6% for AGIs over 100k)
IRA payment deduction: $3,513 (reported on 4.5% of returns)
65023:
$3,513
Missouri:
$2,972
Total itemized deductions: $15,780 (21% of AGI, reported on 29.4% of returns)
Here:
$15,780
State:
$18,261
Here:
20.8% of AGI
State:
20.5% of AGI
(% of AGI for various income ranges: 7.6% for AGIs $10k-25k, 8.3% for AGIs $25k-50k, 13.1% for AGIs $50k-75k, 13.6% for AGIs $75k-100k, 9.7% for AGIs over 100k)
Charity contributions deductions: $3,393 (4% of AGI, reported on 24.8% of returns)
Here:
$3,393
State:
$3,665
Here:
4.2% of AGI
State:
3.9% of AGI
(% of AGI for various income ranges: 0.6% for AGIs $10k-25k, 0.8% for AGIs $25k-50k, 2.2% for AGIs $50k-75k, 2.6% for AGIs $75k-100k, 2.8% for AGIs over 100k)
Total tax: $5,193 (reported on 80.6% of returns)
65023:
$5,193
State:
$6,999
(% of AGI for various income ranges: 2.8% for AGIs below $10k, 4.0% for AGIs $10k-25k, 6.7% for AGIs $25k-50k, 7.8% for AGIs $50k-75k, 10.0% for AGIs $75k-100k, 17.8% for AGIs over 100k)
Earned income credit: $1,690 (reported on 9.7% of returns)
Here:
$1,690
State:
$1,728
Percentage of individuals using paid preparers for their 2004 taxes: 60.3%
Here:
60%
State:
62%
(% for various income ranges: 43.2% for AGIs below $10k, 58.7% for AGIs $10k-25k, 64.0% for AGIs $25k-50k, 66.5% for AGIs $50k-75k, 64.6% for AGIs $75k-100k, 73.9% for AGIs over 100k)
Household received Food Stamps/SNAP in the past 12 months: 17 Household did not receive Food Stamps/SNAP in the past 12 months: 682
Women who had a birth in the past 12 months: 4 (4 now married, 0 unmarried) Women who did not have a birth in the past 12 months: 220 (156 now married, 63 unmarried)
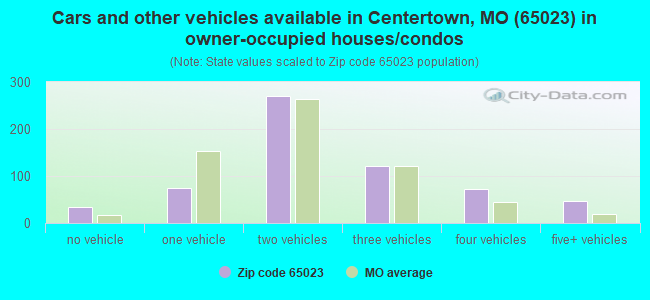
Housing units in zip code 65023 with a mortgage: 258 (16 second mortgage, 16 both second mortgage and home equity loan) Houses without a mortgage: 31
Median monthly owner costs for units with a mortgage: $1,211 Median monthly owner costs for units without a mortgage: $491
Residents with income below the poverty level in 2022:
This zip code:
9.2%
Whole state:
13.2%
Residents with income below 50% of the poverty level in 2022:
This zip code:
6.8%
Whole state:
6.8%
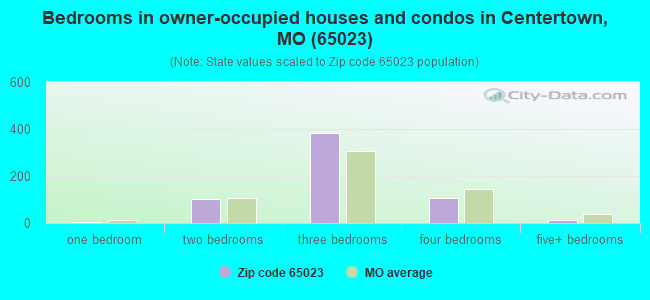
Median number of rooms in houses and condos:
Here:
6.5
State:
6.4
Median number of rooms in apartments:
Here:
5.2
State:
4.4
Notable locations in this zip code not listed on our city pages
Notable locations in zip code 65023: Kaley Ford (A), Regional West Fire Protection District Station 4 (B), Regional West Fire Protection District Station 1 (C). Display/hide their locations on the map
Size of family households: 252 2-persons, 100 3-persons, 75 4-persons, 8 5-persons, 10 6-persons
Size of nonfamily households: 208 1-person, 42 2-persons
216 married couples with children.
52 single-parent households (18 men, 34 women).
99.7% of residents of 65023 zip code speak English at home.
0.7% of residents speak Spanish at home (80% very well, 20% well).
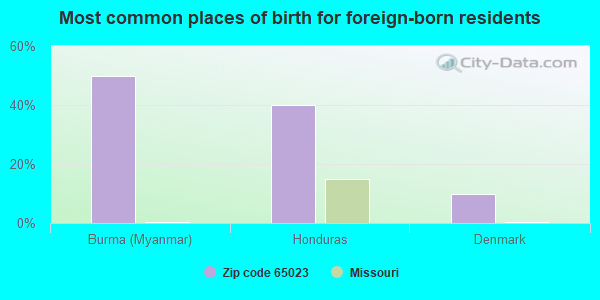
Foreign born population: 10 (0.7%) (45.7% of them are naturalized citizens)
This zip code:
0.7%
Whole state:
4.1%
50%Burma (Myanmar)
40%Honduras
10%Denmark
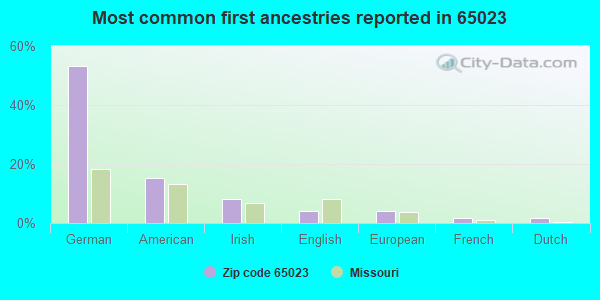
53%German
15%American
8%Irish
4%English
4%European
2%French
2%Dutch
Year of entry for the foreign-born population
12010 or later
02000 to 2009
61990 to 1999
1Before 1990
Facilities with environmental interests located in this zip code:
FORMER MARION GENERAL STORE (HWY 179 in MARION, MO)
STATE MASTER (Missouri monitoring and compilance) - RCRAINFO-MOP000005694, NOT IN A UNIVERSE (Resource Conservation and Recovery Act (tracking hazardous waste)) Organizations: BILL HORN (CONTACT/OWNER)
Housing units lacking complete plumbing facilities: 0.2%
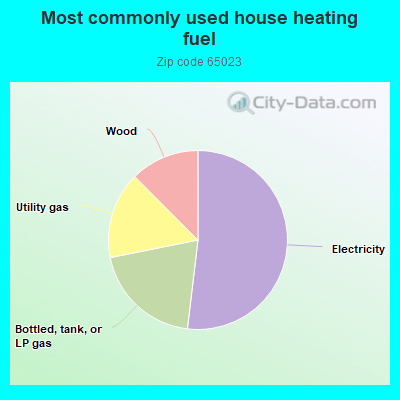
52.0%Electricity
20.0%Bottled, tank, or LP gas
15.7%Utility gas
12.5%Wood
Population in 1990: 1,184. Population change in the 1990s: +336 (+28.4%).
Place of birth for U.S.-born residents:
This state: 1,299
Northeast: 11
Midwest: 111
South: 49
West: 43
66% of the 65023 zip code residents lived in the same house 5 years ago. Out of people who lived in different houses, 66% lived in this county. Out of people who lived in different counties, 50% lived in Missouri.
95% of the 65023 zip code residents lived in the same house 1 year ago. Out of people who lived in different houses, 64% moved from this county. Out of people who lived in different houses, 24% moved from different county within same state. Out of people who lived in different houses, 15% moved from different state.
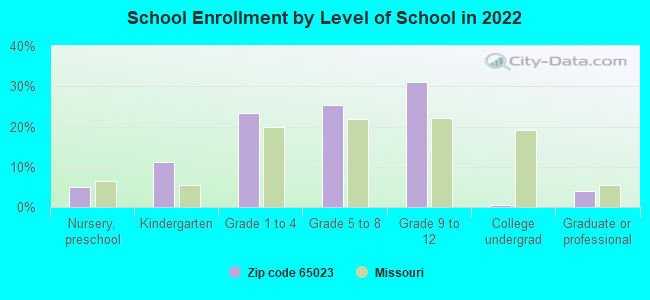
Private vs. public school enrollment:
Students in private schools in grades 1 to 8 (elementary and middle school): 21
Here:
20.9%
Missouri:
15.4%
Students in private schools in grades 9 to 12 (high school): 56
Here:
81.3%
Missouri:
13.9%
Students in private undergraduate colleges:
Here:
0.0%
Missouri:
22.6%
Occupation by median earnings in the past 12 months ($)
75,215Computer and mathematical occupations
67,238Management occupations
65,710Health diagnosing and treating practitioners and other technical occupations
62,658Transportation occupations
54,125Construction and extraction occupations
50,336Architecture and engineering occupations
Top industries in this zip code by the number of employees in 2005:
Accommodation and Food Services: Full-Service Restaurants (10-19 employees: 1 establishment)
Construction: Plumbing, Heating, and Air-Conditioning Contractors (10-19: 1)
Other Services (except Public Administration): Religious Organizations (5-9: 1)
Construction: Framing Contractors (5-9: 1)
Construction: New Single-Family Housing Construction (except Operative Builders) (1-4: 2)
Professional, Scientific, and Technical Services: Other Services Related to Advertising (1-4: 1)
Information: Radio Stations (1-4: 1)
Administrative and Support and Waste Management and Remediation Services: Landscaping Services (1-4: 1)
Fatal accident statistics in 2010:
Fatal accident count: 1
Vehicles involved in fatal accidents: 2
Fatal accidents caused by drunken drivers: 0
Fatalities: 1
Persons involved in fatal accidents: 2
Pedestrians involved in fatal accidents: 0
Home Mortgage Disclosure Act Aggregated Statistics For Year 2009 (Based on 2 partial tracts)
A) FHA, FSA/RHS & VA Home Purchase Loans
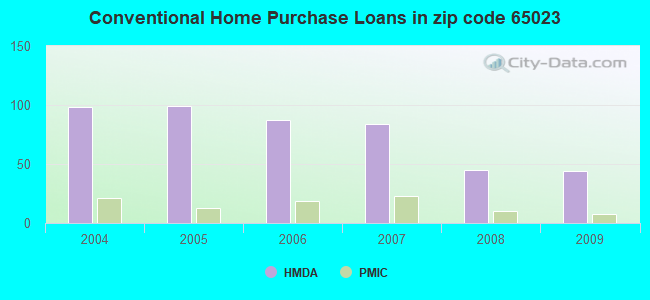
B) Conventional Home Purchase Loans
C) Refinancings
D) Home Improvement Loans
F) Non-occupant Loans on < 5 Family Dwellings (A B C & D)
G) Loans On Manufactured Home Dwelling (A B C & D)
Number
Average Value
Number
Average Value
Number
Average Value
Number
Average Value
Number
Average Value
Number
Average Value
LOANS ORIGINATED
17
$125,258
44
$156,497
236
$153,388
24
$84,994
7
$49,109
4
$8,057
APPLICATIONS APPROVED, NOT ACCEPTED
1
$206,490
4
$211,565
39
$151,985
0
$0
1
$119,360
0
$0
APPLICATIONS DENIED
1
$220,820
4
$85,045
24
$110,706
2
$2,985
1
$393,890
0
$0
APPLICATIONS WITHDRAWN
0
$0
1
$304,370
16
$150,841
1
$78,780
0
$0
1
$78,780
FILES CLOSED FOR INCOMPLETENESS
0
$0
0
$0
2
$198,140
0
$0
0
$0
0
$0
Aggregated Statistics For Year 2008 (Based on 2 partial tracts)
A) FHA, FSA/RHS & VA Home Purchase Loans
B) Conventional Home Purchase Loans
C) Refinancings
D) Home Improvement Loans
E) Loans on Dwellings For 5+ Families
F) Non-occupant Loans on < 5 Family Dwellings (A B C & D)
G) Loans On Manufactured Home Dwelling (A B C & D)
Number
Average Value
Number
Average Value
Number
Average Value
Number
Average Value
Number
Average Value
Number
Average Value
Number
Average Value
LOANS ORIGINATED
6
$127,517
45
$128,538
101
$156,811
12
$50,330
1
$364,050
14
$112,369
6
$44,760
APPLICATIONS APPROVED, NOT ACCEPTED
1
$97,880
2
$112,795
27
$142,436
1
$2,390
0
$0
1
$173,070
0
$0
APPLICATIONS DENIED
4
$121,748
6
$61,868
47
$139,854
2
$10,145
0
$0
1
$46,550
6
$76,390
APPLICATIONS WITHDRAWN
1
$94,290
5
$114,824
26
$171,465
0
$0
0
$0
0
$0
1
$23,870
FILES CLOSED FOR INCOMPLETENESS
1
$236,330
1
$235,140
0
$0
0
$0
0
$0
0
$0
0
$0
Aggregated Statistics For Year 2007 (Based on 2 partial tracts)
A) FHA, FSA/RHS & VA Home Purchase Loans
B) Conventional Home Purchase Loans
C) Refinancings
D) Home Improvement Loans
F) Non-occupant Loans on < 5 Family Dwellings (A B C & D)
G) Loans On Manufactured Home Dwelling (A B C & D)
Number
Average Value
Number
Average Value
Number
Average Value
Number
Average Value
Number
Average Value
Number
Average Value
LOANS ORIGINATED
1
$140,840
84
$137,776
92
$129,856
23
$46,862
19
$91,216
8
$33,122
APPLICATIONS APPROVED, NOT ACCEPTED
0
$0
8
$117,868
24
$131,893
1
$102,650
4
$63,858
5
$45,118
APPLICATIONS DENIED
0
$0
7
$45,527
45
$136,574
12
$40,284
4
$73,108
7
$35,809
APPLICATIONS WITHDRAWN
0
$0
10
$116,376
21
$134,763
1
$429,700
1
$10,740
0
$0
FILES CLOSED FOR INCOMPLETENESS
0
$0
1
$119,360
7
$181,939
0
$0
0
$0
0
$0
Aggregated Statistics For Year 2006 (Based on 2 partial tracts)
B) Conventional Home Purchase Loans
C) Refinancings
D) Home Improvement Loans
E) Loans on Dwellings For 5+ Families
F) Non-occupant Loans on < 5 Family Dwellings (A B C & D)
G) Loans On Manufactured Home Dwelling (A B C & D)
Number
Average Value
Number
Average Value
Number
Average Value
Number
Average Value
Number
Average Value
Number
Average Value
LOANS ORIGINATED
87
$151,807
93
$109,901
23
$34,563
1
$632,610
11
$77,693
10
$42,492
APPLICATIONS APPROVED, NOT ACCEPTED
6
$236,730
10
$129,148
0
$0
0
$0
2
$161,135
0
$0
APPLICATIONS DENIED
4
$165,612
49
$105,329
10
$71,139
1
$5,970
1
$227,980
2
$49,535
APPLICATIONS WITHDRAWN
12
$96,383
26
$113,392
5
$29,840
0
$0
4
$110,708
4
$52,818
FILES CLOSED FOR INCOMPLETENESS
0
$0
13
$122,390
2
$20,890
0
$0
1
$71,620
0
$0
Aggregated Statistics For Year 2005 (Based on 2 partial tracts)
A) FHA, FSA/RHS & VA Home Purchase Loans
B) Conventional Home Purchase Loans
C) Refinancings
D) Home Improvement Loans
F) Non-occupant Loans on < 5 Family Dwellings (A B C & D)
G) Loans On Manufactured Home Dwelling (A B C & D)
Number
Average Value
Number
Average Value
Number
Average Value
Number
Average Value
Number
Average Value
Number
Average Value
LOANS ORIGINATED
5
$170,446
99
$119,191
91
$103,476
25
$77,011
14
$61,556
14
$25,236
APPLICATIONS APPROVED, NOT ACCEPTED
0
$0
2
$226,185
6
$116,177
0
$0
0
$0
1
$118,170
APPLICATIONS DENIED
2
$88,925
19
$96,933
62
$129,313
10
$32,108
0
$0
12
$47,545
APPLICATIONS WITHDRAWN
0
$0
13
$99,436
29
$103,596
2
$234,540
0
$0
2
$85,340
FILES CLOSED FOR INCOMPLETENESS
0
$0
4
$80,568
6
$180,433
0
$0
0
$0
1
$65,650
Aggregated Statistics For Year 2004 (Based on 2 partial tracts)
A) FHA, FSA/RHS & VA Home Purchase Loans
B) Conventional Home Purchase Loans
C) Refinancings
D) Home Improvement Loans
E) Loans on Dwellings For 5+ Families
F) Non-occupant Loans on < 5 Family Dwellings (A B C & D)
G) Loans On Manufactured Home Dwelling (A B C & D)

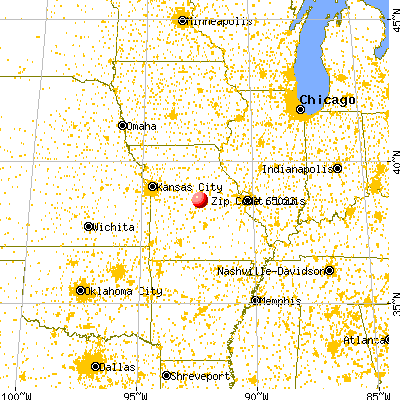


 Nearest zip codes: 65039, 65053, 65109, 65046, 65018, 65074.