Estimated zip code population in 2022: 1,483 Zip code population in 2010: 1,425 Zip code population in 2000: 1,169
Houses and condos: 612 Renter-occupied apartments: 68
% of renters here:
12%
State:
32%
March 2022 cost of living index in zip code 65053: 76.6 (low, U.S. average is 100)
Land area: 35.1 sq. mi. Water area: 0.0 sq. mi.
Population density: 42 people per square mile
(very low).
OSM Map
General Map
Google Map
MSN Map
OSM Map
General Map
Google Map
MSN Map
OSM Map
General Map
Google Map
MSN Map
OSM Map
General Map
Google Map
MSN Map
Please wait while loading the map...
Real estate property taxes paid for housing units in 2022:
This zip code:
0.6% ($2,062)
Missouri:
0.8% ($1,810)
Median real estate property taxes paid for housing units with mortgages in 2022: $1,952 (0.7%) Median real estate property taxes paid for housing units with no mortgage in 2022: $2,172 (0.5%)
Business Search- 14 Million verified businesses
Males: 764
(51.6%)
Females: 718
(48.4%)
For population 25 years and over in 65053:
High school or higher: 99.7%
Bachelor's degree or higher: 32.3%
Graduate or professional degree: 16.5%
Unemployed: 0.7%
Mean travel time to work (commute): 22.5 minutes
For population 15 years and over in 65053:
Never married: 17.8%
Now married: 69.6%
Separated: 0.0%
Widowed: 3.5%
Divorced: 9.1%
Zip code 65053 compared to state average:
Median household income above state average.
Unemployed percentage significantly below state average.
Black race population percentage significantly below state average.
Median age significantly above state average.
Renting percentage significantly below state average.
Length of stay since moving in significantly above state average.
Estimated median house/condo value in 2022: $324,922
65053:
$324,922
Missouri:
$221,200
According to our research of Missouri and other state lists, there were 2 registered sex offenders living in 65053 zip code as of June 07, 2024. The ratio of all residents to sex offenders in zip code 65053 is 756 to 1. The ratio of registered sex offenders to all residents in this zip code is lower than the state average.
Median resident age:
This zip code:
53.5 years
Missouri median age:
39.1 years
Average household size:
This zip code:
2.5 people
Missouri:
2.4 people
Averages for the 2020 tax year for zip code 65053, filed in 2021:
Average Adjusted Gross Income (AGI) in 2020: $109,787 (Individual Income Tax Returns)
Here:
$109,787
State:
$68,151
Salary/wage: $75,109 (reported on 78.6% of returns)
Here:
$75,109
State:
$56,131
(% of AGI for various income ranges: 1422.0% for AGIs below $25k, 3455.6% for AGIs $25k-50k, 7063.3% for AGIs $50k-75k, 9738.0% for AGIs $75k-100k, 14134.4% for AGIs $100k-200k)
Taxable interest for individuals: $2,124 (reported on 52.9% of returns)
This zip code:
$2,124
Missouri:
$1,586
(% of AGI for various income ranges: 21.0% for AGIs below $25k, 75.6% for AGIs $25k-50k, 75.0% for AGIs $50k-75k, 66.0% for AGIs $75k-100k, 195.6% for AGIs $100k-200k)
Ordinary dividends: $6,692 (reported on 35.7% of returns)
Here:
$6,692
State:
$10,947
(% of AGI for various income ranges: 44.0% for AGIs below $25k, 113.3% for AGIs $25k-50k, 255.0% for AGIs $50k-75k, 320.0% for AGIs $75k-100k, 187.8% for AGIs $100k-200k)
Net capital gain/loss in AGI: +$12,309 (reported on 31.4% of returns)
Here:
+$12,309
State:
+$18,453
(% of AGI for various income ranges: 24.0% for AGIs below $25k, 31.1% for AGIs $25k-50k, 268.3% for AGIs $50k-75k, 520.0% for AGIs $75k-100k, 378.9% for AGIs $100k-200k)
Profit/loss from business: +$13,991 (reported on 15.7% of returns)
Here:
+$13,991
State:
+$12,260
(% of AGI for various income ranges: 122.0% for AGIs below $25k, 610.0% for AGIs $50k-75k, 202.0% for AGIs $75k-100k, 1055.6% for AGIs $100k-200k)
Taxable individual retirement arrangement distribution: $14,960 (reported on 14.3% of returns)
65053:
$14,960
Missouri:
$19,719
(% of AGI for various income ranges: 448.9% for AGIs $25k-50k, 520.0% for AGIs $75k-100k, 924.4% for AGIs $100k-200k)
Total itemized deductions: $37,750 (reported on 8.6% of returns)
Here:
$37,750
State:
$36,651
(% of AGI for various income ranges: 1398.3% for AGIs $50k-75k)
Charity contributions: $25,100 (reported on 5.7% of returns)
Here:
$25,100
State:
$15,671
(% of AGI for various income ranges: )
Taxes paid: $7,150 (reported on 8.6% of returns)
65053:
$7,150
State:
$7,608
(% of AGI for various income ranges: 290.0% for AGIs $50k-75k)
Earned income credit: $2,120 (reported on 7.1% of returns)
Here:
$2,120
State:
$2,315
(% of AGI for various income ranges: 106.0% for AGIs below $25k)
Percentage of individuals using paid preparers for their 2020 taxes: 92.9%
Here:
93%
State:
93%
(% for various income ranges: 93.8% for AGIs below $25k, 92.3% for AGIs $25k-50k, 90.9% for AGIs $50k-75k, 90.0% for AGIs $75k-100k, 92.9% for AGIs $100k-200k, 100.0% for AGIs over 200k)
Averages for the 2012 tax year for zip code 65053, filed in 2013:
Average Adjusted Gross Income (AGI) in 2012: $90,509 (Individual Income Tax Returns)
Here:
$90,509
State:
$55,896
Salary/wage: $60,956 (reported on 82.1% of returns)
Here:
$60,956
State:
$46,205
(% of AGI for various income ranges: 66.7% for AGIs below $25k, 69.4% for AGIs $25k-50k, 70.6% for AGIs $50k-75k, 68.9% for AGIs $75k-100k, 68.9% for AGIs $100k-200k, 39.4% for AGIs over 200k)
Taxable interest for individuals: $1,877 (reported on 64.2% of returns)
This zip code:
$1,877
Missouri:
$1,559
(% of AGI for various income ranges: 3.4% for AGIs below $25k, 1.7% for AGIs $25k-50k, 0.8% for AGIs $50k-75k, 0.8% for AGIs $75k-100k, 1.3% for AGIs $100k-200k, 1.3% for AGIs over 200k)
Ordinary dividends: $4,862 (reported on 35.8% of returns)
Here:
$4,862
State:
$7,410
(% of AGI for various income ranges: 3.7% for AGIs below $25k, 1.9% for AGIs $25k-50k, 1.3% for AGIs $50k-75k, 0.5% for AGIs $75k-100k, 0.8% for AGIs $100k-200k, 2.7% for AGIs over 200k)
Net capital gain/loss in AGI: +$3,758 (reported on 28.4% of returns)
Here:
+$3,758
State:
+$11,579
(% of AGI for various income ranges: 0.8% for AGIs below $25k, 1.4% for AGIs $25k-50k, 0.8% for AGIs $50k-75k, 2.5% for AGIs $75k-100k, 2.3% for AGIs $100k-200k, 0.5% for AGIs over 200k)
Profit/loss from business: +$9,470 (reported on 14.9% of returns)
Here:
+$9,470
State:
+$11,688
(% of AGI for various income ranges: 4.5% for AGIs $25k-50k, 5.4% for AGIs $50k-75k, 3.4% for AGIs $100k-200k)
Taxable individual retirement arrangement distribution: $8,656 (reported on 13.4% of returns)
65053:
$8,656
Missouri:
$14,773
(% of AGI for various income ranges: 5.3% for AGIs below $25k, 4.7% for AGIs $25k-50k, 5.5% for AGIs $75k-100k)
Total itemized deductions: $28,159 (17% of AGI, reported on 40.3% of returns)
Here:
$28,159
State:
$22,730
Here:
16.5% of AGI
State:
19.2% of AGI
(% of AGI for various income ranges: 13.3% for AGIs below $25k, 12.0% for AGIs $25k-50k, 11.0% for AGIs $50k-75k, 10.8% for AGIs $75k-100k, 14.4% for AGIs $100k-200k, 12.6% for AGIs over 200k)
Charity contributions: $9,296 (reported on 34.3% of returns)
Here:
$9,296
State:
$4,745
(% of AGI for various income ranges: 2.0% for AGIs $25k-50k, 2.1% for AGIs $50k-75k, 1.9% for AGIs $75k-100k, 3.1% for AGIs $100k-200k, 5.0% for AGIs over 200k)
Taxes paid: $10,126 (reported on 40.3% of returns)
65053:
$10,126
State:
$8,399
(% of AGI for various income ranges: 1.7% for AGIs below $25k, 2.6% for AGIs $25k-50k, 2.8% for AGIs $50k-75k, 3.2% for AGIs $75k-100k, 5.5% for AGIs $100k-200k, 5.4% for AGIs over 200k)
Earned income credit: $2,233 (reported on 9.0% of returns)
Here:
$2,233
State:
$2,288
(% of AGI for various income ranges: 4.1% for AGIs below $25k, 0.7% for AGIs $25k-50k)
Percentage of individuals using paid preparers for their 2012 taxes: 64.2%
Here:
64%
State:
55%
(% for various income ranges: 57.1% for AGIs below $25k, 66.7% for AGIs $25k-50k, 60.0% for AGIs $50k-75k, 62.5% for AGIs $75k-100k, 66.7% for AGIs $100k-200k, 100.0% for AGIs over 200k)
Averages for the 2004 tax year for zip code 65053, filed in 2005:
Average Adjusted Gross Income (AGI) in 2004: $62,647 (Individual Income Tax Returns)
Here:
$62,647
State:
$44,591
Salary/wage: $49,065 (reported on 85.0% of returns)
Here:
$49,065
State:
$38,941
(% of AGI for various income ranges: 100.5% for AGIs below $10k, 72.8% for AGIs $10k-25k, 76.2% for AGIs $25k-50k, 82.6% for AGIs $50k-75k, 72.7% for AGIs $75k-100k, 53.7% for AGIs over 100k)
Taxable interest for individuals: $1,917 (reported on 68.5% of returns)
This zip code:
$1,917
Missouri:
$1,801
(% of AGI for various income ranges: 12.2% for AGIs below $10k, 3.8% for AGIs $10k-25k, 2.5% for AGIs $25k-50k, 1.6% for AGIs $50k-75k, 1.8% for AGIs $75k-100k, 1.9% for AGIs over 100k)
Taxable dividends: $2,057 (reported on 37.3% of returns)
Here:
$2,057
State:
$3,677
(% of AGI for various income ranges: 5.3% for AGIs below $10k, 1.6% for AGIs $10k-25k, 1.5% for AGIs $25k-50k, 0.6% for AGIs $50k-75k, 0.5% for AGIs $75k-100k, 1.6% for AGIs over 100k)
Net capital gain/loss: +$5,178 (reported on 29.2% of returns)
Here:
+$5,178
State:
+$8,915
(% of AGI for various income ranges: -3.7% for AGIs below $10k, 3.0% for AGIs $10k-25k, 1.2% for AGIs $25k-50k, 0.7% for AGIs $50k-75k, 1.9% for AGIs $75k-100k, 3.7% for AGIs over 100k)
Profit/loss from business: +$12,559 (reported on 15.6% of returns)
Here:
+$12,559
State:
+$9,793
(% of AGI for various income ranges: 4.1% for AGIs $10k-25k, 1.4% for AGIs $25k-50k, 1.3% for AGIs $50k-75k, 5.5% for AGIs over 100k)
IRA payment deduction: $2,720 (reported on 3.8% of returns)
65053:
$2,720
Missouri:
$2,972
Total itemized deductions: $20,464 (17% of AGI, reported on 36.2% of returns)
Here:
$20,464
State:
$18,261
Here:
16.9% of AGI
State:
20.5% of AGI
(% of AGI for various income ranges: 8.0% for AGIs $10k-25k, 9.9% for AGIs $25k-50k, 10.7% for AGIs $50k-75k, 16.9% for AGIs $75k-100k, 11.5% for AGIs over 100k)
Charity contributions deductions: $5,843 (5% of AGI, reported on 33.0% of returns)
Here:
$5,843
State:
$3,665
Here:
4.6% of AGI
State:
3.9% of AGI
(% of AGI for various income ranges: 1.1% for AGIs $10k-25k, 1.0% for AGIs $25k-50k, 1.4% for AGIs $50k-75k, 3.3% for AGIs $75k-100k, 4.5% for AGIs over 100k)
Total tax: $11,494 (reported on 81.0% of returns)
65053:
$11,494
State:
$6,999
(% of AGI for various income ranges: 4.4% for AGIs below $10k, 4.8% for AGIs $10k-25k, 7.2% for AGIs $25k-50k, 8.1% for AGIs $50k-75k, 9.6% for AGIs $75k-100k, 23.1% for AGIs over 100k)
Earned income credit: $1,822 (reported on 6.9% of returns)
Here:
$1,822
State:
$1,728
Percentage of individuals using paid preparers for their 2004 taxes: 61.8%
Here:
62%
State:
62%
(% for various income ranges: 46.7% for AGIs below $10k, 57.1% for AGIs $10k-25k, 66.7% for AGIs $25k-50k, 66.1% for AGIs $50k-75k, 62.4% for AGIs $75k-100k, 78.8% for AGIs over 100k)
Household received Food Stamps/SNAP in the past 12 months: 2 Household did not receive Food Stamps/SNAP in the past 12 months: 585
Women who had a birth in the past 12 months: 2 (2 now married, 0 unmarried) Women who did not have a birth in the past 12 months: 199 (108 now married, 90 unmarried)
Housing units in zip code 65053 with a mortgage: 249 (33 second mortgage, 19 both second mortgage and home equity loan) Houses without a mortgage: 38
Median monthly owner costs for units with a mortgage: $1,588 Median monthly owner costs for units without a mortgage: $525
Residents with income below the poverty level in 2022:
This zip code:
0.6%
Whole state:
13.2%
Median number of rooms in houses and condos:
Here:
8.2
State:
6.4
Median number of rooms in apartments:
Here:
6.7
State:
4.4
Notable locations in this zip code not listed on our city pages
Notable locations in zip code 65053: Moreau (A), Russellville - Lohman Fire Protection District Station 2 Lohman (B). Display/hide their locations on the map
Cemeteries: Saint Pauls Cemetery (1), Old Catholic Cemetery (2), Russellville Cemetery (3), Stone Cemetery (4), Wilkerson Cemetery (5), Gordon Cemetery (6). Display/hide their locations on the map
Size of family households: 297 2-persons, 60 3-persons, 114 4-persons, 16 5-persons, 2 6-persons
Size of nonfamily households: 78 1-person, 11 2-persons
134 married couples with children.
89 single-parent households (69 men, 20 women).
100.5% of residents of 65053 zip code speak English at home.
Foreign born population: 59 (4.0%) (100.0% of them are naturalized citizens)
This zip code:
4.0%
Whole state:
4.1%
67%Serbia
59%El Salvador
60%German
9%English
6%Italian
6%American
6%Ukrainian
5%Eastern European
4%Irish
Year of entry for the foreign-born population
02010 or later
582000 to 2009
01990 to 1999
18Before 1990
Facilities with environmental interests located in this zip code:
SADDLEBROOKE SANI SEW CO (SADDLEBROOK LAKE ROAD in LOHMAN, MO)
STATE MASTER (Missouri monitoring and compilance) - PCS-MO0127353, NPDES NON-MAJOR National Pollutant Discharge Elimination System NON-MAJOR (Tracking pollutant discharge elimination systems) - permit Business SIC classification: SEWERAGE SYSTEMS Alternative names: SADDLEBROOKE LAKE WWTP
GARY A CONNELL (7425 STATE ROUTE C in LOHMAN, MO)
STATE MASTER (Missouri monitoring and compilance) - PCS-MOR60A012, NPDES NON-MAJOR National Pollutant Discharge Elimination System NON-MAJOR (Tracking pollutant discharge elimination systems) - permit Business SIC classification: MOTOR VEHICLE PARTS, USED Alternative names: CONNELL AUTO SALES/SALV
FISCHER BODY SHOP (2812 WASHINGTON in LOHMAN, MO)
STATE MASTER (Missouri monitoring and compilance) - RCRAINFO-MOD985798032, CESQG Conditionally Exempt Small Quantity Generators, less than 100 kg/month of hazardous waste (Resource Conservation and Recovery Act (tracking hazardous waste)) Organizations: CURTIS FISCHER (CONTACT/OWNER)
BOSLEY SALVAGE (RR 1 in LOHMAN, MO)
STATE MASTER (Missouri monitoring and compilance) - NCDB-I07#19890117MO03T 1, COMPLIANCE ACTIVITY COMPLIANCE ACTIVITY (Tracking inspections of insecticide, fungicide, and rodenticide, and toxic substances)
AUTUMN WOODS ESTATES WWTF (FALLING LEAF LANE in LOHMAN, MO)
National Pollutant Discharge Elimination System NON-MAJOR (Tracking pollutant discharge elimination systems) - permit Business SIC classification: SEWERAGE SYSTEMS Organizations: AQUA MISSOURI, INC. (CONTACT/OWNER)
, AQUA MISSOURI INC (CONTACT/OWNER)
Alternative names: AQUA MISSOURI INC
Housing units lacking complete plumbing facilities: 0.7% Housing units lacking complete kitchen facilities: 1.4%
43.1%Bottled, tank, or LP gas
42.4%Electricity
12.6%Utility gas
2.1%Wood
Population in 1990: 356. Population change in the 1990s: +813 (+228.4%).
Place of birth for U.S.-born residents:
This state: 1,059
Northeast: 14
Midwest: 128
South: 102
West: 99
70% of the 65053 zip code residents lived in the same house 5 years ago. Out of people who lived in different houses, 81% lived in this county. Out of people who lived in different counties, 50% lived in Missouri.
100% of the 65053 zip code residents lived in the same house 1 year ago.
Private vs. public school enrollment:
Students in private schools in grades 1 to 8 (elementary and middle school): 19
Here:
12.8%
Missouri:
15.4%
Students in private schools in grades 9 to 12 (high school): 34
Here:
31.1%
Missouri:
13.9%
Students in private undergraduate colleges:
Here:
0.0%
Missouri:
22.6%
Occupation by median earnings in the past 12 months ($)
119,092Health diagnosing and treating practitioners and other technical occupations
106,259Computer and mathematical occupations
76,140Management occupations
59,250Construction and extraction occupations
55,991Office and administrative support occupations
53,904Installation, maintenance, and repair occupations
Top industries in this zip code by the number of employees in 2005:
Finance and Insurance: Commercial Banking (20-49 employees: 1 establishment)
Construction: Painting and Wall Covering Contractors (10-19: 1, 1-4: 1)
Accommodation and Food Services: Full-Service Restaurants (10-19: 1)
Other Services (except Public Administration): Automotive Body, Paint, and Interior Repair and Maintenance (10-19: 1)
Administrative and Support and Waste Management and Remediation Services: Landscaping Services (5-9: 1, 1-4: 1)
Construction: Plumbing, Heating, and Air-Conditioning Contractors (5-9: 1)
Administrative and Support and Waste Management and Remediation Services: Exterminating and Pest Control Services (5-9: 1)
Construction: Water and Sewer Line and Related Structures Construction (5-9: 1)
Construction: Site Preparation Contractors (1-4: 3)
Fatal accident statistics in 2012:
Fatal accident count: 1
Vehicles involved in fatal accidents: 2
Fatal accidents caused by drunken drivers: 0
Fatalities: 1
Persons involved in fatal accidents: 2
Pedestrians involved in fatal accidents: 0
Home Mortgage Disclosure Act Aggregated Statistics For Year 2009 (Based on 4 partial tracts)
A) FHA, FSA/RHS & VA Home Purchase Loans
B) Conventional Home Purchase Loans
C) Refinancings
D) Home Improvement Loans
E) Loans on Dwellings For 5+ Families
F) Non-occupant Loans on < 5 Family Dwellings (A B C & D)
G) Loans On Manufactured Home Dwelling (A B C & D)
Number
Average Value
Number
Average Value
Number
Average Value
Number
Average Value
Number
Average Value
Number
Average Value
Number
Average Value
LOANS ORIGINATED
30
$102,365
48
$118,275
189
$138,545
22
$71,098
1
$1,179,240
11
$65,119
5
$61,802
APPLICATIONS APPROVED, NOT ACCEPTED
2
$84,855
3
$103,277
26
$137,742
1
$123,030
0
$0
2
$55,285
1
$70,210
APPLICATIONS DENIED
3
$114,273
11
$65,413
26
$127,053
5
$55,620
0
$0
1
$232,500
4
$40,080
APPLICATIONS WITHDRAWN
5
$83,246
1
$398,150
26
$127,858
0
$0
0
$0
0
$0
0
$0
FILES CLOSED FOR INCOMPLETENESS
0
$0
0
$0
4
$94,812
0
$0
0
$0
0
$0
0
$0
Aggregated Statistics For Year 2008 (Based on 4 partial tracts)
A) FHA, FSA/RHS & VA Home Purchase Loans
B) Conventional Home Purchase Loans
C) Refinancings
D) Home Improvement Loans
F) Non-occupant Loans on < 5 Family Dwellings (A B C & D)
G) Loans On Manufactured Home Dwelling (A B C & D)
Number
Average Value
Number
Average Value
Number
Average Value
Number
Average Value
Number
Average Value
Number
Average Value
LOANS ORIGINATED
19
$113,874
46
$131,310
87
$121,013
15
$54,115
15
$102,864
9
$76,509
APPLICATIONS APPROVED, NOT ACCEPTED
1
$117,670
6
$115,035
13
$113,758
1
$54,780
2
$73,290
2
$80,120
APPLICATIONS DENIED
3
$97,230
9
$87,739
37
$141,347
5
$29,976
3
$114,973
4
$53,320
APPLICATIONS WITHDRAWN
1
$153,090
9
$281,831
13
$150,974
0
$0
1
$48,730
0
$0
FILES CLOSED FOR INCOMPLETENESS
1
$42,600
0
$0
5
$119,902
0
$0
1
$33,480
0
$0
Aggregated Statistics For Year 2007 (Based on 4 partial tracts)
A) FHA, FSA/RHS & VA Home Purchase Loans
B) Conventional Home Purchase Loans
C) Refinancings
D) Home Improvement Loans
F) Non-occupant Loans on < 5 Family Dwellings (A B C & D)
G) Loans On Manufactured Home Dwelling (A B C & D)
Number
Average Value
Number
Average Value
Number
Average Value
Number
Average Value
Number
Average Value
Number
Average Value
LOANS ORIGINATED
3
$99,310
111
$110,374
101
$118,148
21
$47,090
27
$87,709
4
$54,365
APPLICATIONS APPROVED, NOT ACCEPTED
0
$0
8
$116,245
17
$124,088
3
$47,580
2
$82,925
0
$0
APPLICATIONS DENIED
1
$151,560
23
$83,783
57
$116,569
15
$48,611
3
$145,033
5
$46,760
APPLICATIONS WITHDRAWN
0
$0
7
$103,259
32
$111,955
1
$91,300
1
$110,570
1
$6,590
FILES CLOSED FOR INCOMPLETENESS
2
$102,310
2
$107,415
8
$165,446
0
$0
0
$0
0
$0
Aggregated Statistics For Year 2006 (Based on 4 partial tracts)
A) FHA, FSA/RHS & VA Home Purchase Loans
B) Conventional Home Purchase Loans
C) Refinancings
D) Home Improvement Loans
F) Non-occupant Loans on < 5 Family Dwellings (A B C & D)
G) Loans On Manufactured Home Dwelling (A B C & D)
Number
Average Value
Number
Average Value
Number
Average Value
Number
Average Value
Number
Average Value
Number
Average Value
LOANS ORIGINATED
5
$89,076
108
$105,250
73
$108,777
26
$44,402
23
$88,997
6
$45,097
APPLICATIONS APPROVED, NOT ACCEPTED
0
$0
11
$90,618
17
$107,669
3
$64,753
1
$26,370
0
$0
APPLICATIONS DENIED
0
$0
14
$119,317
71
$116,882
9
$33,886
1
$53,690
2
$48,815
APPLICATIONS WITHDRAWN
0
$0
7
$121,516
48
$108,497
2
$84,780
2
$151,160
1
$23,950
FILES CLOSED FOR INCOMPLETENESS
0
$0
1
$307,170
5
$147,046
0
$0
0
$0
0
$0
Aggregated Statistics For Year 2005 (Based on 4 partial tracts)
A) FHA, FSA/RHS & VA Home Purchase Loans
B) Conventional Home Purchase Loans
C) Refinancings
D) Home Improvement Loans
F) Non-occupant Loans on < 5 Family Dwellings (A B C & D)
G) Loans On Manufactured Home Dwelling (A B C & D)
Number
Average Value
Number
Average Value
Number
Average Value
Number
Average Value
Number
Average Value
Number
Average Value
LOANS ORIGINATED
12
$92,980
127
$94,019
102
$107,388
30
$76,959
20
$80,395
8
$63,195
APPLICATIONS APPROVED, NOT ACCEPTED
0
$0
14
$86,144
15
$109,041
0
$0
2
$65,785
1
$10,140
APPLICATIONS DENIED
1
$34,490
19
$98,703
72
$109,832
11
$31,335
5
$101,844
4
$50,835
APPLICATIONS WITHDRAWN
2
$61,120
12
$81,431
42
$120,956
8
$79,342
2
$52,450
1
$49,560
FILES CLOSED FOR INCOMPLETENESS
0
$0
5
$96,442
5
$105,612
1
$20,650
1
$198,240
0
$0
Aggregated Statistics For Year 2004 (Based on 4 partial tracts)
A) FHA, FSA/RHS & VA Home Purchase Loans
B) Conventional Home Purchase Loans
C) Refinancings
D) Home Improvement Loans
E) Loans on Dwellings For 5+ Families
F) Non-occupant Loans on < 5 Family Dwellings (A B C & D)
G) Loans On Manufactured Home Dwelling (A B C & D)

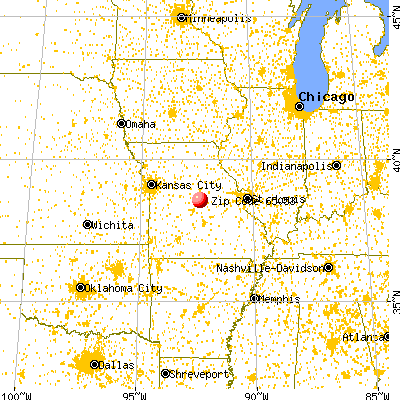


 Nearest zip codes: 65074, 65109, 65023, 65064, 65032, 65039.


