Estimated zip code population in 2022: 4,299 Zip code population in 2010: 4,084 Zip code population in 2000: 3,635
Houses and condos: 1,778 Renter-occupied apartments: 288
% of renters here:
17%
State:
32%
March 2022 cost of living index in zip code 66092: 80.9 (low, U.S. average is 100)
Land area: 83.8 sq. mi. Water area: 0.6 sq. mi.
Population density: 51 people per square mile
(very low).
OSM Map
General Map
Google Map
MSN Map
OSM Map
General Map
Google Map
MSN Map
OSM Map
General Map
Google Map
MSN Map
OSM Map
General Map
Google Map
MSN Map
Please wait while loading the map...
Real estate property taxes paid for housing units in 2022:
This zip code:
1.3% ($3,321)
Kansas:
1.2% ($2,578)
Median real estate property taxes paid for housing units with mortgages in 2022: $3,545 (1.3%) Median real estate property taxes paid for housing units with no mortgage in 2022: $2,622 (1.3%)
Estimated median house/condo value in 2022: $257,459
66092:
$257,459
Kansas:
$206,600
According to our research of Kansas and other state lists, there were 6 registered sex offenders living in 66092 zip code as of June 03, 2024. The ratio of all residents to sex offenders in zip code 66092 is 694 to 1. The ratio of registered sex offenders to all residents in this zip code is much lower than the state average.
Median resident age:
This zip code:
40.9 years
Kansas median age:
37.6 years
Average household size:
This zip code:
2.6 people
Kansas:
2.4 people
Averages for the 2020 tax year for zip code 66092, filed in 2021:
Average Adjusted Gross Income (AGI) in 2020: $68,979 (Individual Income Tax Returns)
Here:
$68,979
State:
$72,721
Salary/wage: $62,440 (reported on 81.4% of returns)
Here:
$62,440
State:
$58,641
(% of AGI for various income ranges: 1102.8% for AGIs below $25k, 3543.4% for AGIs $25k-50k, 6692.1% for AGIs $50k-75k, 9250.6% for AGIs $75k-100k, 16910.4% for AGIs $100k-200k, 43916.7% for AGIs over 200k)
Taxable interest for individuals: $977 (reported on 33.2% of returns)
This zip code:
$977
Kansas:
$1,625
(% of AGI for various income ranges: 23.3% for AGIs below $25k, 21.4% for AGIs $25k-50k, 80.8% for AGIs $50k-75k, 51.7% for AGIs $75k-100k, 57.0% for AGIs $100k-200k, 226.7% for AGIs over 200k)
Ordinary dividends: $3,350 (reported on 18.1% of returns)
Here:
$3,350
State:
$7,290
(% of AGI for various income ranges: 17.8% for AGIs below $25k, 28.6% for AGIs $25k-50k, 50.0% for AGIs $50k-75k, 90.6% for AGIs $75k-100k, 173.0% for AGIs $100k-200k, 1203.3% for AGIs over 200k)
Net capital gain/loss in AGI: +$12,429 (reported on 17.6% of returns)
Here:
+$12,429
State:
+$20,511
(% of AGI for various income ranges: 30.8% for AGIs below $25k, 42.3% for AGIs $25k-50k, 84.6% for AGIs $50k-75k, 153.3% for AGIs $75k-100k, 780.9% for AGIs $100k-200k, 6053.3% for AGIs over 200k)
Profit/loss from business: +$10,297 (reported on 16.6% of returns)
Here:
+$10,297
State:
+$13,852
(% of AGI for various income ranges: 143.9% for AGIs below $25k, 144.6% for AGIs $25k-50k, 330.8% for AGIs $50k-75k, 231.1% for AGIs $75k-100k, 506.1% for AGIs $100k-200k)
Taxable individual retirement arrangement distribution: $18,405 (reported on 11.1% of returns)
66092:
$18,405
Kansas:
$19,921
(% of AGI for various income ranges: 78.9% for AGIs below $25k, 97.7% for AGIs $25k-50k, 221.2% for AGIs $50k-75k, 317.8% for AGIs $75k-100k, 1008.7% for AGIs $100k-200k)
Total itemized deductions: $31,507 (reported on 7.5% of returns)
Here:
$31,507
State:
$36,939
(% of AGI for various income ranges: 282.3% for AGIs $25k-50k, 430.8% for AGIs $50k-75k, 662.6% for AGIs $100k-200k, 3933.3% for AGIs over 200k)
Charity contributions: $9,356 (reported on 4.5% of returns)
Here:
$9,356
State:
$15,443
(% of AGI for various income ranges: 37.5% for AGIs $50k-75k, 168.3% for AGIs $100k-200k, 1216.7% for AGIs over 200k)
Taxes paid: $7,792 (reported on 6.0% of returns)
66092:
$7,792
State:
$8,001
(% of AGI for various income ranges: 23.6% for AGIs below $25k, 86.7% for AGIs $50k-75k, 173.5% for AGIs $100k-200k, 810.0% for AGIs over 200k)
Earned income credit: $2,052 (reported on 12.6% of returns)
Here:
$2,052
State:
$2,267
(% of AGI for various income ranges: 73.9% for AGIs below $25k, 70.6% for AGIs $25k-50k)
Percentage of individuals using paid preparers for their 2020 taxes: 96.5%
Here:
96%
State:
95%
(% for various income ranges: 96.2% for AGIs below $25k, 95.5% for AGIs $25k-50k, 100.0% for AGIs $50k-75k, 95.7% for AGIs $75k-100k, 97.3% for AGIs $100k-200k, 85.7% for AGIs over 200k)
Averages for the 2012 tax year for zip code 66092, filed in 2013:
Average Adjusted Gross Income (AGI) in 2012: $56,202 (Individual Income Tax Returns)
Here:
$56,202
State:
$60,095
Salary/wage: $48,734 (reported on 85.0% of returns)
Here:
$48,734
State:
$48,770
(% of AGI for various income ranges: 69.9% for AGIs below $25k, 79.9% for AGIs $25k-50k, 77.8% for AGIs $50k-75k, 80.6% for AGIs $75k-100k, 80.3% for AGIs $100k-200k, 32.2% for AGIs over 200k)
Taxable interest for individuals: $965 (reported on 36.4% of returns)
This zip code:
$965
Kansas:
$1,506
(% of AGI for various income ranges: 1.7% for AGIs below $25k, 0.6% for AGIs $25k-50k, 0.6% for AGIs $50k-75k, 0.8% for AGIs $75k-100k, 0.4% for AGIs $100k-200k, 0.3% for AGIs over 200k)
Ordinary dividends: $2,933 (reported on 17.6% of returns)
Here:
$2,933
State:
$6,093
(% of AGI for various income ranges: 1.3% for AGIs below $25k, 0.6% for AGIs $25k-50k, 0.3% for AGIs $50k-75k, 0.5% for AGIs $75k-100k, 2.1% for AGIs $100k-200k)
Net capital gain/loss in AGI: +$6,041 (reported on 14.4% of returns)
Here:
+$6,041
State:
+$14,598
(% of AGI for various income ranges: 0.2% for AGIs $25k-50k, 0.8% for AGIs $50k-75k, 0.4% for AGIs $75k-100k, 4.7% for AGIs $100k-200k)
Profit/loss from business: +$7,416 (reported on 16.6% of returns)
Here:
+$7,416
State:
+$12,554
(% of AGI for various income ranges: 6.6% for AGIs below $25k, 4.5% for AGIs $25k-50k, 1.1% for AGIs $50k-75k, 1.6% for AGIs $75k-100k, 1.8% for AGIs $100k-200k)
Taxable individual retirement arrangement distribution: $12,005 (reported on 10.2% of returns)
66092:
$12,005
Kansas:
$14,098
(% of AGI for various income ranges: 4.2% for AGIs below $25k, 2.2% for AGIs $25k-50k, 2.6% for AGIs $50k-75k, 2.8% for AGIs $75k-100k, 1.8% for AGIs $100k-200k)
Total itemized deductions: $18,705 (21% of AGI, reported on 39.6% of returns)
Here:
$18,705
State:
$23,678
Here:
20.8% of AGI
State:
18.9% of AGI
(% of AGI for various income ranges: 14.9% for AGIs below $25k, 11.8% for AGIs $25k-50k, 12.7% for AGIs $50k-75k, 15.2% for AGIs $75k-100k, 14.1% for AGIs $100k-200k, 9.1% for AGIs over 200k)
Charity contributions: $3,193 (reported on 30.5% of returns)
Here:
$3,193
State:
$5,321
(% of AGI for various income ranges: 1.3% for AGIs below $25k, 1.2% for AGIs $25k-50k, 1.6% for AGIs $50k-75k, 1.8% for AGIs $75k-100k, 1.9% for AGIs $100k-200k, 2.4% for AGIs over 200k)
Taxes paid: $7,166 (reported on 39.6% of returns)
66092:
$7,166
State:
$9,548
(% of AGI for various income ranges: 3.1% for AGIs below $25k, 3.4% for AGIs $25k-50k, 4.5% for AGIs $50k-75k, 5.9% for AGIs $75k-100k, 6.3% for AGIs $100k-200k, 5.1% for AGIs over 200k)
Earned income credit: $2,056 (reported on 13.4% of returns)
Here:
$2,056
State:
$2,212
(% of AGI for various income ranges: 5.0% for AGIs below $25k, 0.9% for AGIs $25k-50k)
Percentage of individuals using paid preparers for their 2012 taxes: 64.2%
Here:
64%
State:
56%
(% for various income ranges: 59.7% for AGIs below $25k, 64.4% for AGIs $25k-50k, 68.8% for AGIs $50k-75k, 65.2% for AGIs $75k-100k, 73.9% for AGIs $100k-200k)
Averages for the 2004 tax year for zip code 66092, filed in 2005:
Average Adjusted Gross Income (AGI) in 2004: $47,197 (Individual Income Tax Returns)
Here:
$47,197
State:
$45,726
Salary/wage: $42,198 (reported on 86.2% of returns)
Here:
$42,198
State:
$40,112
(% of AGI for various income ranges: 88.5% for AGIs below $10k, 72.2% for AGIs $10k-25k, 82.2% for AGIs $25k-50k, 83.8% for AGIs $50k-75k, 89.9% for AGIs $75k-100k, 54.9% for AGIs over 100k)
Taxable interest for individuals: $1,284 (reported on 49.5% of returns)
This zip code:
$1,284
Kansas:
$1,749
(% of AGI for various income ranges: 6.1% for AGIs below $10k, 3.2% for AGIs $10k-25k, 1.5% for AGIs $25k-50k, 0.6% for AGIs $50k-75k, 0.4% for AGIs $75k-100k, 2.0% for AGIs over 100k)
Taxable dividends: $1,365 (reported on 23.6% of returns)
Here:
$1,365
State:
$3,066
(% of AGI for various income ranges: 1.0% for AGIs below $10k, 0.7% for AGIs $10k-25k, 0.8% for AGIs $25k-50k, 0.3% for AGIs $50k-75k, 0.4% for AGIs $75k-100k, 1.4% for AGIs over 100k)
Net capital gain/loss: +$3,694 (reported on 18.2% of returns)
Here:
+$3,694
State:
+$7,555
(% of AGI for various income ranges: -1.4% for AGIs below $10k, 1.1% for AGIs $10k-25k, 0.8% for AGIs $25k-50k, 1.2% for AGIs $50k-75k, 1.1% for AGIs $75k-100k, 2.8% for AGIs over 100k)
Profit/loss from business: +$5,558 (reported on 20.3% of returns)
Here:
+$5,558
State:
+$9,571
(% of AGI for various income ranges: 9.1% for AGIs below $10k, 9.2% for AGIs $10k-25k, 4.4% for AGIs $25k-50k, 1.9% for AGIs $50k-75k, 0.7% for AGIs $75k-100k, 0.1% for AGIs over 100k)
IRA payment deduction: $2,038 (reported on 3.2% of returns)
66092:
$2,038
Kansas:
$2,922
Total itemized deductions: $15,946 (21% of AGI, reported on 39.8% of returns)
Here:
$15,946
State:
$18,779
Here:
21.4% of AGI
State:
20.5% of AGI
(% of AGI for various income ranges: 12.9% for AGIs below $10k, 15.2% for AGIs $10k-25k, 12.5% for AGIs $25k-50k, 14.3% for AGIs $50k-75k, 15.2% for AGIs $75k-100k, 11.4% for AGIs over 100k)
Charity contributions deductions: $2,017 (3% of AGI, reported on 31.9% of returns)
Here:
$2,017
State:
$3,892
Here:
2.6% of AGI
State:
4.0% of AGI
(% of AGI for various income ranges: 1.2% for AGIs $10k-25k, 1.2% for AGIs $25k-50k, 1.5% for AGIs $50k-75k, 1.7% for AGIs $75k-100k, 1.2% for AGIs over 100k)
Total tax: $5,803 (reported on 79.1% of returns)
66092:
$5,803
State:
$7,203
(% of AGI for various income ranges: 3.4% for AGIs below $10k, 4.9% for AGIs $10k-25k, 6.5% for AGIs $25k-50k, 7.8% for AGIs $50k-75k, 9.9% for AGIs $75k-100k, 16.7% for AGIs over 100k)
Earned income credit: $1,667 (reported on 12.4% of returns)
Here:
$1,667
State:
$1,674
Percentage of individuals using paid preparers for their 2004 taxes: 68.4%
Here:
68%
State:
63%
(% for various income ranges: 59.3% for AGIs below $10k, 70.9% for AGIs $10k-25k, 68.5% for AGIs $25k-50k, 70.7% for AGIs $50k-75k, 69.9% for AGIs $75k-100k, 71.9% for AGIs over 100k)
Household received Food Stamps/SNAP in the past 12 months: 73 Household did not receive Food Stamps/SNAP in the past 12 months: 1,584
Women who had a birth in the past 12 months: 48 (11 now married, 36 unmarried) Women who did not have a birth in the past 12 months: 846 (574 now married, 269 unmarried)
Housing units in zip code 66092 with a mortgage: 949 (86 second mortgage, 85 both second mortgage and home equity loan) Median monthly owner costs for units with a mortgage: $1,878 Median monthly owner costs for units without a mortgage: $576
Residents with income below the poverty level in 2022:
This zip code:
7.3%
Whole state:
12.0%
Residents with income below 50% of the poverty level in 2022:
This zip code:
3.9%
Whole state:
6.4%
Median number of rooms in houses and condos:
Here:
6.8
State:
6.9
Median number of rooms in apartments:
Here:
4.3
State:
4.4
Notable locations in this zip code not listed on our city pages
Notable locations in zip code 66092: Wellsville Wastewater Plant (A), Wellsville Police Department (B), Wellsville City Fire Department (C), Wellsville City Library (D), Wellsville City Hall (E). Display/hide their locations on the map
Churches in zip code 66092 include: Wellsville Family Workship Center (A), Wellsville United Methodist Church (B), Wellsville Baptist Church (C), New Hope Baptist Church (D). Display/hide their locations on the map
Cemeteries: Walnut Creek Cemetery (1), Old Black Jack Cemetery (2), Black Jack Cemetery (3), Wellsville Cemetery (4). Display/hide their locations on the map
In group quarters: 62 (-1 institutionalized population)
Size of family households: 574 2-persons, 125 3-persons, 208 4-persons, 139 5-persons, 72 6-persons, 15 7-or-more-persons
Size of nonfamily households: 443 1-person, 69 2-persons, 5 4-persons
811 married couples with children.
105 single-parent households (48 men, 57 women).
97.9% of residents of 66092 zip code speak English at home.
2.3% of residents speak Spanish at home (40% very well, 54% well, 5% not at all).
0.1% of residents speak other Indo-European language at home (100% very well).
Foreign born population: 90 (2.1%) (53.0% of them are naturalized citizens)
This zip code:
2.1%
Whole state:
7.1%
32%Azores Islands
20%El Salvador
17%Honduras
11%Japan
3%France
3%Germany
22%German
19%Irish
16%American
15%English
3%British
2%European
2%Scottish
Year of entry for the foreign-born population
302010 or later
392000 to 2009
81990 to 1999
37Before 1990
Major facilities with environmental interests located in this zip code:
CENTRAL FIBER CORPORATION (4814 FIBER LANE in WELLSVILLE, KS)
SUPERFUND (Superfund database) STATE MASTER (Kansas Facility Profiler) - TANKS-43429, UNDERGROUND STORAGE TANK PROGRAM, TANKS-80128, WWT-C-MC48-NO02, WASTEWATER FACILITY (Resource Conservation and Recovery Act (tracking hazardous waste)) Business NAICS classification: ALL OTHER CONVERTED PAPER PRODUCT MANUFACTURING.; CELLULOSIC ORGANIC FIBER MANUFACTURING. Alternative names: DIVERSIFIED INSULATION-KS, SHELTER SHIELD
AVERILL, LARRY (4892 HIGHWAY K 33 in WELLSVILLE, KS)
STATE MASTER (Kansas Facility Profiler) - CAFO-07737, LIVE STOCK WASTE CONTROL National Pollutant Discharge Elimination System NON-MAJOR (Tracking pollutant discharge elimination systems) - permit Business SIC classification: HOGS Alternative names: LARRY AVERILL
COEN, JOHN C., DAIRY (4418 NEBRASKA TER in WELLSVILLE, KS)
STATE MASTER (Kansas Facility Profiler) - CAFO-07734, LIVE STOCK WASTE CONTROL National Pollutant Discharge Elimination System NON-MAJOR (Tracking pollutant discharge elimination systems) - permit Business SIC classification: DAIRY FARMS Alternative names: ANDERSON, GERALD/COEN, JOHN, JOHN COEN AND GERALD ANDERSON
KALB FARMS (1973 N 200TH RD in WELLSVILLE, KS)
STATE MASTER (Kansas Facility Profiler) - TANKS-42336, UNDERGROUND STORAGE TANK PROGRAM, CAFO-07528, LIVE STOCK WASTE CONTROL National Pollutant Discharge Elimination System NON-MAJOR (Tracking pollutant discharge elimination systems) - permit Business SIC classification: HOGS Alternative names: KALB, KERMIT, KERMIT KALB
WELLSVILLE ELEM (218 ASH in WELLSVILLE, KS)
(National Center for Education Statistics) - STATE ID-2620
WELLSVILLE HIGH (602 WALNUT in WELLSVILLE, KS)
(National Center for Education Statistics) - STATE ID-2622
WELLSVILLE MIDDLE SCHOOL (602 WALNUT STREET in WELLSVILLE, KS)
(National Center for Education Statistics) - STATE ID-2621
WELLSVILLE ELEMENTARY SCHOOL (624 WALNUT ST in WELLSVILLE, KS)
(Integrated Compliance Information System) - ICIS-07-1985-0231, FORMAL ENFORCEMENT ACTION Business SIC classification: ELEMENTARY AND SECONDARY SCHOOLS
WELLSVILLE HIGH SCHOOL (620 WALNUT in WELLSVILLE, KS)
(Integrated Compliance Information System) - ICIS-07-1985-0231, FORMAL ENFORCEMENT ACTION Business SIC classification: ELEMENTARY AND SECONDARY SCHOOLS
LEE AUTOMOTIVE (710 MAIN in WELLSVILLE, KS)
AIR MINOR (AIRS/AFS) USED OIL PROGRAM (Resource Conservation and Recovery Act (tracking hazardous waste)) Business SIC classification: GENERAL AUTOMOTIVE REPAIR SHOPS Organizations: TERRY MOYER (CONTACT/OWNER)
Alternative names: LEE AUTOMOTIVE & TOWING INC
WELLSVILLE CITY OF MAINT SHOP (730 MAIN in WELLSVILLE, KS)
(Resource Conservation and Recovery Act (tracking hazardous waste)) Organizations: CITY OF WELLSVILLE (CONTACT/OWNER)
WELLSVILLE WASTEWATER PLANT ( in WELLSVILLE, KS)
National Pollutant Discharge Elimination System NON-MAJOR (Tracking pollutant discharge elimination systems) - permit Business SIC classification: SEWERAGE SYSTEMS Organizations: WELLSVILLE, CITY OF (CONTACT/OWNER)
Alternative names: WELLSVILLE, CITY OF
WILHITE AUTOMOTIVE (218 W 7TH in WELLSVILLE, KS)
(Resource Conservation and Recovery Act (tracking hazardous waste))
Housing units lacking complete plumbing facilities: 2.2% Housing units lacking complete kitchen facilities: 0.7%
42.6%Utility gas
40.2%Electricity
12.9%Bottled, tank, or LP gas
2.5%Other fuel
2.0%Wood
Population in 1990: 2,178. Population change in the 1990s: +1,457 (+66.9%).
Place of birth for U.S.-born residents:
This state: 2,834
Northeast: 61
Midwest: 755
South: 143
West: 385
59% of the 66092 zip code residents lived in the same house 5 years ago. Out of people who lived in different houses, 38% lived in this county. Out of people who lived in different counties, 50% lived in Kansas.
90% of the 66092 zip code residents lived in the same house 1 year ago. Out of people who lived in different houses, 41% moved from this county. Out of people who lived in different houses, 47% moved from different county within same state. Out of people who lived in different houses, 15% moved from different state.
Private vs. public school enrollment:
Students in private schools in grades 1 to 8 (elementary and middle school): 23
Here:
5.6%
Kansas:
14.1%
Students in private schools in grades 9 to 12 (high school): 34
Here:
10.1%
Kansas:
10.8%
Students in private undergraduate colleges: 20
Here:
12.9%
Kansas:
15.4%
Occupation by median earnings in the past 12 months ($)
110,823Computer and mathematical occupations
77,921Health technologists and technicians
73,131Business and financial operations occupations
67,068Management occupations
62,498Construction and extraction occupations
54,382Health diagnosing and treating practitioners and other technical occupations
Top industries in this zip code by the number of employees in 2005:
Construction: All Other Specialty Trade Contractors (10-19 employees: 1 establishment, 5-9 employees: 1 establishment, 1-4 employees: 1 establishment)
Finance and Insurance: Commercial Banking (10-19: 1, 5-9: 1)
Construction: New Single-Family Housing Construction (except Operative Builders) (5-9: 2, 1-4: 3)
Other Services (except Public Administration): Religious Organizations (5-9: 2, 1-4: 1)
Health Care and Social Assistance: Home Health Care Services (10-19: 1)
Wholesale Trade: Farm and Garden Machinery and Equipment Merchant Wholesalers (10-19: 1)
People in group quarters in 2010:
36 people in nursing facilities/skilled-nursing facilities
People in group quarters in 2000:
45 people in nursing homes
Fatal accident statistics in 2014:
Fatal accident count: 1
Vehicles involved in fatal accidents: 2
Fatal accidents caused by drunken drivers: 0
Fatalities: 2
Persons involved in fatal accidents: 5
Pedestrians involved in fatal accidents: 0
Fatal accident statistics in 2013:
Fatal accident count: 1
Vehicles involved in fatal accidents: 1
Fatal accidents caused by drunken drivers: 0
Fatalities: 1
Persons involved in fatal accidents: 1
Pedestrians involved in fatal accidents: 1
Home Mortgage Disclosure Act Aggregated Statistics For Year 2009 (Based on 2 partial tracts)
A) FHA, FSA/RHS & VA Home Purchase Loans
B) Conventional Home Purchase Loans
C) Refinancings
D) Home Improvement Loans
F) Non-occupant Loans on < 5 Family Dwellings (A B C & D)
G) Loans On Manufactured Home Dwelling (A B C & D)
Number
Average Value
Number
Average Value
Number
Average Value
Number
Average Value
Number
Average Value
Number
Average Value
LOANS ORIGINATED
11
$128,560
11
$159,805
73
$161,966
6
$86,325
8
$143,180
1
$72,420
APPLICATIONS APPROVED, NOT ACCEPTED
0
$0
1
$117,260
5
$139,762
1
$130,500
1
$139,690
0
$0
APPLICATIONS DENIED
2
$136,380
3
$137,850
17
$177,637
1
$47,050
0
$0
0
$0
APPLICATIONS WITHDRAWN
0
$0
1
$107,710
12
$193,388
1
$74,620
0
$0
0
$0
FILES CLOSED FOR INCOMPLETENESS
0
$0
0
$0
3
$230,363
0
$0
0
$0
0
$0
Aggregated Statistics For Year 2008 (Based on 2 partial tracts)
A) FHA, FSA/RHS & VA Home Purchase Loans
B) Conventional Home Purchase Loans
C) Refinancings
D) Home Improvement Loans
E) Loans on Dwellings For 5+ Families
F) Non-occupant Loans on < 5 Family Dwellings (A B C & D)
G) Loans On Manufactured Home Dwelling (A B C & D)
Number
Average Value
Number
Average Value
Number
Average Value
Number
Average Value
Number
Average Value
Number
Average Value
Number
Average Value
LOANS ORIGINATED
6
$165,297
13
$165,788
61
$148,908
5
$63,228
1
$33,450
16
$122,916
1
$168,360
APPLICATIONS APPROVED, NOT ACCEPTED
0
$0
0
$0
6
$168,545
1
$15,810
0
$0
0
$0
0
$0
APPLICATIONS DENIED
2
$143,180
3
$200,097
17
$172,166
2
$83,260
0
$0
1
$111,750
0
$0
APPLICATIONS WITHDRAWN
1
$190,420
1
$259,160
8
$189,681
1
$71,310
0
$0
1
$60,650
0
$0
FILES CLOSED FOR INCOMPLETENESS
0
$0
0
$0
1
$224,600
0
$0
0
$0
0
$0
0
$0
Aggregated Statistics For Year 2007 (Based on 2 partial tracts)
A) FHA, FSA/RHS & VA Home Purchase Loans
B) Conventional Home Purchase Loans
C) Refinancings
D) Home Improvement Loans
F) Non-occupant Loans on < 5 Family Dwellings (A B C & D)
G) Loans On Manufactured Home Dwelling (A B C & D)
Number
Average Value
Number
Average Value
Number
Average Value
Number
Average Value
Number
Average Value
Number
Average Value
LOANS ORIGINATED
2
$176,630
40
$130,847
63
$126,262
8
$32,716
10
$110,684
2
$62,490
APPLICATIONS APPROVED, NOT ACCEPTED
0
$0
4
$154,852
6
$104,030
1
$193,730
0
$0
0
$0
APPLICATIONS DENIED
0
$0
5
$215,046
24
$139,841
4
$90,705
2
$139,135
1
$88,960
APPLICATIONS WITHDRAWN
0
$0
5
$129,396
11
$145,503
4
$74,622
1
$119,100
0
$0
FILES CLOSED FOR INCOMPLETENESS
0
$0
1
$275,330
4
$140,882
0
$0
0
$0
0
$0
Aggregated Statistics For Year 2006 (Based on 2 partial tracts)
A) FHA, FSA/RHS & VA Home Purchase Loans
B) Conventional Home Purchase Loans
C) Refinancings
D) Home Improvement Loans
F) Non-occupant Loans on < 5 Family Dwellings (A B C & D)
G) Loans On Manufactured Home Dwelling (A B C & D)
Number
Average Value
Number
Average Value
Number
Average Value
Number
Average Value
Number
Average Value
Number
Average Value
LOANS ORIGINATED
3
$130,377
44
$136,121
67
$122,877
8
$36,990
22
$108,993
2
$61,940
APPLICATIONS APPROVED, NOT ACCEPTED
0
$0
4
$104,858
6
$212,718
1
$44,110
1
$192,620
0
$0
APPLICATIONS DENIED
0
$0
11
$118,066
36
$139,300
4
$71,590
4
$105,042
1
$130,500
APPLICATIONS WITHDRAWN
0
$0
6
$125,045
19
$132,123
3
$115,793
1
$205,860
0
$0
FILES CLOSED FOR INCOMPLETENESS
0
$0
3
$190,783
7
$140,529
0
$0
0
$0
0
$0
Aggregated Statistics For Year 2005 (Based on 2 partial tracts)
A) FHA, FSA/RHS & VA Home Purchase Loans
B) Conventional Home Purchase Loans
C) Refinancings
D) Home Improvement Loans
F) Non-occupant Loans on < 5 Family Dwellings (A B C & D)
G) Loans On Manufactured Home Dwelling (A B C & D)
Number
Average Value
Number
Average Value
Number
Average Value
Number
Average Value
Number
Average Value
Number
Average Value
LOANS ORIGINATED
4
$139,595
61
$120,223
55
$122,043
6
$81,423
15
$110,255
4
$41,540
APPLICATIONS APPROVED, NOT ACCEPTED
0
$0
4
$126,455
6
$132,948
1
$10,290
1
$192,620
0
$0
APPLICATIONS DENIED
1
$150,720
7
$128,660
37
$127,100
3
$61,880
5
$106,824
1
$97,780
APPLICATIONS WITHDRAWN
0
$0
6
$129,273
21
$132,249
4
$138,770
1
$122,040
0
$0
FILES CLOSED FOR INCOMPLETENESS
0
$0
4
$129,670
11
$133,806
0
$0
2
$117,815
0
$0
Aggregated Statistics For Year 2004 (Based on 2 partial tracts)
A) FHA, FSA/RHS & VA Home Purchase Loans
B) Conventional Home Purchase Loans
C) Refinancings
D) Home Improvement Loans
F) Non-occupant Loans on < 5 Family Dwellings (A B C & D)
G) Loans On Manufactured Home Dwelling (A B C & D)
Number
Average Value
Number
Average Value
Number
Average Value
Number
Average Value
Number
Average Value
Number
Average Value
LOANS ORIGINATED
3
$134,910
35
$133,975
88
$129,404
6
$48,952
21
$100,425
1
$151,450
APPLICATIONS APPROVED, NOT ACCEPTED
0
$0
4
$122,228
9
$118,898
2
$100,720
1
$60,650
1
$152,190
APPLICATIONS DENIED
1
$83,450
7
$112,013
22
$129,512
6
$48,400
3
$94,473
0
$0
APPLICATIONS WITHDRAWN
1
$116,900
5
$116,530
18
$138,116
0
$0
0
$0
0
$0
FILES CLOSED FOR INCOMPLETENESS
0
$0
1
$156,970
7
$116,739
0
$0
0
$0
0
$0
Aggregated Statistics For Year 2003 (Based on 2 partial tracts)
A) FHA, FSA/RHS & VA Home Purchase Loans
B) Conventional Home Purchase Loans
C) Refinancings
D) Home Improvement Loans
F) Non-occupant Loans on < 5 Family Dwellings (A B C & D)
Detailed PMIC statistics for the following Tracts:0012.03
2002 - 2018 National Fire Incident Reporting System (NFIRS) incidents
Based on the data from the years 2002 - 2018 the average number of fires per year is 45. The highest number of reported fire incidents - 79 took place in 2018, and the least - 10 in 2010. The data has a growing trend.
When looking into fire subcategories, the most reports belonged to: Outside Fires (63.9%), and Structure Fires (19.6%).
Fire incident types reported to NFIRS in Zip Code 66092

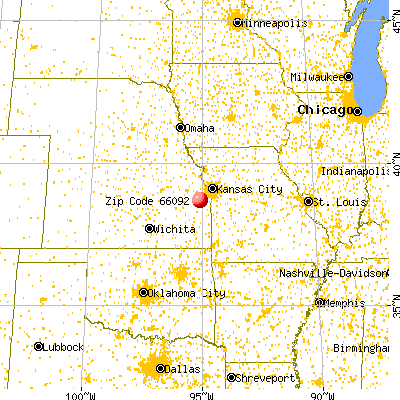


 Nearest zip codes: 66021, 66079, 66006, 66025, 66030, 66067.


 Based on the data from the years 2002 - 2018 the average number of fires per year is 45. The highest number of reported fire incidents - 79 took place in 2018, and the least - 10 in 2010. The data has a growing trend.
 When looking into fire subcategories, the most reports belonged to: Outside Fires (63.9%), and Structure Fires (19.6%).