Estimated zip code population in 2022: 775 Zip code population in 2010: 741 Zip code population in 2000: 718
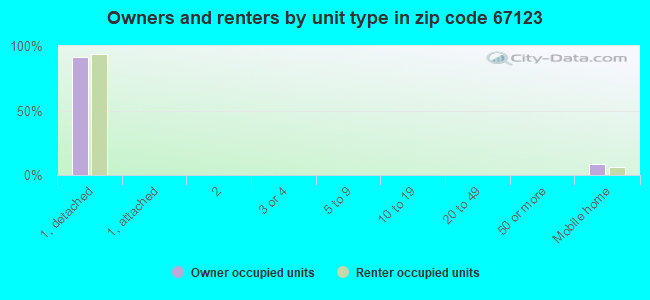
Houses and condos: 355 Renter-occupied apartments: 16
% of renters here:
5%
State:
32%
March 2022 cost of living index in zip code 67123: 78.7 (low, U.S. average is 100)
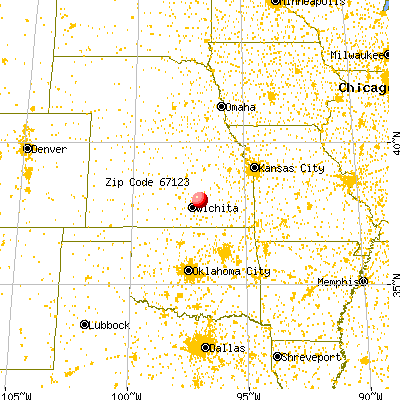
Land area: 51.8 sq. mi. Water area: 0.2 sq. mi.
Population density: 15 people per square mile
(very low).
OSM Map
General Map
Google Map
MSN Map
OSM Map
General Map
Google Map
MSN Map
OSM Map
General Map
Google Map
MSN Map
OSM Map
General Map
Google Map
MSN Map
Please wait while loading the map...
Real estate property taxes paid for housing units in 2022:
This zip code:
1.9% ($2,368)
Kansas:
1.2% ($2,578)
Median real estate property taxes paid for housing units with mortgages in 2022: $2,852 (1.5%) Median real estate property taxes paid for housing units with no mortgage in 2022: $2,053 (2.2%)
Business Search- 14 Million verified businesses
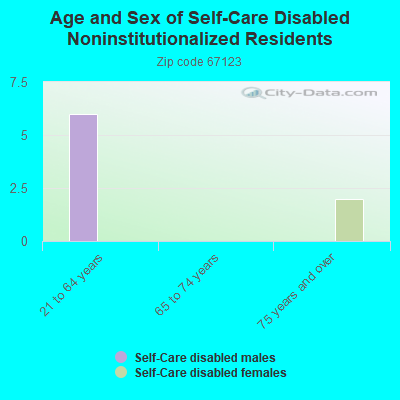
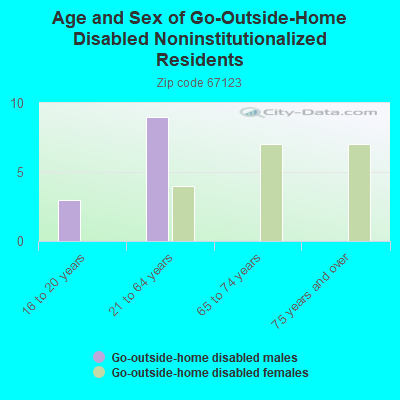
Males: 432
(55.8%)
Females: 342
(44.2%)
For population 25 years and over in 67123:
High school or higher: 92.7%
Bachelor's degree or higher: 16.3%
Graduate or professional degree: 2.6%
Unemployed: 4.4%
Mean travel time to work (commute): 30.5 minutes
For population 15 years and over in 67123:
Never married: 33.8%
Now married: 52.8%
Separated: 0.0%
Widowed: 5.4%
Divorced: 8.0%
Zip code 67123 compared to state average:
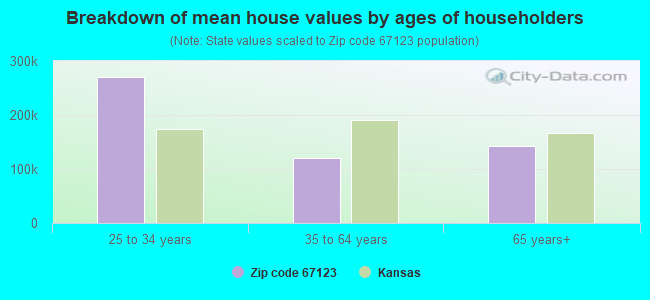
Median house value below state average.
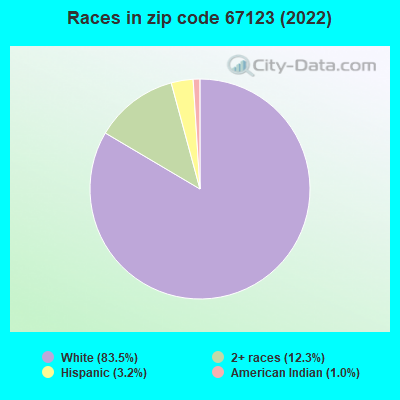
Black race population percentage significantly below state average.
Hispanic race population percentage significantly below state average.
Median age significantly above state average.
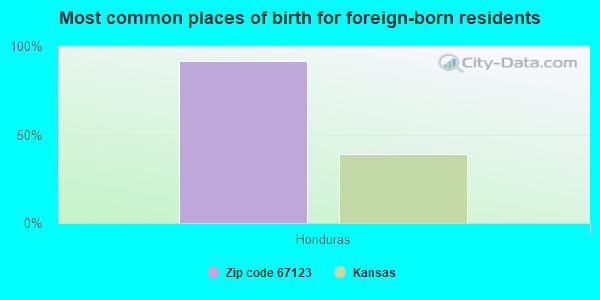
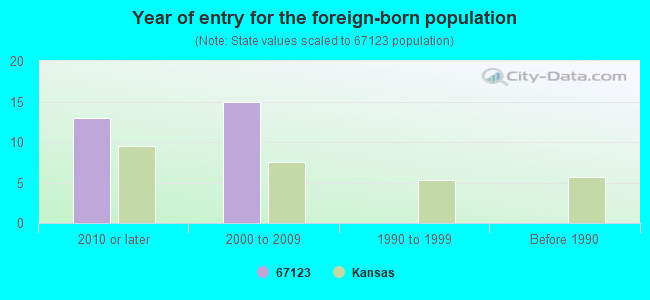
Foreign-born population percentage significantly below state average.
Renting percentage significantly below state average.
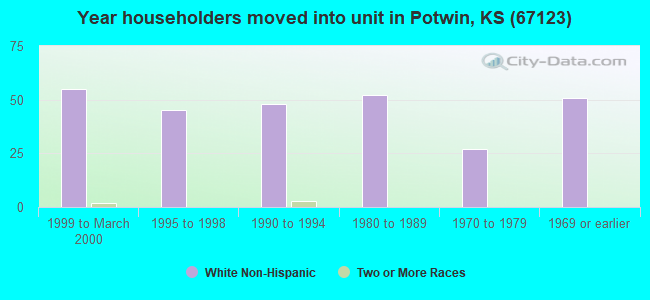
Length of stay since moving in significantly above state average.
Number of college students below state average.
Percentage of population with a bachelor's degree or higher below state average.
Estimated median house/condo value in 2022: $122,781
67123:
$122,781
Kansas:
$206,600
Median resident age:
This zip code:
50.7 years
Kansas median age:
37.6 years
Average household size:
This zip code:
2.3 people
Kansas:
2.4 people
Averages for the 2020 tax year for zip code 67123, filed in 2021:
Average Adjusted Gross Income (AGI) in 2020: $51,773 (Individual Income Tax Returns)
Here:
$51,773
State:
$72,721
Salary/wage: $44,071 (reported on 80.0% of returns)
Here:
$44,071
State:
$58,641
(% of AGI for various income ranges: 1187.1% for AGIs below $25k, 3690.0% for AGIs $25k-50k, 3390.0% for AGIs $50k-75k, 20650.0% for AGIs $100k-200k)
Taxable interest for individuals: $460 (reported on 33.3% of returns)
This zip code:
$460
Kansas:
$1,625
(% of AGI for various income ranges: 8.6% for AGIs below $25k, 31.4% for AGIs $25k-50k, 90.0% for AGIs $100k-200k)
Ordinary dividends: $3,725 (reported on 13.3% of returns)
Here:
$3,725
State:
$7,290
(% of AGI for various income ranges: 372.5% for AGIs $50k-75k)
Net capital gain/loss in AGI: +$1,840 (reported on 16.7% of returns)
Here:
+$1,840
State:
+$20,511
(% of AGI for various income ranges: 28.6% for AGIs below $25k)
Profit/loss from business: +$5,925 (reported on 13.3% of returns)
Here:
+$5,925
State:
+$13,852
(% of AGI for various income ranges: 338.6% for AGIs $25k-50k)
Taxable individual retirement arrangement distribution: $10,167 (reported on 10.0% of returns)
67123:
$10,167
Kansas:
$19,921
(% of AGI for various income ranges: 435.7% for AGIs $25k-50k)
Earned income credit: $2,275 (reported on 13.3% of returns)
Here:
$2,275
State:
$2,267
(% of AGI for various income ranges: 130.0% for AGIs below $25k)
Percentage of individuals using paid preparers for their 2020 taxes: 96.7%
Here:
97%
State:
95%
(% for various income ranges: 90.0% for AGIs below $25k, 100.0% for AGIs $25k-50k, 100.0% for AGIs $50k-75k, 100.0% for AGIs $75k-100k, 100.0% for AGIs $100k-200k)
Averages for the 2012 tax year for zip code 67123, filed in 2013:
Average Adjusted Gross Income (AGI) in 2012: $49,547 (Individual Income Tax Returns)
Here:
$49,547
State:
$60,095
Salary/wage: $40,346 (reported on 86.7% of returns)
Here:
$40,346
State:
$48,770
(% of AGI for various income ranges: 69.7% for AGIs below $25k, 78.7% for AGIs $25k-50k, 77.5% for AGIs $50k-75k, 73.0% for AGIs $75k-100k, 58.7% for AGIs $100k-200k)
Taxable interest for individuals: $390 (reported on 33.3% of returns)
This zip code:
$390
Kansas:
$1,506
(% of AGI for various income ranges: 0.4% for AGIs below $25k, 0.3% for AGIs $25k-50k, 0.4% for AGIs $50k-75k, 0.2% for AGIs $100k-200k)
Ordinary dividends: $1,250 (reported on 13.3% of returns)
Here:
$1,250
State:
$6,093
Profit/loss from business: +$6,100 (reported on 6.7% of returns)
Here:
+$6,100
State:
+$12,554
Taxable individual retirement arrangement distribution: $6,400 (reported on 13.3% of returns)
67123:
$6,400
Kansas:
$14,098
Total itemized deductions: $17,650 (18% of AGI, reported on 20.0% of returns)
Here:
$17,650
State:
$23,678
Here:
18.0% of AGI
State:
18.9% of AGI
Charity contributions: $3,420 (reported on 16.7% of returns)
Here:
$3,420
State:
$5,321
(% of AGI for various income ranges: 2.2% for AGIs $50k-75k, 2.1% for AGIs $100k-200k)
Taxes paid: $7,150 (reported on 20.0% of returns)
67123:
$7,150
State:
$9,548
Earned income credit: $1,960 (reported on 16.7% of returns)
Here:
$1,960
State:
$2,212
(% of AGI for various income ranges: 7.9% for AGIs below $25k)
Percentage of individuals using paid preparers for their 2012 taxes: 53.3%
Here:
53%
State:
56%
(% for various income ranges: 40.0% for AGIs below $25k, 62.5% for AGIs $25k-50k, 50.0% for AGIs $50k-75k, 66.7% for AGIs $75k-100k, 66.7% for AGIs $100k-200k)
Averages for the 2004 tax year for zip code 67123, filed in 2005:
Average Adjusted Gross Income (AGI) in 2004: $36,446 (Individual Income Tax Returns)
Here:
$36,446
State:
$45,726
Salary/wage: $33,439 (reported on 88.5% of returns)
Here:
$33,439
State:
$40,112
(% of AGI for various income ranges: 92.4% for AGIs below $10k, 84.3% for AGIs $10k-25k, 85.0% for AGIs $25k-50k, 84.4% for AGIs $50k-75k, 71.6% for AGIs $75k-100k)
Taxable interest for individuals: $694 (reported on 38.5% of returns)
This zip code:
$694
Kansas:
$1,749
(% of AGI for various income ranges: 4.6% for AGIs below $10k, 0.3% for AGIs $10k-25k, 1.6% for AGIs $25k-50k, 0.4% for AGIs $50k-75k, 0.1% for AGIs $75k-100k)
Taxable dividends: $511 (reported on 15.0% of returns)
Here:
$511
State:
$3,066
Net capital gain/loss: +$2,130 (reported on 7.3% of returns)
Here:
+$2,130
State:
+$7,555
Profit/loss from business: +$923 (reported on 8.3% of returns)
Here:
+$923
State:
+$9,571
Total itemized deductions: $13,955 (21% of AGI, reported on 21.0% of returns)
Here:
$13,955
State:
$18,779
Here:
21.4% of AGI
State:
20.5% of AGI
Charity contributions deductions: $1,583 (2% of AGI, reported on 15.3% of returns)
Here:
$1,583
State:
$3,892
Here:
2.5% of AGI
State:
4.0% of AGI
Total tax: $3,927 (reported on 74.2% of returns)
67123:
$3,927
State:
$7,203
(% of AGI for various income ranges: 1.7% for AGIs below $10k, 4.5% for AGIs $10k-25k, 6.9% for AGIs $25k-50k, 8.8% for AGIs $50k-75k, 10.5% for AGIs $75k-100k)
Earned income credit: $1,896 (reported on 15.3% of returns)
Here:
$1,896
State:
$1,674
Percentage of individuals using paid preparers for their 2004 taxes: 62.4%
Here:
62%
State:
63%
(% for various income ranges: 53.7% for AGIs below $10k, 66.7% for AGIs $10k-25k, 60.0% for AGIs $25k-50k, 65.5% for AGIs $50k-75k, 66.7% for AGIs $75k-100k)
Household received Food Stamps/SNAP in the past 12 months: 22 Household did not receive Food Stamps/SNAP in the past 12 months: 311
Women who had a birth in the past 12 months: 10 (10 now married, 0 unmarried) Women who did not have a birth in the past 12 months: 86 (14 now married, 71 unmarried)
Housing units in zip code 67123 with a mortgage: 146 (15 second mortgage, 13 both second mortgage and home equity loan) Houses without a mortgage: 9
Median monthly owner costs for units with a mortgage: $1,084 Median monthly owner costs for units without a mortgage: $545
Residents with income below the poverty level in 2022:
This zip code:
12.0%
Whole state:
12.0%
Residents with income below 50% of the poverty level in 2022:
This zip code:
0.8%
Whole state:
6.4%
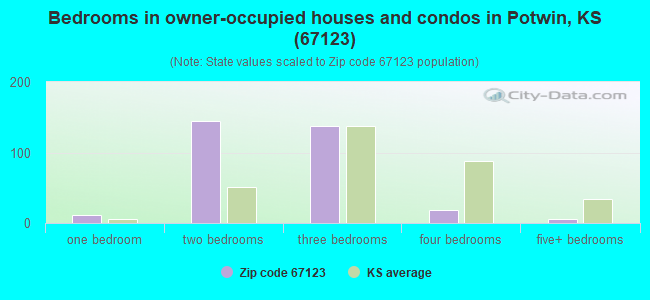
Median number of rooms in houses and condos:
Here:
5.5
State:
6.9
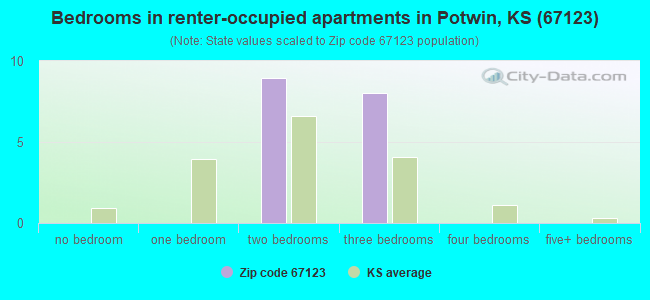
Median number of rooms in apartments:
Here:
5.6
State:
4.4
Notable locations in this zip code not listed on our city pages
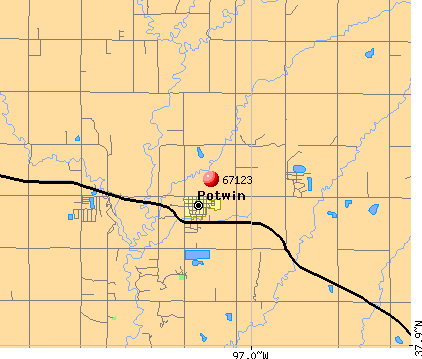
Notable locations in zip code 67123: KTLI - FM (Potwin) (A), Potwin - Butler County Fire Department (B), Potwin Public Library (C), Potwin City Hall (D). Display/hide their locations on the map
Rivers and creeks: May Branch Whitewater River (A), East Branch Whitewater River (B), Diamond Creek (C), Fourmile Creek (D), Brush Creek (E). Display/hide their locations on the map
Size of family households: 166 2-persons, 27 3-persons, 27 4-persons, 13 5-persons, 8 6-persons, 1 7-or-more-persons
Size of nonfamily households: 78 1-person, 11 2-persons
64 married couples with children.
14 single-parent households (6 men, 8 women).
98.8% of residents of 67123 zip code speak English at home.
1.0% of residents speak other Indo-European language at home (88% very well, 12% not well).
0.1% of residents speak other language at home (100% very well).
Foreign born population: 12 (1.6%) (0.0% of them are naturalized citizens)
:
1.6%
Whole state:
7.1%
92%Honduras
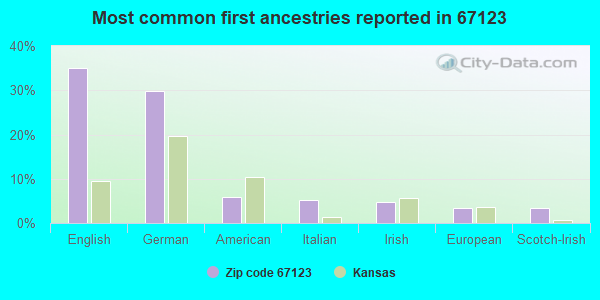
35%English
30%German
6%American
5%Italian
5%Irish
3%European
3%Scotch-Irish
Year of entry for the foreign-born population
132010 or later
152000 to 2009
01990 to 1999
0Before 1990
Facilities with environmental interests located in this zip code:
TOTAL PIPE LINE MAINTENANCE FACILITY (121 SOUTH RANDALL STREET in POTWIN, KS)
(Resource Conservation and Recovery Act (tracking hazardous waste)) Organizations: TOTAL PETROLEUM INC (CONTACT/OWNER)
Alternative names: TOTAL PET INC, TOTAL PET INC, TOTAL PETROLEUM INC, TOTAL PIPE LINE-POTWIN STATION
CEDAR RIDGE FARMS, INC (7680 NORTHWEST 120TH STREET in POTWIN, KS)
STATE MASTER (Kansas Facility Profiler) - CAFO-07267, LIVE STOCK WASTE CONTROL National Pollutant Discharge Elimination System NON-MAJOR (Tracking pollutant discharge elimination systems) - permit Business SIC classification: HOGS
MANN S ATP INC (CLYDE) (7865 NORTHWEST 80TH STREET in POTWIN, KS)
STATE MASTER (Kansas Facility Profiler) - CAFO-10409, LIVE STOCK WASTE CONTROL National Pollutant Discharge Elimination System NON-MAJOR (Tracking pollutant discharge elimination systems) - permit Business SIC classification: BEEF CATTLE FEEDLOTS Alternative names: MANNS ATP, MANN'S ATP INC (CLYDE)
TOTAL PIPE LINE PARRIS STATION (NW1/4 SEC20 T23 R4 in POTWIN, KS)
(Resource Conservation and Recovery Act (tracking hazardous waste))
LUBRICATION ENGINEERS, INC. (203 ANITA in POTWIN, KS)
National Pollutant Discharge Elimination System NON-MAJOR (Tracking pollutant discharge elimination systems) - permit Business SIC classification: LUBRICATING OILS AND GREASES Alternative names: LUBRICATION ENG - POTWIN, POTWIN REFINERY & TANK FARM
CIRCLE E FEEDLOT (7800 NORTHWEST TAWAKONI ROAD in POTWIN, KS)
National Pollutant Discharge Elimination System NON-MAJOR (Tracking pollutant discharge elimination systems) - permit Business SIC classification: BEEF CATTLE FEEDLOTS
TOTAL PIPELINE - POTWIN STATION (SW 1/4 SEC 29 T24 R4 in POTWIN, KS)
SUPERFUND (Superfund database)
MCCONNELL (EX) TITAN II -1 (NW 1/4 SEC 9, T24S, R4E in POTWIN, KS)
SUPERFUND (Superfund database) Alternative names: MCCONNELL (EX) TITAN II MISSILE SITE - 1 ALT B
Housing units lacking complete plumbing facilities: 2.3% Housing units lacking complete kitchen facilities: 1.5%
43.9%Utility gas
43.9%Electricity
6.5%Wood
6.1%Bottled, tank, or LP gas
Population in 1990: 900.
Place of birth for U.S.-born residents:
This state: 643
Northeast: 6
Midwest: 31
South: 38
West: 29
66% of the 67123 zip code residents lived in the same house 5 years ago. Out of people who lived in different houses, 73% lived in this county. Out of people who lived in different counties, 50% lived in Kansas.
96% of the 67123 zip code residents lived in the same house 1 year ago. Out of people who lived in different houses, 48% moved from this county. Out of people who lived in different houses, 62% moved from different county within same state.
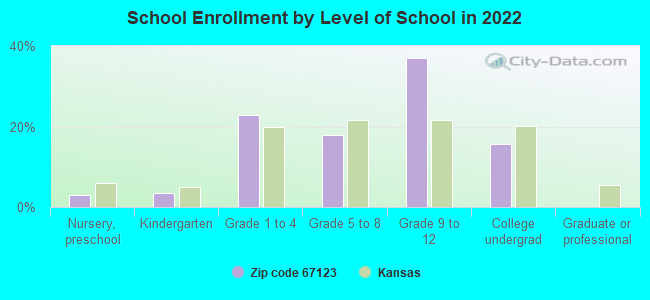
Private vs. public school enrollment:
Students in private schools in grades 1 to 8 (elementary and middle school):
Here:
0.0%
Kansas:
14.1%
Students in private schools in grades 9 to 12 (high school):
Here:
0.0%
Kansas:
10.8%
Students in private undergraduate colleges:
Here:
0.0%
Kansas:
15.4%
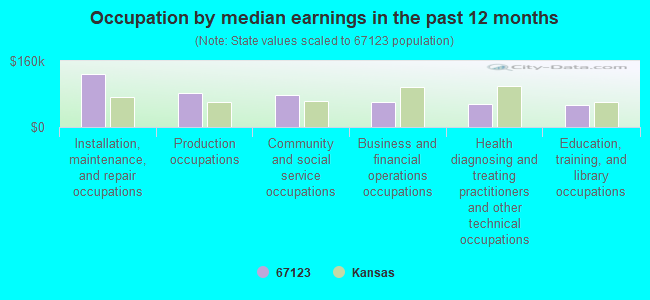
Occupation by median earnings in the past 12 months ($)
128,910Installation, maintenance, and repair occupations
81,244Production occupations
77,082Community and social service occupations
59,411Business and financial operations occupations
56,092Health diagnosing and treating practitioners and other technical occupations
52,530Education, training, and library occupations
Top industries in this zip code by the number of employees in 2005:
Construction: Painting and Wall Covering Contractors (5-9 employees: 1 establishment)
Construction: Framing Contractors (5-9: 1)
Wholesale Trade: Other Construction Material Merchant Wholesalers (5-9: 1)
Professional, Scientific, and Technical Services: Computer Systems Design Services (1-4: 1)
Professional, Scientific, and Technical Services: Offices of Lawyers (1-4: 1)
Construction: Water and Sewer Line and Related Structures Construction (1-4: 1)
Home Mortgage Disclosure Act Aggregated Statistics For Year 2009 (Based on 2 partial tracts)
A) FHA, FSA/RHS & VA Home Purchase Loans
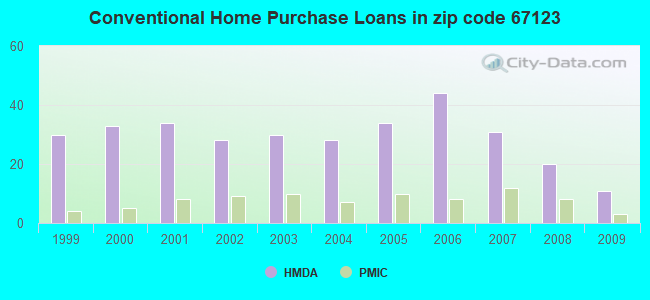
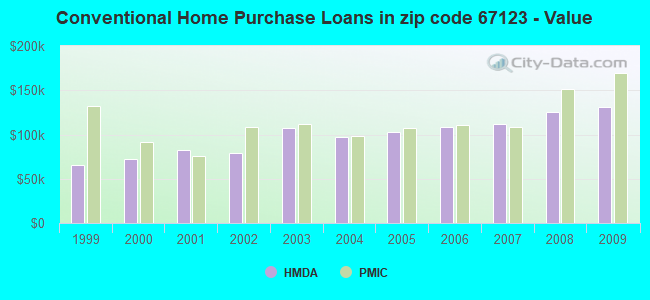
B) Conventional Home Purchase Loans
C) Refinancings
D) Home Improvement Loans
F) Non-occupant Loans on < 5 Family Dwellings (A B C & D)
G) Loans On Manufactured Home Dwelling (A B C & D)
Number
Average Value
Number
Average Value
Number
Average Value
Number
Average Value
Number
Average Value
Number
Average Value
LOANS ORIGINATED
11
$112,526
11
$131,435
55
$137,929
12
$58,310
4
$51,905
5
$75,134
APPLICATIONS APPROVED, NOT ACCEPTED
0
$0
1
$88,170
3
$128,613
2
$8,290
0
$0
2
$36,740
APPLICATIONS DENIED
3
$119,697
4
$109,555
24
$146,088
3
$47,227
2
$68,390
4
$92,788
APPLICATIONS WITHDRAWN
2
$104,375
2
$103,995
9
$134,267
1
$91,940
0
$0
1
$67,450
FILES CLOSED FOR INCOMPLETENESS
0
$0
0
$0
2
$85,910
0
$0
0
$0
0
$0
Aggregated Statistics For Year 2008 (Based on 2 partial tracts)
A) FHA, FSA/RHS & VA Home Purchase Loans
B) Conventional Home Purchase Loans
C) Refinancings
D) Home Improvement Loans
F) Non-occupant Loans on < 5 Family Dwellings (A B C & D)
G) Loans On Manufactured Home Dwelling (A B C & D)
Number
Average Value
Number
Average Value
Number
Average Value
Number
Average Value
Number
Average Value
Number
Average Value
LOANS ORIGINATED
8
$96,555
20
$125,983
40
$120,708
17
$34,577
6
$79,253
7
$60,450
APPLICATIONS APPROVED, NOT ACCEPTED
1
$81,390
3
$111,030
5
$116,732
2
$15,825
1
$54,640
2
$49,740
APPLICATIONS DENIED
2
$64,435
7
$78,429
19
$116,094
9
$60,664
2
$39,750
5
$58,780
APPLICATIONS WITHDRAWN
1
$56,900
3
$169,433
9
$153,064
1
$15,450
1
$83,270
2
$56,895
FILES CLOSED FOR INCOMPLETENESS
0
$0
0
$0
1
$151,100
0
$0
0
$0
0
$0
Aggregated Statistics For Year 2007 (Based on 2 partial tracts)
A) FHA, FSA/RHS & VA Home Purchase Loans
B) Conventional Home Purchase Loans
C) Refinancings
D) Home Improvement Loans
F) Non-occupant Loans on < 5 Family Dwellings (A B C & D)
G) Loans On Manufactured Home Dwelling (A B C & D)
Number
Average Value
Number
Average Value
Number
Average Value
Number
Average Value
Number
Average Value
Number
Average Value
LOANS ORIGINATED
4
$124,720
31
$111,666
35
$106,817
12
$52,281
5
$70,688
3
$51,747
APPLICATIONS APPROVED, NOT ACCEPTED
0
$0
4
$195,182
4
$71,120
3
$50,113
0
$0
2
$45,595
APPLICATIONS DENIED
1
$189,150
9
$97,549
23
$148,738
8
$41,636
3
$64,937
4
$46,818
APPLICATIONS WITHDRAWN
1
$188,020
2
$172,200
8
$129,195
0
$0
0
$0
0
$0
FILES CLOSED FOR INCOMPLETENESS
0
$0
2
$122,270
4
$133,575
0
$0
0
$0
0
$0
Aggregated Statistics For Year 2006 (Based on 2 partial tracts)
A) FHA, FSA/RHS & VA Home Purchase Loans
B) Conventional Home Purchase Loans
C) Refinancings
D) Home Improvement Loans
F) Non-occupant Loans on < 5 Family Dwellings (A B C & D)
G) Loans On Manufactured Home Dwelling (A B C & D)
Number
Average Value
Number
Average Value
Number
Average Value
Number
Average Value
Number
Average Value
Number
Average Value
LOANS ORIGINATED
3
$137,157
44
$107,970
48
$109,727
15
$22,985
6
$65,688
4
$55,295
APPLICATIONS APPROVED, NOT ACCEPTED
0
$0
6
$80,887
9
$78,626
1
$63,300
2
$79,505
3
$72,347
APPLICATIONS DENIED
1
$69,330
13
$85,505
28
$78,401
8
$29,626
2
$78,185
5
$58,480
APPLICATIONS WITHDRAWN
0
$0
5
$73,626
16
$107,953
1
$22,610
0
$0
0
$0
FILES CLOSED FOR INCOMPLETENESS
1
$56,520
1
$89,300
3
$71,970
0
$0
0
$0
0
$0
Aggregated Statistics For Year 2005 (Based on 2 partial tracts)
A) FHA, FSA/RHS & VA Home Purchase Loans
B) Conventional Home Purchase Loans
C) Refinancings
D) Home Improvement Loans
F) Non-occupant Loans on < 5 Family Dwellings (A B C & D)
G) Loans On Manufactured Home Dwelling (A B C & D)
Number
Average Value
Number
Average Value
Number
Average Value
Number
Average Value
Number
Average Value
Number
Average Value
LOANS ORIGINATED
4
$104,845
34
$102,999
46
$103,014
17
$36,549
7
$59,589
6
$46,032
APPLICATIONS APPROVED, NOT ACCEPTED
0
$0
4
$80,635
8
$89,114
2
$42,390
0
$0
2
$29,765
APPLICATIONS DENIED
2
$82,895
8
$99,145
33
$84,529
6
$48,168
2
$158,820
3
$45,593
APPLICATIONS WITHDRAWN
0
$0
6
$107,640
24
$104,028
2
$83,840
2
$77,620
2
$32,595
FILES CLOSED FOR INCOMPLETENESS
0
$0
2
$62,170
5
$98,344
0
$0
0
$0
0
$0
Aggregated Statistics For Year 2004 (Based on 2 partial tracts)
A) FHA, FSA/RHS & VA Home Purchase Loans
B) Conventional Home Purchase Loans
C) Refinancings
D) Home Improvement Loans
F) Non-occupant Loans on < 5 Family Dwellings (A B C & D)
G) Loans On Manufactured Home Dwelling (A B C & D)
Number
Average Value
Number
Average Value
Number
Average Value
Number
Average Value
Number
Average Value
Number
Average Value
LOANS ORIGINATED
4
$76,208
28
$96,999
47
$110,851
15
$43,457
3
$39,313
4
$67,165
APPLICATIONS APPROVED, NOT ACCEPTED
0
$0
2
$106,445
8
$97,450
3
$33,410
0
$0
2
$55,200
APPLICATIONS DENIED
0
$0
9
$89,386
37
$102,245
11
$32,165
2
$43,895
3
$57,650
APPLICATIONS WITHDRAWN
1
$53,130
3
$120,953
24
$94,702
4
$69,802
1
$74,230
1
$93,450
FILES CLOSED FOR INCOMPLETENESS
0
$0
0
$0
6
$142,933
1
$15,070
0
$0
0
$0
Aggregated Statistics For Year 2003 (Based on 2 partial tracts)
A) FHA, FSA/RHS & VA Home Purchase Loans
B) Conventional Home Purchase Loans
C) Refinancings
D) Home Improvement Loans
F) Non-occupant Loans on < 5 Family Dwellings (A B C & D)
Number
Average Value
Number
Average Value
Number
Average Value
Number
Average Value
Number
Average Value
LOANS ORIGINATED
9
$89,679
30
$107,099
115
$101,356
8
$43,615
5
$56,670
APPLICATIONS APPROVED, NOT ACCEPTED
0
$0
2
$75,360
11
$99,544
2
$11,680
1
$48,230
APPLICATIONS DENIED
2
$96,460
12
$57,776
38
$92,961
5
$11,002
2
$32,595
APPLICATIONS WITHDRAWN
2
$68,765
4
$103,620
20
$105,184
1
$7,910
1
$86,290
FILES CLOSED FOR INCOMPLETENESS
0
$0
0
$0
3
$106,510
0
$0
0
$0
Aggregated Statistics For Year 2002 (Based on 2 partial tracts)
A) FHA, FSA/RHS & VA Home Purchase Loans
B) Conventional Home Purchase Loans
C) Refinancings
D) Home Improvement Loans
F) Non-occupant Loans on < 5 Family Dwellings (A B C & D)
Number
Average Value
Number
Average Value
Number
Average Value
Number
Average Value
Number
Average Value
LOANS ORIGINATED
6
$110,842
28
$79,464
76
$98,816
12
$22,388
6
$52,062
APPLICATIONS APPROVED, NOT ACCEPTED
0
$0
5
$77,470
12
$77,464
2
$24,870
0
$0
APPLICATIONS DENIED
1
$71,590
10
$73,288
34
$81,200
3
$29,140
2
$53,880
APPLICATIONS WITHDRAWN
0
$0
2
$105,125
14
$84,753
0
$0
0
$0
FILES CLOSED FOR INCOMPLETENESS
0
$0
2
$82,895
4
$96,742
0
$0
0
$0
Aggregated Statistics For Year 2001 (Based on 2 partial tracts)
A) FHA, FSA/RHS & VA Home Purchase Loans
B) Conventional Home Purchase Loans
C) Refinancings
D) Home Improvement Loans
F) Non-occupant Loans on < 5 Family Dwellings (A B C & D)
Number
Average Value
Number
Average Value
Number
Average Value
Number
Average Value
Number
Average Value
LOANS ORIGINATED
6
$87,292
34
$82,929
75
$83,705
17
$20,569
4
$47,100
APPLICATIONS APPROVED, NOT ACCEPTED
0
$0
7
$53,074
7
$122,191
2
$28,635
1
$21,480
APPLICATIONS DENIED
0
$0
18
$48,084
26
$85,012
3
$7,160
0
$0
APPLICATIONS WITHDRAWN
0
$0
2
$96,650
12
$91,186
0
$0
0
$0
FILES CLOSED FOR INCOMPLETENESS
0
$0
0
$0
3
$169,687
0
$0
0
$0
Aggregated Statistics For Year 2000 (Based on 2 partial tracts)
A) FHA, FSA/RHS & VA Home Purchase Loans
B) Conventional Home Purchase Loans
C) Refinancings
D) Home Improvement Loans
F) Non-occupant Loans on < 5 Family Dwellings (A B C & D)
Number
Average Value
Number
Average Value
Number
Average Value
Number
Average Value
Number
Average Value
LOANS ORIGINATED
5
$54,786
33
$72,654
34
$73,642
10
$23,475
4
$39,000
APPLICATIONS APPROVED, NOT ACCEPTED
2
$39,375
11
$54,602
5
$91,034
2
$18,275
0
$0
APPLICATIONS DENIED
2
$62,925
24
$47,037
20
$49,172
5
$10,248
0
$0
APPLICATIONS WITHDRAWN
1
$44,090
3
$167,800
13
$68,925
2
$14,885
0
$0
FILES CLOSED FOR INCOMPLETENESS
0
$0
0
$0
1
$44,090
0
$0
0
$0
Aggregated Statistics For Year 1999 (Based on 1 partial tract)
A) FHA, FSA/RHS & VA Home Purchase Loans
B) Conventional Home Purchase Loans
C) Refinancings
D) Home Improvement Loans
F) Non-occupant Loans on < 5 Family Dwellings (A B C & D)
Detailed PMIC statistics for the following Tracts:0206.00
2002 - 2018 National Fire Incident Reporting System (NFIRS) incidents
Based on the data from the years 2002 - 2018 the average number of fires per year is 11. The highest number of reported fires - 30 took place in 2005, and the least - 1 in 2012. The data has a dropping trend.
When looking into fire subcategories, the most incidents belonged to: Outside Fires (62.4%), and Structure Fires (22.2%).
Fire incident types reported to NFIRS in Zip Code 67123


 Nearest zip codes: 67144, 67154, 66840, 67017, 67041, 67042.


 Based on the data from the years 2002 - 2018 the average number of fires per year is 11. The highest number of reported fires - 30 took place in 2005, and the least - 1 in 2012. The data has a dropping trend.
 When looking into fire subcategories, the most incidents belonged to: Outside Fires (62.4%), and Structure Fires (22.2%).