Estimated zip code population in 2022: 1,933 Zip code population in 2010: 1,510 Zip code population in 2000: 1,549
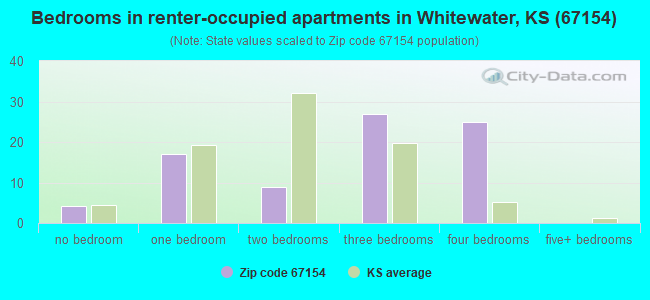
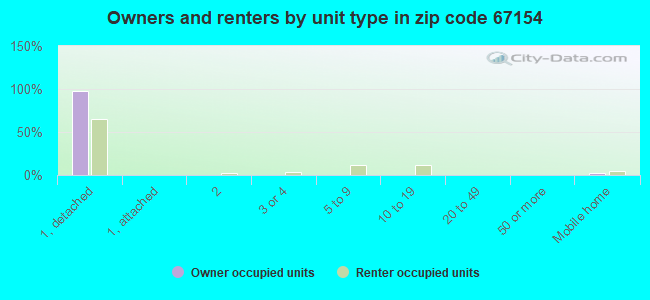
Houses and condos: 678 Renter-occupied apartments: 82
% of renters here:
13%
State:
32%
March 2022 cost of living index in zip code 67154: 79.2 (low, U.S. average is 100)
Land area: 79.0 sq. mi. Water area: 0.0 sq. mi.
Population density: 24 people per square mile
(very low).
OSM Map
General Map
Google Map
MSN Map
OSM Map
General Map
Google Map
MSN Map
OSM Map
General Map
Google Map
MSN Map
OSM Map
General Map
Google Map
MSN Map
Please wait while loading the map...
Real estate property taxes paid for housing units in 2022:
This zip code:
1.5% ($2,047)
Kansas:
1.2% ($2,578)
Median real estate property taxes paid for housing units with mortgages in 2022: $2,518 (1.6%) Median real estate property taxes paid for housing units with no mortgage in 2022: $1,445 (1.3%)
Business Search- 14 Million verified businesses
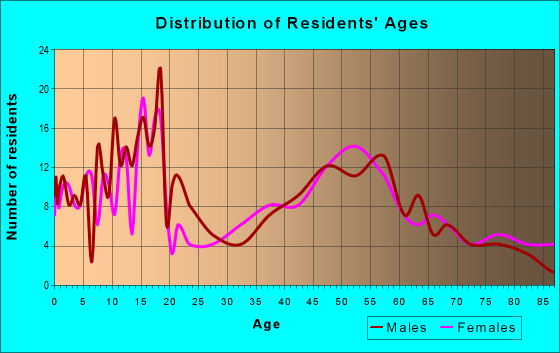
Males: 943
(48.8%)
Females: 990
(51.2%)
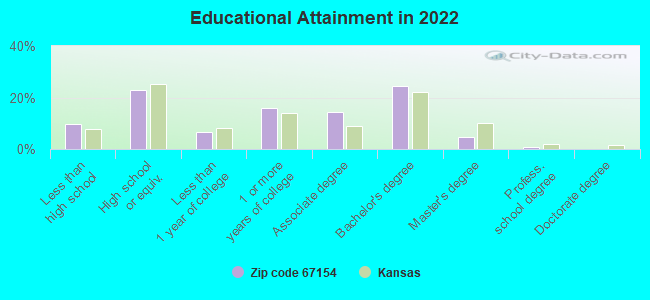
For population 25 years and over in 67154:
High school or higher: 89.3%
Bachelor's degree or higher: 29.7%
Graduate or professional degree: 5.4%
Unemployed: 1.7%
Mean travel time to work (commute): 20.3 minutes
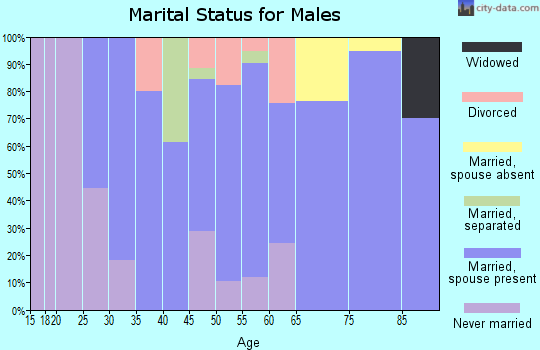
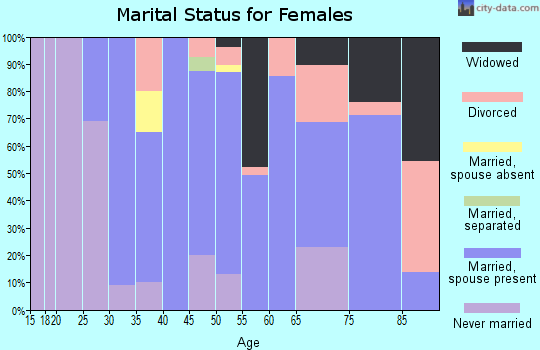
For population 15 years and over in 67154:
Never married: 20.9%
Now married: 57.9%
Separated: 0.2%
Widowed: 15.5%
Divorced: 5.5%
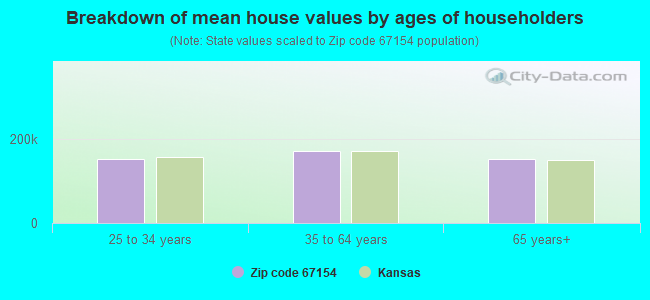
Zip code 67154 compared to state average:
Median house value below state average.
Unemployed percentage below state average.
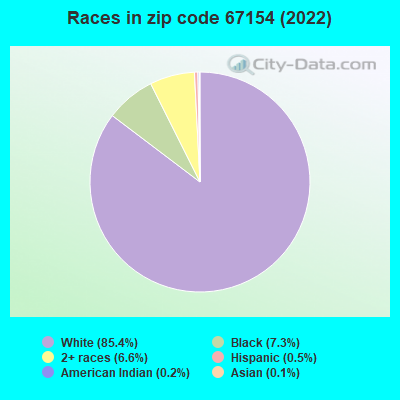
Hispanic race population percentage significantly below state average.
Median age below state average.
Foreign-born population percentage significantly below state average.
Renting percentage significantly below state average.
Length of stay since moving in significantly above state average.
Number of college students significantly below state average.
Estimated median house/condo value in 2022: $132,931
67154:
$132,931
Kansas:
$206,600
According to our research of Kansas and other state lists, there was 1 registered sex offender living in 67154 zip code as of May 20, 2024. The ratio of all residents to sex offenders in zip code 67154 is 1,344 to 1. The ratio of registered sex offenders to all residents in this zip code is much lower than the state average.
Median resident age:
This zip code:
33.5 years
Kansas median age:
37.6 years
Average household size:
This zip code:
2.9 people
Kansas:
2.4 people
Averages for the 2020 tax year for zip code 67154, filed in 2021:
Average Adjusted Gross Income (AGI) in 2020: $68,587 (Individual Income Tax Returns)
Here:
$68,587
State:
$72,721
Salary/wage: $51,553 (reported on 84.1% of returns)
Here:
$51,553
State:
$58,641
(% of AGI for various income ranges: 1440.0% for AGIs below $25k, 4345.6% for AGIs $25k-50k, 8005.7% for AGIs $50k-75k, 13295.0% for AGIs $75k-100k, 21812.0% for AGIs $100k-200k)
Taxable interest for individuals: $1,189 (reported on 44.4% of returns)
This zip code:
$1,189
Kansas:
$1,625
(% of AGI for various income ranges: 14.5% for AGIs below $25k, 15.6% for AGIs $25k-50k, 37.1% for AGIs $50k-75k, 70.0% for AGIs $75k-100k, 394.0% for AGIs $100k-200k)
Ordinary dividends: $2,692 (reported on 20.6% of returns)
Here:
$2,692
State:
$7,290
(% of AGI for various income ranges: 47.8% for AGIs $25k-50k, 55.7% for AGIs $50k-75k, 190.0% for AGIs $75k-100k, 384.0% for AGIs $100k-200k)
Net capital gain/loss in AGI: +$7,262 (reported on 20.6% of returns)
Here:
+$7,262
State:
+$20,511
(% of AGI for various income ranges: 81.8% for AGIs below $25k, 58.6% for AGIs $50k-75k, 420.0% for AGIs $75k-100k, 1290.0% for AGIs $100k-200k)
Profit/loss from business: +$11,033 (reported on 14.3% of returns)
Here:
+$11,033
State:
+$13,852
(% of AGI for various income ranges: 240.9% for AGIs below $25k, 372.9% for AGIs $50k-75k, 934.0% for AGIs $100k-200k)
Taxable individual retirement arrangement distribution: $11,414 (reported on 11.1% of returns)
67154:
$11,414
Kansas:
$19,921
(% of AGI for various income ranges: 618.6% for AGIs $50k-75k, 915.0% for AGIs $75k-100k)
Total itemized deductions: $43,350 (reported on 6.3% of returns)
Here:
$43,350
State:
$36,939
(% of AGI for various income ranges: 890.0% for AGIs $25k-50k, 1866.0% for AGIs $100k-200k)
Charity contributions: $14,300 (reported on 6.3% of returns)
Here:
$14,300
State:
$15,443
(% of AGI for various income ranges: 1430.0% for AGIs $75k-100k)
Taxes paid: $6,200 (reported on 6.3% of returns)
67154:
$6,200
State:
$8,001
(% of AGI for various income ranges: 74.5% for AGIs below $25k, 332.0% for AGIs $100k-200k)
Earned income credit: $1,875 (reported on 12.7% of returns)
Here:
$1,875
State:
$2,267
(% of AGI for various income ranges: 62.7% for AGIs below $25k, 90.0% for AGIs $25k-50k)
Percentage of individuals using paid preparers for their 2020 taxes: 98.4%
Here:
98%
State:
95%
(% for various income ranges: 100.0% for AGIs below $25k, 100.0% for AGIs $25k-50k, 91.7% for AGIs $50k-75k, 100.0% for AGIs $75k-100k, 100.0% for AGIs $100k-200k, 100.0% for AGIs over 200k)
Averages for the 2012 tax year for zip code 67154, filed in 2013:
Average Adjusted Gross Income (AGI) in 2012: $58,768 (Individual Income Tax Returns)
Here:
$58,768
State:
$60,095
Salary/wage: $45,536 (reported on 83.3% of returns)
Here:
$45,536
State:
$48,770
(% of AGI for various income ranges: 74.4% for AGIs below $25k, 77.6% for AGIs $25k-50k, 76.2% for AGIs $50k-75k, 69.9% for AGIs $75k-100k, 85.1% for AGIs $100k-200k)
Taxable interest for individuals: $1,220 (reported on 45.5% of returns)
This zip code:
$1,220
Kansas:
$1,506
(% of AGI for various income ranges: 1.6% for AGIs below $25k, 0.4% for AGIs $25k-50k, 0.8% for AGIs $50k-75k, 0.7% for AGIs $75k-100k, 1.8% for AGIs $100k-200k)
Ordinary dividends: $1,664 (reported on 21.2% of returns)
Here:
$1,664
State:
$6,093
(% of AGI for various income ranges: 1.8% for AGIs below $25k, 0.5% for AGIs $50k-75k, 0.5% for AGIs $75k-100k, 1.0% for AGIs $100k-200k)
Net capital gain/loss in AGI: +$3,473 (reported on 16.7% of returns)
Here:
+$3,473
State:
+$14,598
(% of AGI for various income ranges: 0.5% for AGIs below $25k, 0.1% for AGIs $50k-75k, 3.1% for AGIs $100k-200k)
Profit/loss from business: +$12,227 (reported on 16.7% of returns)
Here:
+$12,227
State:
+$12,554
(% of AGI for various income ranges: 5.3% for AGIs below $25k, 5.5% for AGIs $25k-50k, 6.1% for AGIs $50k-75k, 4.5% for AGIs $100k-200k)
Taxable individual retirement arrangement distribution: $12,133 (reported on 9.1% of returns)
67154:
$12,133
Kansas:
$14,098
Total itemized deductions: $21,470 (20% of AGI, reported on 30.3% of returns)
Here:
$21,470
State:
$23,678
Here:
19.6% of AGI
State:
18.9% of AGI
(% of AGI for various income ranges: 14.3% for AGIs $25k-50k, 8.6% for AGIs $50k-75k, 10.9% for AGIs $75k-100k, 20.4% for AGIs $100k-200k)
Charity contributions: $7,517 (reported on 27.3% of returns)
Here:
$7,517
State:
$5,321
(% of AGI for various income ranges: 3.0% for AGIs below $25k, 3.3% for AGIs $50k-75k, 3.1% for AGIs $75k-100k, 7.2% for AGIs $100k-200k)
Taxes paid: $7,805 (reported on 30.3% of returns)
67154:
$7,805
State:
$9,548
(% of AGI for various income ranges: 2.8% for AGIs $25k-50k, 2.5% for AGIs $50k-75k, 4.2% for AGIs $75k-100k, 8.6% for AGIs $100k-200k)
Earned income credit: $1,714 (reported on 10.6% of returns)
Here:
$1,714
State:
$2,212
(% of AGI for various income ranges: 3.0% for AGIs below $25k, 1.0% for AGIs $25k-50k)
Percentage of individuals using paid preparers for their 2012 taxes: 59.1%
Here:
59%
State:
56%
(% for various income ranges: 50.0% for AGIs below $25k, 50.0% for AGIs $25k-50k, 58.3% for AGIs $50k-75k, 71.4% for AGIs $75k-100k, 100.0% for AGIs $100k-200k)
Averages for the 2004 tax year for zip code 67154, filed in 2005:
Average Adjusted Gross Income (AGI) in 2004: $44,152 (Individual Income Tax Returns)
Here:
$44,152
State:
$45,726
Salary/wage: $40,021 (reported on 85.1% of returns)
Here:
$40,021
State:
$40,112
(% of AGI for various income ranges: 176.7% for AGIs below $10k, 74.8% for AGIs $10k-25k, 77.8% for AGIs $25k-50k, 81.3% for AGIs $50k-75k, 79.4% for AGIs $75k-100k, 67.7% for AGIs over 100k)
Taxable interest for individuals: $900 (reported on 58.7% of returns)
This zip code:
$900
Kansas:
$1,749
(% of AGI for various income ranges: 3.5% for AGIs below $10k, 3.2% for AGIs $10k-25k, 1.6% for AGIs $25k-50k, 0.7% for AGIs $50k-75k, 1.0% for AGIs $75k-100k, 0.8% for AGIs over 100k)
Taxable dividends: $979 (reported on 23.0% of returns)
Here:
$979
State:
$3,066
(% of AGI for various income ranges: 6.3% for AGIs below $10k, 0.7% for AGIs $10k-25k, 0.9% for AGIs $25k-50k, 0.3% for AGIs $50k-75k, 0.1% for AGIs $75k-100k, 0.5% for AGIs over 100k)
Net capital gain/loss: +$2,271 (reported on 22.9% of returns)
Here:
+$2,271
State:
+$7,555
(% of AGI for various income ranges: 4.7% for AGIs below $10k, 1.9% for AGIs $10k-25k, -0.0% for AGIs $25k-50k, 0.8% for AGIs $50k-75k, 0.5% for AGIs $75k-100k, 2.5% for AGIs over 100k)
Profit/loss from business: +$8,091 (reported on 17.5% of returns)
Here:
+$8,091
State:
+$9,571
(% of AGI for various income ranges: 4.2% for AGIs $10k-25k, 5.1% for AGIs $25k-50k, 5.8% for AGIs $50k-75k, 0.1% for AGIs $75k-100k, 1.6% for AGIs over 100k)
Profit/loss from farming: +$1,398 (reported on 14.0% of returns)
Here:
+$1,398
State:
-$2,650
(% of AGI for various income ranges: -15.4% for AGIs below $10k, -1.2% for AGIs $10k-25k, 3.0% for AGIs $25k-50k, 2.3% for AGIs $50k-75k, -2.0% for AGIs $75k-100k)
IRA payment deduction: $3,125 (reported on 3.8% of returns)
67154:
$3,125
Kansas:
$2,922
Total itemized deductions: $18,136 (21% of AGI, reported on 28.1% of returns)
Here:
$18,136
State:
$18,779
Here:
21.3% of AGI
State:
20.5% of AGI
(% of AGI for various income ranges: 7.9% for AGIs $10k-25k, 10.5% for AGIs $25k-50k, 10.2% for AGIs $50k-75k, 13.3% for AGIs $75k-100k, 13.8% for AGIs over 100k)
Charity contributions deductions: $6,500 (7% of AGI, reported on 25.1% of returns)
Here:
$6,500
State:
$3,892
Here:
7.5% of AGI
State:
4.0% of AGI
(% of AGI for various income ranges: 7.9% for AGIs below $10k, 2.1% for AGIs $25k-50k, 3.0% for AGIs $50k-75k, 3.3% for AGIs $75k-100k, 6.6% for AGIs over 100k)
Total tax: $6,115 (reported on 78.7% of returns)
67154:
$6,115
State:
$7,203
(% of AGI for various income ranges: 11.6% for AGIs below $10k, 5.0% for AGIs $10k-25k, 7.4% for AGIs $25k-50k, 8.2% for AGIs $50k-75k, 11.0% for AGIs $75k-100k, 17.3% for AGIs over 100k)
Earned income credit: $1,812 (reported on 7.6% of returns)
Here:
$1,812
State:
$1,674
Percentage of individuals using paid preparers for their 2004 taxes: 64.4%
Here:
64%
State:
63%
(% for various income ranges: 66.2% for AGIs below $10k, 61.9% for AGIs $10k-25k, 66.2% for AGIs $25k-50k, 57.5% for AGIs $50k-75k, 69.2% for AGIs $75k-100k, 71.7% for AGIs over 100k)
Household received Food Stamps/SNAP in the past 12 months: 7 Household did not receive Food Stamps/SNAP in the past 12 months: 642
Women who had a birth in the past 12 months: 44 (41 now married, 2 unmarried) Women who did not have a birth in the past 12 months: 255 (179 now married, 74 unmarried)
Housing units in zip code 67154 with a mortgage: 230 (3 second mortgage) Houses without a mortgage: 13
Median monthly owner costs for units with a mortgage: $1,375 Median monthly owner costs for units without a mortgage: $334
Residents with income below the poverty level in 2022:
This zip code:
5.5%
Whole state:
12.0%
Residents with income below 50% of the poverty level in 2022:
This zip code:
3.8%
Whole state:
6.4%
Median number of rooms in houses and condos:
Here:
7.3
State:
6.9
Median number of rooms in apartments:
Here:
6.4
State:
4.4
Notable locations in this zip code not listed on our city pages
Notable locations in zip code 67154: Whitewater Wastewater Plant (A), Team Marketing Alliance Grain Elevator Number 37 (B), Whitewater River Consolidated Fire District - Whitewater Station (C), Whitewater Memorial Library (D), Whitewater City Hall (E). Display/hide their locations on the map
Churches in zip code 67154 include: Federated Church (A), Grace Baptist Church (B), Swiss Church (C), Emmaus Mennonite Church (D). Display/hide their locations on the map
Creeks: Deer Creek (A), Swenson Creek (B), Henry Creek (C), Dry Creek (D), East Branch Whitewater Creek (E), West Branch Whitewater Creek (F). Display/hide their locations on the map
In group quarters: 48 (-1 institutionalized population)
Size of family households: 161 2-persons, 40 3-persons, 130 4-persons, 24 5-persons, 14 6-persons, 65 7-or-more-persons
Size of nonfamily households: 176 1-person, 35 2-persons
589 married couples with children.
12 single-parent households (5 men, 7 women).
99.2% of residents of 67154 zip code speak English at home.
0.4% of residents speak Spanish at home (71% very well, 29% well).
0.4% of residents speak other Indo-European language at home (43% very well, 57% well).
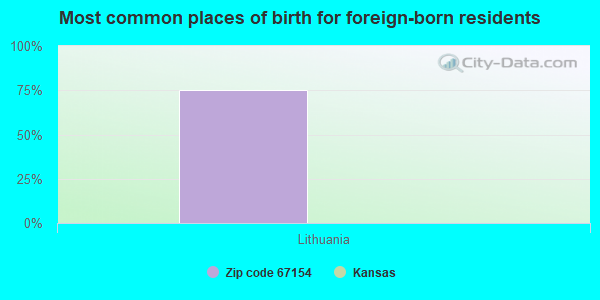
Foreign born population: 8 (0.4%) (0.0% of them are naturalized citizens)
:
0.4%
Whole state:
7.1%
75%Lithuania
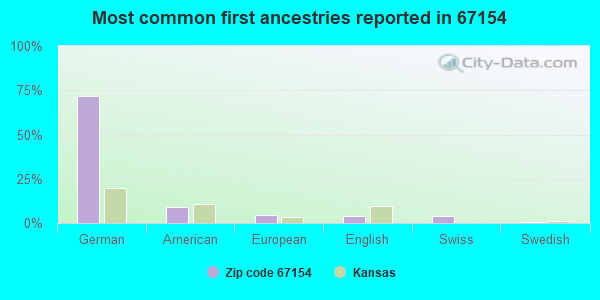
72%German
9%American
4%European
4%English
4%Swiss
1%Swedish
1%Dutch
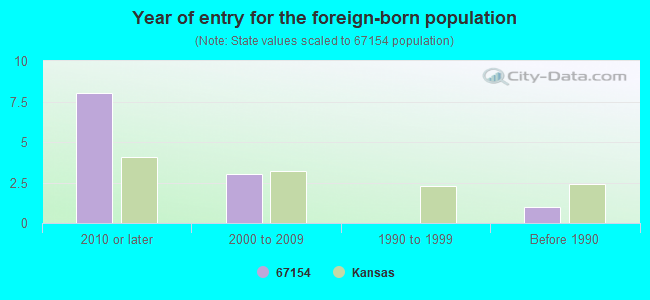
Year of entry for the foreign-born population
82010 or later
32000 to 2009
01990 to 1999
1Before 1990
Facilities with environmental interests located in this zip code:
MID KANSAS COOP ASSN - WHITEWATE (223 SOUTH ASH in WHITEWATER, KS)
AIR MINOR (AIRS/AFS) STATE MASTER (Kansas Facility Profiler) - RTK-BU00982, EPCRA COMPLIANCE ACTIVITY (Tracking inspections of insecticide, fungicide, and rodenticide, and toxic substances) Business SIC classification: GRAIN AND FIELD BEANS Organizations: MID-KANSAS COOP ASSN Alternative names: FARMERS COOP GRAIN COMPANY, FARMERS GRAIN COOPERATIVE, WHITEWATER MILL INC
STATE MASTER (Kansas Facility Profiler) - TANKS-05782, UNDERGROUND STORAGE TANK PROGRAM, TANKS-43565, WWT-M-WA21-NO01, WASTEWATER FACILITY National Pollutant Discharge Elimination System NON-MAJOR (Tracking pollutant discharge elimination systems) - permit Business SIC classification: ELEMENTARY AND SECONDARY SCHOOLS Organizations: USD #206 FREDERIC REMINGTON HI (CONTACT/OWNER)
, EPP, VIRGIL (EPP S SERVICE IN (OWNER/OPERATOR)
Alternative names: FREDERIC REMINGTON HIGH, REMINGTON HIGH SCHOOL, REMINGTON HIGH SCHOOL USD 206, UNIFIED SCHOOL DISTRICT_#206, USD #206 FREDERIC REMINGTON HI
CLAASSEN, JOHN (11239 NORTHWEST MEADOWLARK ROAD in WHITEWATER, KS)
STATE MASTER (Kansas Facility Profiler) - CAFO-07262, LIVE STOCK WASTE CONTROL National Pollutant Discharge Elimination System NON-MAJOR (Tracking pollutant discharge elimination systems) - permit Business SIC classification: HOGS Alternative names: JOHN CLAASSEN
WIEBE, WILLARD (16265 NORTHWEST STATE ROAD 196 in WHITEWATER, KS)
STATE MASTER (Kansas Facility Profiler) - CAFO-07291, LIVE STOCK WASTE CONTROL National Pollutant Discharge Elimination System NON-MAJOR (Tracking pollutant discharge elimination systems) - permit Business SIC classification: HOGS Alternative names: WILLARD WIEBE
WHEAT STATE MANOR INC (601 S MAIN in WHITEWATER, KS)
(Resource Conservation and Recovery Act (tracking hazardous waste))
WHITEWATER WASTEWATER PLANT ( in WHITEWATER, KS)
National Pollutant Discharge Elimination System NON-MAJOR (Tracking pollutant discharge elimination systems) - permit Business SIC classification: SEWERAGE SYSTEMS Organizations: WHITEWATER, CITY OF (CONTACT/OWNER)
Alternative names: WHITEWATER, CITY OF
KANSAS CROP SVC (BOX 131 in WHITEWATER, KS)
(Resource Conservation and Recovery Act (tracking hazardous waste)) Organizations: KANSAS CROP SERVICE (CONTACT/OWNER)
WALTER PENNER (RURAL ROUTE 1 in WHITEWATER, KS)
National Pollutant Discharge Elimination System NON-MAJOR (Tracking pollutant discharge elimination systems) - permit Business SIC classification: HOGS Alternative names: PENNER, WALTER
WHITEWATER FEEDER PIG (12418 NORTHWEST 100TH STREET in WHITEWATER, KS)
National Pollutant Discharge Elimination System NON-MAJOR (Tracking pollutant discharge elimination systems) - permit Business SIC classification: HOGS
WHITEWATER SVC CTR (221 S MAIN in WHITEWATER, KS)
Conditionally Exempt Small Quantity Generators, less than 100 kg/month of hazardous waste (Resource Conservation and Recovery Act (tracking hazardous waste)) - notification Organizations: KENNY DENT (CONTACT/OWNER)
MILLER BROS EQUIPMENT CO (109 S MAIN in WHITEWATER, KS)
Conditionally Exempt Small Quantity Generators, less than 100 kg/month of hazardous waste (Resource Conservation and Recovery Act (tracking hazardous waste)) - notification Organizations: A B NEUMAN (CONTACT/OWNER)
CHEM-TECH INC (BOX 161 in WHITEWATER, KS)
COMPLIANCE ACTIVITY (Tracking inspections of insecticide, fungicide, and rodenticide, and toxic substances)
Housing units lacking complete plumbing facilities: 0.5%
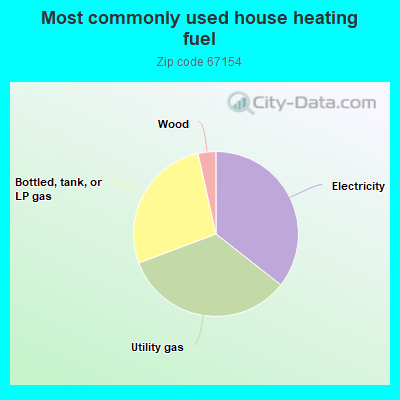
35.7%Electricity
33.8%Utility gas
27.3%Bottled, tank, or LP gas
3.5%Wood
Population in 1990: 1,100. Population change in the 1990s: +449 (+40.8%).
Place of birth for U.S.-born residents:
This state: 1,468
Northeast: 28
Midwest: 156
South: 108
West: 163
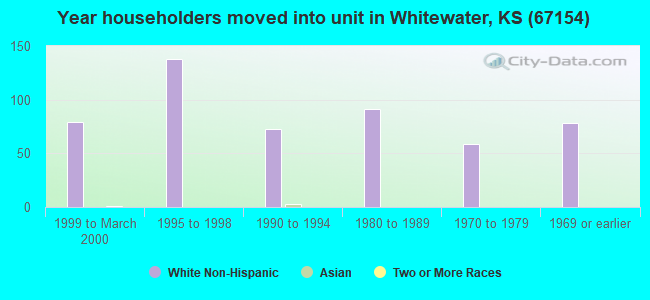
63% of the 67154 zip code residents lived in the same house 5 years ago. Out of people who lived in different houses, 31% lived in this county. Out of people who lived in different counties, 50% lived in Kansas.
95% of the 67154 zip code residents lived in the same house 1 year ago. Out of people who lived in different houses, 54% moved from this county. Out of people who lived in different houses, 56% moved from different county within same state.
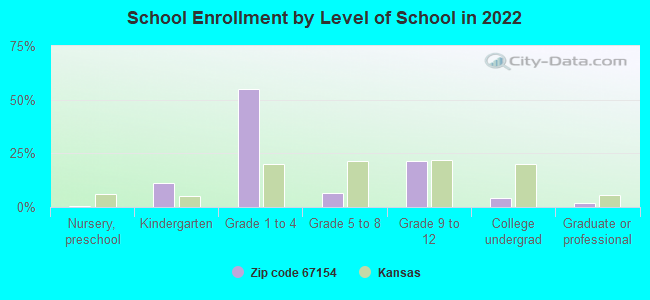
Private vs. public school enrollment:
Students in private schools in grades 1 to 8 (elementary and middle school): 246
Here:
87.4%
Kansas:
14.1%
Students in private schools in grades 9 to 12 (high school): 5
Here:
6.7%
Kansas:
10.8%
Students in private undergraduate colleges: 4
Here:
30.9%
Kansas:
15.4%
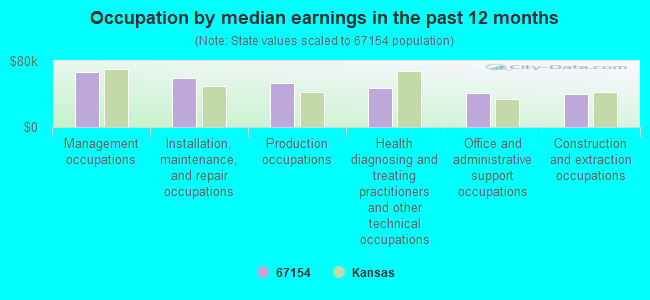
Occupation by median earnings in the past 12 months ($)
66,208Management occupations
58,822Installation, maintenance, and repair occupations
53,431Production occupations
47,142Health diagnosing and treating practitioners and other technical occupations
40,910Office and administrative support occupations
39,806Construction and extraction occupations
Companies with federal contracts located in this zip code:
ARC TECHNOLOGY (12978 NW 90TH ST in WHITEWATER, KS; small business) : $819,729 in 4 contractsfrom 2003 to 2005
$299,788 with Army for Defense Missile and Space Systems -- Advanced Development (R&D). Signed on 2004-03-24. Completion date: 2005-04-25.
$250,000, same as above.Signed on 2003-11-13. Completion date: 2005-04-25.
$200,000, same as above.Signed on 2003-04-25. Completion date: 2005-04-25.
$69,941, same as above.Signed on 2005-12-22. Completion date: 2006-06-22.
APPLIED PHYSICAL ELECTRONICS, (12978 NW 90TH STREET in WHITEWATER, KS; small business) : $695,988 in 8 contractsfrom 2000 to 2002
Contracts for Defense Missile and Space Systems -- Advanced Development (R&D) by Army Signed by year:2000: $278,343; 2001: $144,696; 2002: $272,949; 2003: $0; 2004: $0; 2005: $0; 2006: $0.
Biggest contracts:
$210,000 with Army for Defense Missile and Space Systems -- Advanced Development (R&D). Signed on 2000-11-15. Completion date: 2002-11-05.
$75,112, same as above.Signed on 2001-05-03. Completion date: 2001-09-09.
$69,584, same as above.Signed on 2001-05-08. Completion date: 2001-11-07.
$69,557, same as above.Signed on 2002-05-01. Completion date: 2002-11-01.
RAVENSCRAFT IMPLEMENT INC (223 S MAIN ST in WHITEWATER, KS; small business) : $76,075 in 2 contractsin 2004
$41,870 with Army for Tractors, Wheeled. Signed on 2004-06-29. Completion date: 2004-07-29.
$34,205, same as above.Signed on 2004-08-14. Completion date: 2004-08-27.
Top industries in this zip code by the number of employees in 2005:
Health Care and Social Assistance: Nursing Care Facilities (100-249 employees: 1 establishment)
Other Services (except Public Administration): Religious Organizations (5-9: 1, 1-4: 1)
Finance and Insurance: Commercial Banking (5-9: 1)
Accommodation and Food Services: Full-Service Restaurants (5-9: 1)
Health Care and Social Assistance: Offices of Physical, Occupational and Speech Therapists, and Audiologists (5-9: 1)
Other Services (except Public Administration): General Automotive Repair (5-9: 1)
Professional, Scientific, and Technical Services: Veterinary Services (5-9: 1)
People in group quarters in 2010:
57 people in nursing facilities/skilled-nursing facilities
People in group quarters in 2000:
66 people in nursing homes
Fatal accident statistics in 2010:
Fatal accident count: 1
Vehicles involved in fatal accidents: 1
Fatal accidents caused by drunken drivers: 0
Fatalities: 1
Persons involved in fatal accidents: 1
Pedestrians involved in fatal accidents: 0
Home Mortgage Disclosure Act Aggregated Statistics For Year 2009 (Based on 2 partial tracts)
A) FHA, FSA/RHS & VA Home Purchase Loans
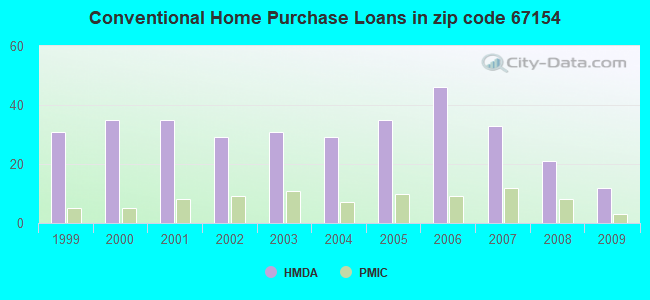
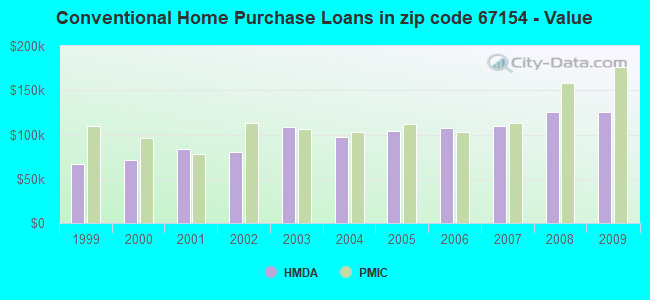
B) Conventional Home Purchase Loans
C) Refinancings
D) Home Improvement Loans
F) Non-occupant Loans on < 5 Family Dwellings (A B C & D)
G) Loans On Manufactured Home Dwelling (A B C & D)
Number
Average Value
Number
Average Value
Number
Average Value
Number
Average Value
Number
Average Value
Number
Average Value
LOANS ORIGINATED
11
$117,364
12
$125,662
57
$138,812
13
$56,138
4
$54,135
5
$78,364
APPLICATIONS APPROVED, NOT ACCEPTED
0
$0
1
$91,960
4
$100,608
2
$8,645
0
$0
2
$38,315
APPLICATIONS DENIED
4
$93,632
4
$114,265
25
$146,274
3
$49,257
2
$71,330
4
$96,775
APPLICATIONS WITHDRAWN
2
$108,860
2
$108,470
9
$140,039
1
$95,890
0
$0
1
$70,350
FILES CLOSED FOR INCOMPLETENESS
0
$0
0
$0
2
$89,605
0
$0
0
$0
0
$0
Aggregated Statistics For Year 2008 (Based on 2 partial tracts)
A) FHA, FSA/RHS & VA Home Purchase Loans
B) Conventional Home Purchase Loans
C) Refinancings
D) Home Improvement Loans
F) Non-occupant Loans on < 5 Family Dwellings (A B C & D)
G) Loans On Manufactured Home Dwelling (A B C & D)
Number
Average Value
Number
Average Value
Number
Average Value
Number
Average Value
Number
Average Value
Number
Average Value
LOANS ORIGINATED
8
$100,706
21
$125,142
42
$119,902
18
$34,060
7
$70,853
7
$63,049
APPLICATIONS APPROVED, NOT ACCEPTED
1
$84,890
3
$115,803
5
$121,752
2
$16,505
1
$56,980
2
$51,875
APPLICATIONS DENIED
2
$67,205
7
$81,800
20
$115,031
9
$63,273
2
$41,460
5
$61,308
APPLICATIONS WITHDRAWN
1
$59,340
4
$132,540
10
$143,681
1
$16,110
1
$86,850
2
$59,345
FILES CLOSED FOR INCOMPLETENESS
0
$0
0
$0
1
$157,590
0
$0
0
$0
0
$0
Aggregated Statistics For Year 2007 (Based on 2 partial tracts)
A) FHA, FSA/RHS & VA Home Purchase Loans
B) Conventional Home Purchase Loans
C) Refinancings
D) Home Improvement Loans
F) Non-occupant Loans on < 5 Family Dwellings (A B C & D)
G) Loans On Manufactured Home Dwelling (A B C & D)
Number
Average Value
Number
Average Value
Number
Average Value
Number
Average Value
Number
Average Value
Number
Average Value
LOANS ORIGINATED
4
$130,083
33
$109,409
36
$108,315
13
$50,334
5
$73,726
3
$53,973
APPLICATIONS APPROVED, NOT ACCEPTED
0
$0
4
$203,575
4
$74,178
3
$52,270
0
$0
2
$47,555
APPLICATIONS DENIED
1
$197,290
10
$91,569
24
$148,669
8
$43,426
3
$67,727
4
$48,830
APPLICATIONS WITHDRAWN
1
$196,110
2
$179,600
8
$134,750
0
$0
0
$0
0
$0
FILES CLOSED FOR INCOMPLETENESS
0
$0
2
$127,530
4
$139,318
0
$0
0
$0
0
$0
Aggregated Statistics For Year 2006 (Based on 2 partial tracts)
A) FHA, FSA/RHS & VA Home Purchase Loans
B) Conventional Home Purchase Loans
C) Refinancings
D) Home Improvement Loans
F) Non-occupant Loans on < 5 Family Dwellings (A B C & D)
G) Loans On Manufactured Home Dwelling (A B C & D)
Number
Average Value
Number
Average Value
Number
Average Value
Number
Average Value
Number
Average Value
Number
Average Value
LOANS ORIGINATED
4
$107,290
46
$107,716
50
$109,867
16
$22,474
6
$68,513
4
$57,672
APPLICATIONS APPROVED, NOT ACCEPTED
0
$0
6
$84,363
9
$82,006
1
$66,020
2
$82,925
3
$75,457
APPLICATIONS DENIED
1
$72,310
14
$82,811
29
$78,952
8
$30,900
2
$81,545
5
$60,994
APPLICATIONS WITHDRAWN
0
$0
6
$63,993
17
$105,971
1
$23,580
0
$0
0
$0
FILES CLOSED FOR INCOMPLETENESS
1
$58,950
1
$93,140
3
$75,063
0
$0
0
$0
0
$0
Aggregated Statistics For Year 2005 (Based on 2 partial tracts)
A) FHA, FSA/RHS & VA Home Purchase Loans
B) Conventional Home Purchase Loans
C) Refinancings
D) Home Improvement Loans
F) Non-occupant Loans on < 5 Family Dwellings (A B C & D)
G) Loans On Manufactured Home Dwelling (A B C & D)
Number
Average Value
Number
Average Value
Number
Average Value
Number
Average Value
Number
Average Value
Number
Average Value
LOANS ORIGINATED
4
$109,352
35
$104,358
48
$102,966
18
$36,003
7
$62,150
6
$48,012
APPLICATIONS APPROVED, NOT ACCEPTED
0
$0
4
$84,102
8
$92,945
2
$44,210
0
$0
2
$31,045
APPLICATIONS DENIED
2
$86,460
9
$91,918
35
$83,125
6
$50,238
2
$165,650
3
$47,553
APPLICATIONS WITHDRAWN
0
$0
7
$96,229
26
$100,155
2
$87,440
2
$80,960
2
$33,995
FILES CLOSED FOR INCOMPLETENESS
0
$0
2
$64,845
5
$102,572
0
$0
0
$0
0
$0
Aggregated Statistics For Year 2004 (Based on 2 partial tracts)
A) FHA, FSA/RHS & VA Home Purchase Loans
B) Conventional Home Purchase Loans
C) Refinancings
D) Home Improvement Loans
F) Non-occupant Loans on < 5 Family Dwellings (A B C & D)
G) Loans On Manufactured Home Dwelling (A B C & D)
Number
Average Value
Number
Average Value
Number
Average Value
Number
Average Value
Number
Average Value
Number
Average Value
LOANS ORIGINATED
4
$79,485
29
$97,681
50
$108,680
16
$42,493
3
$41,003
4
$70,052
APPLICATIONS APPROVED, NOT ACCEPTED
0
$0
2
$111,020
8
$101,640
4
$26,135
0
$0
2
$57,575
APPLICATIONS DENIED
0
$0
9
$93,228
39
$101,172
12
$30,752
2
$45,785
4
$45,098
APPLICATIONS WITHDRAWN
1
$55,410
3
$126,153
25
$94,823
4
$72,802
1
$77,420
1
$97,460
FILES CLOSED FOR INCOMPLETENESS
0
$0
0
$0
7
$127,781
1
$15,720
0
$0
0
$0
Aggregated Statistics For Year 2003 (Based on 2 partial tracts)
A) FHA, FSA/RHS & VA Home Purchase Loans
B) Conventional Home Purchase Loans
C) Refinancings
D) Home Improvement Loans
F) Non-occupant Loans on < 5 Family Dwellings (A B C & D)
Number
Average Value
Number
Average Value
Number
Average Value
Number
Average Value
Number
Average Value
LOANS ORIGINATED
9
$93,534
31
$108,100
119
$102,160
8
$45,490
6
$49,257
APPLICATIONS APPROVED, NOT ACCEPTED
0
$0
2
$78,600
11
$103,824
2
$12,185
1
$50,300
APPLICATIONS DENIED
2
$100,610
12
$60,260
39
$94,471
5
$11,476
2
$33,995
APPLICATIONS WITHDRAWN
2
$71,720
4
$108,075
20
$109,706
1
$8,250
1
$90,000
FILES CLOSED FOR INCOMPLETENESS
0
$0
0
$0
4
$83,315
0
$0
0
$0
Aggregated Statistics For Year 2002 (Based on 2 partial tracts)
A) FHA, FSA/RHS & VA Home Purchase Loans
B) Conventional Home Purchase Loans
C) Refinancings
D) Home Improvement Loans
F) Non-occupant Loans on < 5 Family Dwellings (A B C & D)
Number
Average Value
Number
Average Value
Number
Average Value
Number
Average Value
Number
Average Value
LOANS ORIGINATED
7
$99,091
29
$80,023
80
$97,911
13
$21,555
6
$54,300
APPLICATIONS APPROVED, NOT ACCEPTED
0
$0
5
$80,800
12
$80,794
2
$25,940
0
$0
APPLICATIONS DENIED
1
$74,670
11
$69,489
35
$82,272
3
$30,393
2
$56,200
APPLICATIONS WITHDRAWN
0
$0
2
$109,645
14
$88,397
0
$0
0
$0
FILES CLOSED FOR INCOMPLETENESS
0
$0
2
$86,460
4
$100,902
0
$0
0
$0
Aggregated Statistics For Year 2001 (Based on 2 partial tracts)
A) FHA, FSA/RHS & VA Home Purchase Loans
B) Conventional Home Purchase Loans
C) Refinancings
D) Home Improvement Loans
F) Non-occupant Loans on < 5 Family Dwellings (A B C & D)
Number
Average Value
Number
Average Value
Number
Average Value
Number
Average Value
Number
Average Value
LOANS ORIGINATED
7
$78,039
35
$84,023
79
$82,883
18
$20,261
4
$49,125
APPLICATIONS APPROVED, NOT ACCEPTED
0
$0
7
$55,357
7
$127,444
2
$29,870
1
$22,400
APPLICATIONS DENIED
0
$0
19
$47,512
27
$85,383
4
$5,600
0
$0
APPLICATIONS WITHDRAWN
0
$0
2
$100,805
13
$87,790
0
$0
0
$0
FILES CLOSED FOR INCOMPLETENESS
0
$0
0
$0
4
$132,735
0
$0
0
$0
Aggregated Statistics For Year 2000 (Based on 2 partial tracts)
A) FHA, FSA/RHS & VA Home Purchase Loans
B) Conventional Home Purchase Loans
C) Refinancings
D) Home Improvement Loans
F) Non-occupant Loans on < 5 Family Dwellings (A B C & D)
Number
Average Value
Number
Average Value
Number
Average Value
Number
Average Value
Number
Average Value
LOANS ORIGINATED
5
$57,142
35
$71,447
35
$74,614
11
$22,258
4
$40,675
APPLICATIONS APPROVED, NOT ACCEPTED
2
$41,070
11
$56,949
5
$94,948
2
$19,060
0
$0
APPLICATIONS DENIED
2
$65,630
25
$47,097
21
$48,844
5
$10,690
0
$0
APPLICATIONS WITHDRAWN
1
$45,980
4
$131,262
13
$71,888
2
$15,525
0
$0
FILES CLOSED FOR INCOMPLETENESS
0
$0
0
$0
1
$45,980
0
$0
0
$0
Aggregated Statistics For Year 1999 (Based on 1 partial tract)
A) FHA, FSA/RHS & VA Home Purchase Loans
B) Conventional Home Purchase Loans
C) Refinancings
D) Home Improvement Loans
F) Non-occupant Loans on < 5 Family Dwellings (A B C & D)
Detailed PMIC statistics for the following Tracts:0206.00
2002 - 2018 National Fire Incident Reporting System (NFIRS) incidents
According to the data from the years 2002 - 2018 the average number of fires per year is 18. The highest number of fires - 56 took place in 2006, and the least - 1 in 2011. The data has a dropping trend.
When looking into fire subcategories, the most reports belonged to: Outside Fires (64.6%), and Structure Fires (22.3%).
Fire incident types reported to NFIRS in Zip Code 67154


+$1,398
-$2,650
(% of AGI for various income ranges: -15.4% for AGIs below $10k, -1.2% for AGIs $10k-25k, 3.0% for AGIs $25k-50k, 2.3% for AGIs $50k-75k, -2.0% for AGIs $75k-100k) Nearest zip codes: 67041, 67123, 67017, 67114, 66866, 67144.
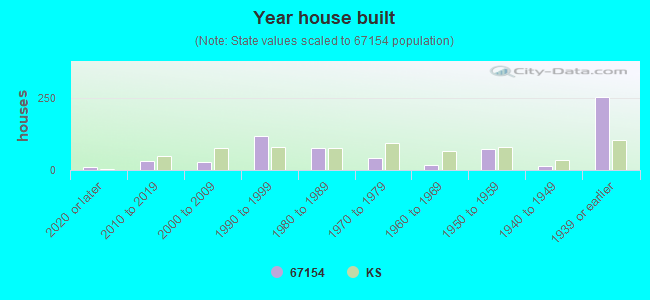


 According to the data from the years 2002 - 2018 the average number of fires per year is 18. The highest number of fires - 56 took place in 2006, and the least - 1 in 2011. The data has a dropping trend.
 When looking into fire subcategories, the most reports belonged to: Outside Fires (64.6%), and Structure Fires (22.3%).