Estimated zip code population in 2022: 1,972 Zip code population in 2010: 1,495 Zip code population in 2000: 1,340
Houses and condos: 811 Renter-occupied apartments: 47
% of renters here:
6%
State:
34%
March 2022 cost of living index in zip code 68317: 76.3 (low, U.S. average is 100)
Land area: 44.8 sq. mi. Water area: 0.0 sq. mi.
Population density: 44 people per square mile
(very low).
OSM Map
General Map
Google Map
MSN Map
OSM Map
General Map
Google Map
MSN Map
OSM Map
General Map
Google Map
MSN Map
OSM Map
General Map
Google Map
MSN Map
Please wait while loading the map...
Real estate property taxes paid for housing units in 2022:
This zip code:
1.3% ($3,778)
Nebraska:
1.4% ($3,313)
Median real estate property taxes paid for housing units with mortgages in 2022: $3,628 (1.2%) Median real estate property taxes paid for housing units with no mortgage in 2022: $4,238 (1.5%)
Estimated median house/condo value in 2022: $293,552
68317:
$293,552
Nebraska:
$232,400
According to our research of Nebraska and other state lists, there were 2 registered sex offenders living in 68317 zip code as of May 23, 2024. The ratio of all residents to sex offenders in zip code 68317 is 892 to 1. The ratio of registered sex offenders to all residents in this zip code is lower than the state average.
Median resident age:
This zip code:
44.8 years
Nebraska median age:
37.4 years
Average household size:
This zip code:
2.4 people
Nebraska:
2.4 people
Averages for the 2020 tax year for zip code 68317, filed in 2021:
Average Adjusted Gross Income (AGI) in 2020: $97,276 (Individual Income Tax Returns)
Here:
$97,276
State:
$73,874
Salary/wage: $73,199 (reported on 83.1% of returns)
Here:
$73,199
State:
$58,268
(% of AGI for various income ranges: 1047.7% for AGIs below $25k, 3060.8% for AGIs $25k-50k, 6050.0% for AGIs $50k-75k, 8841.1% for AGIs $75k-100k, 15400.7% for AGIs $100k-200k)
Taxable interest for individuals: $1,877 (reported on 49.4% of returns)
This zip code:
$1,877
Nebraska:
$1,748
(% of AGI for various income ranges: 18.5% for AGIs below $25k, 46.2% for AGIs $25k-50k, 99.0% for AGIs $50k-75k, 85.6% for AGIs $75k-100k, 152.0% for AGIs $100k-200k)
Ordinary dividends: $3,746 (reported on 27.0% of returns)
Here:
$3,746
State:
$7,841
(% of AGI for various income ranges: 28.5% for AGIs below $25k, 131.5% for AGIs $25k-50k, 130.0% for AGIs $50k-75k, 91.1% for AGIs $75k-100k, 99.3% for AGIs $100k-200k)
Net capital gain/loss in AGI: +$18,958 (reported on 27.0% of returns)
Here:
+$18,958
State:
+$21,703
(% of AGI for various income ranges: 41.5% for AGIs below $25k, 59.2% for AGIs $25k-50k, 126.0% for AGIs $50k-75k, 314.4% for AGIs $75k-100k, 278.7% for AGIs $100k-200k)
Profit/loss from business: +$10,912 (reported on 19.1% of returns)
Here:
+$10,912
State:
+$11,239
(% of AGI for various income ranges: 177.7% for AGIs below $25k, 796.0% for AGIs $50k-75k, 505.3% for AGIs $100k-200k)
Taxable individual retirement arrangement distribution: $17,436 (reported on 12.4% of returns)
68317:
$17,436
Nebraska:
$18,251
(% of AGI for various income ranges: 70.8% for AGIs below $25k, 236.9% for AGIs $25k-50k, 670.0% for AGIs $50k-75k, 565.3% for AGIs $100k-200k)
Total itemized deductions: $31,900 (reported on 11.2% of returns)
Here:
$31,900
State:
$37,704
(% of AGI for various income ranges: 755.0% for AGIs $50k-75k, 750.0% for AGIs $100k-200k)
Charity contributions: $14,600 (reported on 9.0% of returns)
Here:
$14,600
State:
$15,251
(% of AGI for various income ranges: 305.3% for AGIs $100k-200k)
Taxes paid: $7,940 (reported on 11.2% of returns)
68317:
$7,940
State:
$8,015
(% of AGI for various income ranges: 136.9% for AGIs $25k-50k, 230.0% for AGIs $100k-200k)
Earned income credit: $2,183 (reported on 6.7% of returns)
Here:
$2,183
State:
$2,260
(% of AGI for various income ranges: 66.2% for AGIs below $25k, 34.6% for AGIs $25k-50k)
Percentage of individuals using paid preparers for their 2020 taxes: 96.6%
Here:
97%
State:
95%
(% for various income ranges: 95.0% for AGIs below $25k, 93.8% for AGIs $25k-50k, 100.0% for AGIs $50k-75k, 100.0% for AGIs $75k-100k, 95.5% for AGIs $100k-200k, 100.0% for AGIs over 200k)
Averages for the 2012 tax year for zip code 68317, filed in 2013:
Average Adjusted Gross Income (AGI) in 2012: $71,587 (Individual Income Tax Returns)
Here:
$71,587
State:
$60,572
Salary/wage: $52,548 (reported on 83.1% of returns)
Here:
$52,548
State:
$47,046
(% of AGI for various income ranges: 70.4% for AGIs below $25k, 71.7% for AGIs $25k-50k, 84.6% for AGIs $50k-75k, 77.9% for AGIs $75k-100k, 69.5% for AGIs $100k-200k, 25.1% for AGIs over 200k)
Taxable interest for individuals: $1,257 (reported on 44.6% of returns)
This zip code:
$1,257
Nebraska:
$1,535
(% of AGI for various income ranges: 1.1% for AGIs below $25k, 1.1% for AGIs $25k-50k, 0.3% for AGIs $50k-75k, 0.8% for AGIs $75k-100k, 0.3% for AGIs $100k-200k, 1.2% for AGIs over 200k)
Ordinary dividends: $2,695 (reported on 24.1% of returns)
Here:
$2,695
State:
$5,776
(% of AGI for various income ranges: 1.1% for AGIs below $25k, 0.6% for AGIs $25k-50k, 0.4% for AGIs $50k-75k, 0.8% for AGIs $75k-100k, 2.6% for AGIs $100k-200k)
Net capital gain/loss in AGI: +$11,025 (reported on 19.3% of returns)
Here:
+$11,025
State:
+$16,171
(% of AGI for various income ranges: 0.2% for AGIs below $25k, 0.3% for AGIs $25k-50k, 0.7% for AGIs $50k-75k, 0.1% for AGIs $75k-100k, 12.2% for AGIs $100k-200k)
Profit/loss from business: +$13,283 (reported on 21.7% of returns)
Here:
+$13,283
State:
+$9,897
(% of AGI for various income ranges: 9.9% for AGIs below $25k, 8.5% for AGIs $25k-50k, 3.5% for AGIs $50k-75k, 3.6% for AGIs $75k-100k, 6.3% for AGIs $100k-200k)
Taxable individual retirement arrangement distribution: $10,300 (reported on 9.6% of returns)
68317:
$10,300
Nebraska:
$12,804
(% of AGI for various income ranges: 3.4% for AGIs below $25k, 4.0% for AGIs $25k-50k, 4.4% for AGIs $75k-100k)
Total itemized deductions: $23,146 (19% of AGI, reported on 42.2% of returns)
Here:
$23,146
State:
$23,343
Here:
19.3% of AGI
State:
18.7% of AGI
(% of AGI for various income ranges: 13.9% for AGIs below $25k, 14.2% for AGIs $25k-50k, 12.2% for AGIs $50k-75k, 13.0% for AGIs $75k-100k, 15.4% for AGIs $100k-200k, 13.0% for AGIs over 200k)
Charity contributions: $5,122 (reported on 32.5% of returns)
Here:
$5,122
State:
$4,921
(% of AGI for various income ranges: 2.0% for AGIs $25k-50k, 1.5% for AGIs $50k-75k, 1.5% for AGIs $75k-100k, 2.5% for AGIs $100k-200k, 3.7% for AGIs over 200k)
Taxes paid: $8,769 (reported on 42.2% of returns)
68317:
$8,769
State:
$9,758
(% of AGI for various income ranges: 2.1% for AGIs below $25k, 4.0% for AGIs $25k-50k, 4.5% for AGIs $50k-75k, 4.9% for AGIs $75k-100k, 7.3% for AGIs $100k-200k, 4.9% for AGIs over 200k)
Earned income credit: $2,100 (reported on 9.6% of returns)
Here:
$2,100
State:
$2,188
(% of AGI for various income ranges: 4.9% for AGIs below $25k, 0.5% for AGIs $25k-50k)
Percentage of individuals using paid preparers for their 2012 taxes: 66.3%
Here:
66%
State:
57%
(% for various income ranges: 58.3% for AGIs below $25k, 61.1% for AGIs $25k-50k, 66.7% for AGIs $50k-75k, 75.0% for AGIs $75k-100k, 72.7% for AGIs $100k-200k, 100.0% for AGIs over 200k)
Averages for the 2004 tax year for zip code 68317, filed in 2005:
Average Adjusted Gross Income (AGI) in 2004: $49,017 (Individual Income Tax Returns)
Here:
$49,017
State:
$44,271
Salary/wage: $42,405 (reported on 84.7% of returns)
Here:
$42,405
State:
$38,230
(% of AGI for various income ranges: 171.1% for AGIs below $10k, 72.7% for AGIs $10k-25k, 79.5% for AGIs $25k-50k, 90.6% for AGIs $50k-75k, 82.6% for AGIs $75k-100k, 50.0% for AGIs over 100k)
Taxable interest for individuals: $1,071 (reported on 60.1% of returns)
This zip code:
$1,071
Nebraska:
$1,759
(% of AGI for various income ranges: 7.1% for AGIs below $10k, 3.0% for AGIs $10k-25k, 2.1% for AGIs $25k-50k, 0.7% for AGIs $50k-75k, 0.4% for AGIs $75k-100k, 1.1% for AGIs over 100k)
Taxable dividends: $1,343 (reported on 29.2% of returns)
Here:
$1,343
State:
$2,804
(% of AGI for various income ranges: 5.0% for AGIs below $10k, 1.1% for AGIs $10k-25k, 0.9% for AGIs $25k-50k, 0.5% for AGIs $50k-75k, 0.1% for AGIs $75k-100k, 1.1% for AGIs over 100k)
Net capital gain/loss: +$2,821 (reported on 24.7% of returns)
Here:
+$2,821
State:
+$7,887
(% of AGI for various income ranges: -6.3% for AGIs below $10k, 0.9% for AGIs $10k-25k, 0.5% for AGIs $25k-50k, 0.9% for AGIs $50k-75k, 0.9% for AGIs $75k-100k, 2.8% for AGIs over 100k)
Profit/loss from business: +$5,719 (reported on 21.9% of returns)
Here:
+$5,719
State:
+$7,743
(% of AGI for various income ranges: 17.6% for AGIs below $10k, 2.9% for AGIs $10k-25k, 5.5% for AGIs $25k-50k, 0.6% for AGIs $50k-75k, 0.1% for AGIs $75k-100k, 2.9% for AGIs over 100k)
IRA payment deduction: $2,900 (reported on 4.3% of returns)
68317:
$2,900
Nebraska:
$2,902
Total itemized deductions: $18,898 (22% of AGI, reported on 39.2% of returns)
Here:
$18,898
State:
$18,692
Here:
22.0% of AGI
State:
21.1% of AGI
(% of AGI for various income ranges: 16.0% for AGIs $10k-25k, 15.3% for AGIs $25k-50k, 13.3% for AGIs $50k-75k, 18.8% for AGIs $75k-100k, 15.1% for AGIs over 100k)
Charity contributions deductions: $3,473 (4% of AGI, reported on 34.2% of returns)
Here:
$3,473
State:
$3,500
Here:
4.0% of AGI
State:
3.8% of AGI
(% of AGI for various income ranges: 1.7% for AGIs $10k-25k, 2.1% for AGIs $25k-50k, 1.6% for AGIs $50k-75k, 3.9% for AGIs $75k-100k, 2.9% for AGIs over 100k)
Total tax: $7,251 (reported on 78.0% of returns)
68317:
$7,251
State:
$6,550
(% of AGI for various income ranges: 3.9% for AGIs below $10k, 4.7% for AGIs $10k-25k, 7.0% for AGIs $25k-50k, 7.7% for AGIs $50k-75k, 9.4% for AGIs $75k-100k, 19.4% for AGIs over 100k)
Earned income credit: $1,764 (reported on 7.9% of returns)
Here:
$1,764
State:
$1,643
Percentage of individuals using paid preparers for their 2004 taxes: 63.8%
Here:
64%
State:
62%
(% for various income ranges: 51.5% for AGIs below $10k, 58.6% for AGIs $10k-25k, 67.7% for AGIs $25k-50k, 71.1% for AGIs $50k-75k, 65.5% for AGIs $75k-100k, 75.9% for AGIs over 100k)
Household received Food Stamps/SNAP in the past 12 months: 31 Household did not receive Food Stamps/SNAP in the past 12 months: 777
Women who had a birth in the past 12 months: 31 (30 now married, 2 unmarried) Women who did not have a birth in the past 12 months: 329 (257 now married, 71 unmarried)
Housing units in zip code 68317 with a mortgage: 485 (43 second mortgage, 1 home equity loan, 42 both second mortgage and home equity loan) Houses without a mortgage: 19
Median monthly owner costs for units with a mortgage: $1,625 Median monthly owner costs for units without a mortgage: $710
Residents with income below the poverty level in 2022:
This zip code:
3.4%
Whole state:
11.2%
Residents with income below 50% of the poverty level in 2022:
This zip code:
1.3%
Whole state:
6.1%
Median number of rooms in houses and condos:
Here:
7.0
State:
7.1
Median number of rooms in apartments:
Here:
5.2
State:
4.2
Notable locations in this zip code not listed on our city pages
Size of family households: 317 2-persons, 132 3-persons, 108 4-persons, 50 5-persons, 4 6-persons, 2 7-or-more-persons
Size of nonfamily households: 153 1-person, 42 2-persons
418 married couples with children.
39 single-parent households (14 men, 25 women).
98.7% of residents of 68317 zip code speak English at home.
0.4% of residents speak Spanish at home (100% well).
0.8% of residents speak other Indo-European language at home (73% very well, 27% well).
0.2% of residents speak Asian or Pacific Island language at home (100% well).
Foreign born population: 21 (1.1%) (65.5% of them are naturalized citizens)
This zip code:
1.1%
Whole state:
7.2%
50%Singapore
32%Bolivia
18%Bhutan
36%German
23%English
9%American
6%Irish
5%Czech
2%Swedish
2%Danish
Year of entry for the foreign-born population
72010 or later
02000 to 2009
31990 to 1999
35Before 1990
Facilities with environmental interests located in this zip code:
WAVERLY CO-OP BENNET BRANCH (355 HACKBERRY STREET in BENNET, NE)
AIR MINOR (AIRS/AFS) STATE MASTER (Nebraska tracking) - AIR PROGRAM, REFUSE DISPOSAL, LEGAL SERVICES, -083192-MF-1430, LEAKING STORAGE TANK, -AP6308, -06060-DWT-1245, RELEASE ASSESSMENT, -0005500166, EPCRA CRITERIA AND HAZARDOUS AIR POLLUTANT INVENTORY (Inventory of air pollution sources) Business SIC classification: GRAIN AND FIELD BEANS Alternative names: FARMERS CO-OP CO
BENNET WWTF (685 MONROE in BENNET, NE)
STATE MASTER (Nebraska tracking) - LEGAL SERVICES, OPERATOR CERTIFICATION, National Pollutant Discharge Elimination System Permit, WASTEWATER FACILITY National Pollutant Discharge Elimination System NON-MAJOR (Tracking pollutant discharge elimination systems) - permit Business SIC classification: SEWERAGE SYSTEMS Organizations: CHARLES BAUSCH, UTILITY SUPER (CONTACT/OPERATOR)
Alternative names: BENNET WASTEWATER TREATMENT
ELEMENTARY AT BENNET ( in BENNET, NE)
(National Center for Education Statistics) - STATE ID-660501003 Organizations: PALMYRA DISTRICT O R 1 (SCHOOL DISTRICT)
BENNET BURN SITE (NO STREET ADDRESS in BENNET, NE)
AIR MINOR (AIRS/AFS) Business SIC classification: REFUSE SYSTEMS
42.7%Utility gas
31.3%Electricity
26.2%Bottled, tank, or LP gas
Population in 1990: 1,611.
Place of birth for U.S.-born residents:
This state: 1,521
Northeast: 34
Midwest: 216
South: 49
West: 99
68% of the 68317 zip code residents lived in the same house 5 years ago. Out of people who lived in different houses, 74% lived in this county. Out of people who lived in different counties, 50% lived in Nebraska.
96% of the 68317 zip code residents lived in the same house 1 year ago. Out of people who lived in different houses, 84% moved from this county. Out of people who lived in different houses, 14% moved from different county within same state. Out of people who lived in different houses, 16% moved from different state.
Private vs. public school enrollment:
Students in private schools in grades 1 to 8 (elementary and middle school): 12
Here:
7.4%
Nebraska:
14.1%
Students in private schools in grades 9 to 12 (high school): 6
Here:
11.1%
Nebraska:
12.5%
Students in private undergraduate colleges:
Here:
0.0%
Nebraska:
18.0%
Occupation by median earnings in the past 12 months ($)
101,030Healthcare support occupations
95,586Education, training, and library occupations
93,842Fire fighting and prevention, and other protective service workers including supervisors
87,863Computer and mathematical occupations
86,682Sales and related occupations
79,959Production occupations
Top industries in this zip code by the number of employees in 2005:
Accommodation and Food Services: Limited-Service Restaurants (10-19 employees: 1 establishment)
Accommodation and Food Services: Full-Service Restaurants (10-19: 1)
Other Services (except Public Administration): General Automotive Repair (5-9: 1, 1-4: 1)
Construction: Poured Concrete Foundation and Structure Contractors (5-9: 1, 1-4: 1)
Administrative and Support and Waste Management and Remediation Services: Landscaping Services (5-9: 1, 1-4: 1)
Construction: Residential Remodelers (1-4: 4)
Finance and Insurance: Commercial Banking (5-9: 1)
Educational Services: Sports and Recreation Instruction (5-9: 1)
Fatal accident statistics in 2013:
Fatal accident count: 1
Vehicles involved in fatal accidents: 2
Fatal accidents caused by drunken drivers: 0
Fatalities: 1
Persons involved in fatal accidents: 2
Pedestrians involved in fatal accidents: 0
Home Mortgage Disclosure Act Aggregated Statistics For Year 2009 (Based on 2 partial tracts)
A) FHA, FSA/RHS & VA Home Purchase Loans
B) Conventional Home Purchase Loans
C) Refinancings
D) Home Improvement Loans
F) Non-occupant Loans on < 5 Family Dwellings (A B C & D)
G) Loans On Manufactured Home Dwelling (A B C & D)
Number
Average Value
Number
Average Value
Number
Average Value
Number
Average Value
Number
Average Value
Number
Average Value
LOANS ORIGINATED
22
$151,775
29
$179,302
196
$171,783
12
$43,532
8
$145,625
3
$94,950
APPLICATIONS APPROVED, NOT ACCEPTED
1
$247,190
2
$181,535
13
$150,448
1
$129,390
0
$0
0
$0
APPLICATIONS DENIED
6
$147,817
4
$183,948
29
$171,877
4
$40,435
1
$155,460
2
$82,800
APPLICATIONS WITHDRAWN
4
$106,095
4
$158,962
26
$153,568
0
$0
0
$0
0
$0
FILES CLOSED FOR INCOMPLETENESS
0
$0
1
$143,870
4
$152,805
0
$0
1
$104,770
0
$0
Aggregated Statistics For Year 2008 (Based on 2 partial tracts)
A) FHA, FSA/RHS & VA Home Purchase Loans
B) Conventional Home Purchase Loans
C) Refinancings
D) Home Improvement Loans
F) Non-occupant Loans on < 5 Family Dwellings (A B C & D)
G) Loans On Manufactured Home Dwelling (A B C & D)
Number
Average Value
Number
Average Value
Number
Average Value
Number
Average Value
Number
Average Value
Number
Average Value
LOANS ORIGINATED
16
$140,314
39
$160,723
93
$168,783
13
$67,778
9
$108,308
2
$119,495
APPLICATIONS APPROVED, NOT ACCEPTED
1
$214,850
5
$157,392
7
$132,219
2
$38,385
1
$69,040
0
$0
APPLICATIONS DENIED
0
$0
3
$195,533
26
$152,639
4
$31,745
3
$109,113
0
$0
APPLICATIONS WITHDRAWN
1
$198,430
3
$144,517
13
$170,428
2
$25,830
0
$0
0
$0
FILES CLOSED FOR INCOMPLETENESS
0
$0
0
$0
3
$173,003
0
$0
0
$0
0
$0
Aggregated Statistics For Year 2007 (Based on 2 partial tracts)
A) FHA, FSA/RHS & VA Home Purchase Loans
B) Conventional Home Purchase Loans
C) Refinancings
D) Home Improvement Loans
F) Non-occupant Loans on < 5 Family Dwellings (A B C & D)
G) Loans On Manufactured Home Dwelling (A B C & D)
Number
Average Value
Number
Average Value
Number
Average Value
Number
Average Value
Number
Average Value
Number
Average Value
LOANS ORIGINATED
4
$176,222
61
$166,170
90
$140,779
17
$35,074
8
$205,130
1
$173,810
APPLICATIONS APPROVED, NOT ACCEPTED
0
$0
7
$134,494
5
$135,378
2
$66,145
0
$0
0
$0
APPLICATIONS DENIED
1
$133,740
5
$105,636
44
$125,155
7
$72,559
2
$101,870
2
$88,835
APPLICATIONS WITHDRAWN
0
$0
7
$120,561
20
$150,658
0
$0
0
$0
0
$0
FILES CLOSED FOR INCOMPLETENESS
0
$0
0
$0
6
$124,723
0
$0
0
$0
0
$0
Aggregated Statistics For Year 2006 (Based on 2 partial tracts)
A) FHA, FSA/RHS & VA Home Purchase Loans
B) Conventional Home Purchase Loans
C) Refinancings
D) Home Improvement Loans
F) Non-occupant Loans on < 5 Family Dwellings (A B C & D)
G) Loans On Manufactured Home Dwelling (A B C & D)
Number
Average Value
Number
Average Value
Number
Average Value
Number
Average Value
Number
Average Value
Number
Average Value
LOANS ORIGINATED
7
$137,460
57
$143,044
96
$124,361
15
$26,683
14
$89,904
2
$72,180
APPLICATIONS APPROVED, NOT ACCEPTED
0
$0
7
$133,597
12
$145,082
3
$21,243
0
$0
0
$0
APPLICATIONS DENIED
2
$120,215
7
$126,631
28
$120,424
7
$66,213
0
$0
2
$104,285
APPLICATIONS WITHDRAWN
0
$0
6
$178,475
20
$129,873
2
$90,040
0
$0
0
$0
FILES CLOSED FOR INCOMPLETENESS
0
$0
1
$251,060
4
$138,202
0
$0
0
$0
0
$0
Aggregated Statistics For Year 2005 (Based on 2 partial tracts)
A) FHA, FSA/RHS & VA Home Purchase Loans
B) Conventional Home Purchase Loans
C) Refinancings
D) Home Improvement Loans
F) Non-occupant Loans on < 5 Family Dwellings (A B C & D)
G) Loans On Manufactured Home Dwelling (A B C & D)
Number
Average Value
Number
Average Value
Number
Average Value
Number
Average Value
Number
Average Value
Number
Average Value
LOANS ORIGINATED
4
$134,098
59
$129,112
122
$138,484
12
$23,738
13
$93,700
1
$87,870
APPLICATIONS APPROVED, NOT ACCEPTED
0
$0
3
$107,180
16
$139,198
1
$12,070
0
$0
2
$74,835
APPLICATIONS DENIED
0
$0
10
$104,719
38
$153,759
8
$42,969
1
$54,560
2
$59,625
APPLICATIONS WITHDRAWN
0
$0
7
$129,321
32
$120,896
2
$56,490
1
$123,110
0
$0
FILES CLOSED FOR INCOMPLETENESS
0
$0
1
$119,730
7
$126,563
1
$108,630
0
$0
0
$0
Aggregated Statistics For Year 2004 (Based on 2 partial tracts)
A) FHA, FSA/RHS & VA Home Purchase Loans
B) Conventional Home Purchase Loans
C) Refinancings
D) Home Improvement Loans
F) Non-occupant Loans on < 5 Family Dwellings (A B C & D)
G) Loans On Manufactured Home Dwelling (A B C & D)
Number
Average Value
Number
Average Value
Number
Average Value
Number
Average Value
Number
Average Value
Number
Average Value
LOANS ORIGINATED
8
$101,871
65
$153,367
137
$131,163
17
$48,962
14
$107,009
2
$57,455
APPLICATIONS APPROVED, NOT ACCEPTED
1
$111,530
6
$113,618
19
$136,226
2
$46,590
0
$0
2
$63,970
APPLICATIONS DENIED
1
$169,950
7
$103,181
37
$122,357
6
$46,752
2
$86,180
0
$0
APPLICATIONS WITHDRAWN
0
$0
2
$85,215
22
$128,995
3
$54,073
0
$0
1
$113,940
FILES CLOSED FOR INCOMPLETENESS
0
$0
0
$0
11
$126,625
0
$0
0
$0
0
$0
Aggregated Statistics For Year 2003 (Based on 2 partial tracts)
A) FHA, FSA/RHS & VA Home Purchase Loans
B) Conventional Home Purchase Loans
C) Refinancings
D) Home Improvement Loans
F) Non-occupant Loans on < 5 Family Dwellings (A B C & D)
Number
Average Value
Number
Average Value
Number
Average Value
Number
Average Value
Number
Average Value
LOANS ORIGINATED
9
$100,422
46
$119,598
275
$127,870
17
$22,152
14
$53,315
APPLICATIONS APPROVED, NOT ACCEPTED
0
$0
3
$93,503
19
$108,249
1
$26,550
0
$0
APPLICATIONS DENIED
0
$0
6
$98,813
59
$116,240
1
$53,110
0
$0
APPLICATIONS WITHDRAWN
0
$0
3
$143,390
27
$124,008
0
$0
0
$0
FILES CLOSED FOR INCOMPLETENESS
0
$0
0
$0
3
$164,797
0
$0
0
$0
Aggregated Statistics For Year 2002 (Based on 2 partial tracts)
A) FHA, FSA/RHS & VA Home Purchase Loans
B) Conventional Home Purchase Loans
C) Refinancings
D) Home Improvement Loans
F) Non-occupant Loans on < 5 Family Dwellings (A B C & D)
Number
Average Value
Number
Average Value
Number
Average Value
Number
Average Value
Number
Average Value
LOANS ORIGINATED
11
$88,001
35
$121,707
187
$133,689
12
$23,497
9
$66,198
APPLICATIONS APPROVED, NOT ACCEPTED
0
$0
2
$66,870
15
$136,568
2
$30,900
1
$21,240
APPLICATIONS DENIED
0
$0
3
$75,800
37
$103,698
6
$18,347
1
$56,000
APPLICATIONS WITHDRAWN
0
$0
3
$134,700
36
$118,192
1
$13,040
1
$48,280
FILES CLOSED FOR INCOMPLETENESS
0
$0
0
$0
7
$119,803
0
$0
0
$0
Aggregated Statistics For Year 2001 (Based on 2 partial tracts)
A) FHA, FSA/RHS & VA Home Purchase Loans
B) Conventional Home Purchase Loans
C) Refinancings
D) Home Improvement Loans
F) Non-occupant Loans on < 5 Family Dwellings (A B C & D)
Number
Average Value
Number
Average Value
Number
Average Value
Number
Average Value
Number
Average Value
LOANS ORIGINATED
7
$93,663
32
$116,204
152
$115,789
20
$17,236
9
$71,883
APPLICATIONS APPROVED, NOT ACCEPTED
0
$0
0
$0
8
$106,639
2
$26,555
0
$0
APPLICATIONS DENIED
0
$0
8
$78,274
31
$97,868
7
$21,313
1
$37,180
APPLICATIONS WITHDRAWN
0
$0
3
$141,460
19
$101,845
1
$10,620
0
$0
FILES CLOSED FOR INCOMPLETENESS
0
$0
0
$0
8
$83,766
0
$0
0
$0
Aggregated Statistics For Year 2000 (Based on 2 partial tracts)
A) FHA, FSA/RHS & VA Home Purchase Loans
B) Conventional Home Purchase Loans
C) Refinancings
D) Home Improvement Loans
F) Non-occupant Loans on < 5 Family Dwellings (A B C & D)
Number
Average Value
Number
Average Value
Number
Average Value
Number
Average Value
Number
Average Value
LOANS ORIGINATED
10
$92,601
47
$107,716
57
$84,304
21
$23,680
10
$70,006
APPLICATIONS APPROVED, NOT ACCEPTED
0
$0
0
$0
11
$107,182
2
$63,730
0
$0
APPLICATIONS DENIED
0
$0
3
$102,193
32
$95,745
9
$15,289
1
$83,040
APPLICATIONS WITHDRAWN
0
$0
4
$164,272
15
$64,405
1
$75,800
0
$0
FILES CLOSED FOR INCOMPLETENESS
0
$0
0
$0
8
$87,085
0
$0
0
$0
Aggregated Statistics For Year 1999 (Based on 1 partial tract)
A) FHA, FSA/RHS & VA Home Purchase Loans
B) Conventional Home Purchase Loans
C) Refinancings
D) Home Improvement Loans
F) Non-occupant Loans on < 5 Family Dwellings (A B C & D)

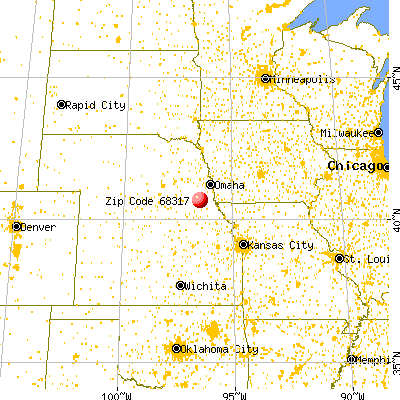


 Nearest zip codes: 68419, 68461, 68526, 68418, 68372, 68520.


