Estimated zip code population in 2022: 755 Zip code population in 2010: 734 Zip code population in 2000: 561
Houses and condos: 316 Renter-occupied apartments: 14
% of renters here:
5%
State:
34%
March 2022 cost of living index in zip code 68461: 74.5 (low, U.S. average is 100)
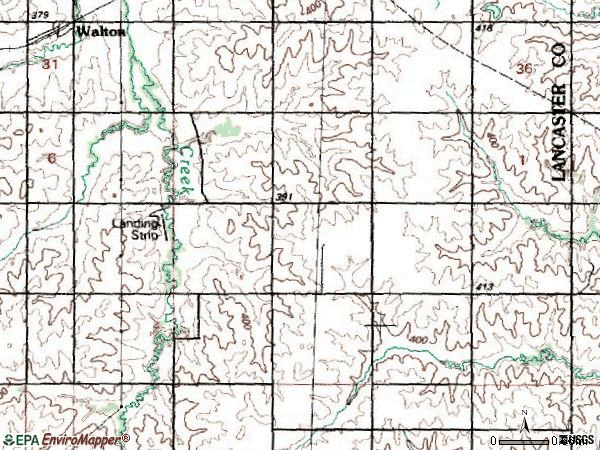
Land area: 24.1 sq. mi. Water area: 0.0 sq. mi.
Population density: 31 people per square mile
(very low).
OSM Map
General Map
Google Map
MSN Map
OSM Map
General Map
Google Map
MSN Map
OSM Map
General Map
Google Map
MSN Map
OSM Map
General Map
Google Map
MSN Map
Please wait while loading the map...
Real estate property taxes paid for housing units in 2022:
This zip code:
1.3% ($6,841)
Nebraska:
1.4% ($3,313)
Median real estate property taxes paid for housing units with mortgages in 2022: $6,168 (1.3%) Median real estate property taxes paid for housing units with no mortgage in 2022: $10,673 (2.0%)
Business Search- 14 Million verified businesses
Males: 418
(55.4%)
Females: 336
(44.6%)
For population 25 years and over in 68461:
High school or higher: 100.7%
Bachelor's degree or higher: 58.4%
Graduate or professional degree: 6.7%
Mean travel time to work (commute): 24.2 minutes
For population 15 years and over in 68461:
Never married: 16.5%
Now married: 51.7%
Separated: 0.0%
Widowed: 10.1%
Divorced: 21.7%
Zip code 68461 compared to state average:
Median household income significantly below state average.
Median house value above state average.
Unemployed percentage significantly below state average.
Black race population percentage significantly below state average.
Hispanic race population percentage significantly below state average.
Median age above state average.
Foreign-born population percentage significantly below state average.
Renting percentage significantly below state average.
Length of stay since moving in significantly above state average.
Number of rooms per house above state average.
Percentage of population with a bachelor's degree or higher above state average.
Averages for the 2020 tax year for zip code 68461, filed in 2021:
Average Adjusted Gross Income (AGI) in 2020: $194,012 (Individual Income Tax Returns)
Here:
$194,012
State:
$73,874
Salary/wage: $110,761 (reported on 80.5% of returns)
Here:
$110,761
State:
$58,268
(% of AGI for various income ranges: 885.0% for AGIs below $25k, 3567.5% for AGIs $25k-50k, 6380.0% for AGIs $50k-75k, 7400.0% for AGIs $75k-100k, 13810.0% for AGIs $100k-200k)
Taxable interest for individuals: $2,439 (reported on 56.1% of returns)
This zip code:
$2,439
Nebraska:
$1,748
(% of AGI for various income ranges: 20.0% for AGIs below $25k, 67.5% for AGIs $25k-50k, 100.0% for AGIs $50k-75k, 373.3% for AGIs $100k-200k)
Ordinary dividends: $15,300 (reported on 41.5% of returns)
Here:
$15,300
State:
$7,841
(% of AGI for various income ranges: 115.0% for AGIs below $25k, 383.3% for AGIs $50k-75k, 366.7% for AGIs $100k-200k)
Net capital gain/loss in AGI: +$27,931 (reported on 39.0% of returns)
Here:
+$27,931
State:
+$21,703
(% of AGI for various income ranges: 263.8% for AGIs below $25k, 773.3% for AGIs $50k-75k, 901.7% for AGIs $100k-200k)
Profit/loss from business: +$11,933 (reported on 22.0% of returns)
Here:
+$11,933
State:
+$11,239
(% of AGI for various income ranges: 366.2% for AGIs below $25k, 1301.7% for AGIs $100k-200k)
Taxable individual retirement arrangement distribution: $29,560 (reported on 12.2% of returns)
68461:
$29,560
Nebraska:
$18,251
(% of AGI for various income ranges: 332.5% for AGIs below $25k, 2020.0% for AGIs $100k-200k)
Total itemized deductions: $50,356 (reported on 22.0% of returns)
Here:
$50,356
State:
$37,704
(% of AGI for various income ranges: 1096.2% for AGIs below $25k, 1231.7% for AGIs $100k-200k)
Charity contributions: $20,988 (reported on 19.5% of returns)
Here:
$20,988
State:
$15,251
(% of AGI for various income ranges: 415.0% for AGIs $100k-200k)
Taxes paid: $9,060 (reported on 24.4% of returns)
68461:
$9,060
State:
$8,015
(% of AGI for various income ranges: 177.5% for AGIs below $25k, 366.7% for AGIs $100k-200k)
Earned income credit: $1,400 (reported on 4.9% of returns)
Here:
$1,400
State:
$2,260
(% of AGI for various income ranges: 35.0% for AGIs below $25k)
Percentage of individuals using paid preparers for their 2020 taxes: 97.6%
Here:
98%
State:
95%
(% for various income ranges: 100.0% for AGIs below $25k, 100.0% for AGIs $25k-50k, 80.0% for AGIs $50k-75k, 100.0% for AGIs $75k-100k, 100.0% for AGIs $100k-200k, 100.0% for AGIs over 200k)
Averages for the 2012 tax year for zip code 68461, filed in 2013:
Average Adjusted Gross Income (AGI) in 2012: $152,937 (Individual Income Tax Returns)
Here:
$152,937
State:
$60,572
Salary/wage: $113,570 (reported on 85.7% of returns)
Here:
$113,570
State:
$47,046
(% of AGI for various income ranges: 97.3% for AGIs below $25k, 71.3% for AGIs $25k-50k, 67.4% for AGIs $50k-75k, 68.2% for AGIs $75k-100k, 65.9% for AGIs $100k-200k, 61.1% for AGIs over 200k)
Taxable interest for individuals: $1,271 (reported on 60.0% of returns)
This zip code:
$1,271
Nebraska:
$1,535
(% of AGI for various income ranges: 1.7% for AGIs below $25k, 1.5% for AGIs $25k-50k, 0.5% for AGIs $50k-75k, 2.0% for AGIs $75k-100k, 0.8% for AGIs $100k-200k, 0.2% for AGIs over 200k)
Ordinary dividends: $5,612 (reported on 45.7% of returns)
Here:
$5,612
State:
$5,776
(% of AGI for various income ranges: 5.7% for AGIs below $25k, 2.9% for AGIs $50k-75k, 3.2% for AGIs $100k-200k, 1.3% for AGIs over 200k)
Net capital gain/loss in AGI: +$8,586 (reported on 40.0% of returns)
Here:
+$8,586
State:
+$16,171
(% of AGI for various income ranges: 2.2% for AGIs below $25k, 1.0% for AGIs $100k-200k, 3.0% for AGIs over 200k)
Profit/loss from business: +$7,571 (reported on 20.0% of returns)
Here:
+$7,571
State:
+$9,897
(% of AGI for various income ranges: 3.4% for AGIs below $25k, 7.3% for AGIs $25k-50k, 4.3% for AGIs $100k-200k)
Taxable individual retirement arrangement distribution: $17,100 (reported on 11.4% of returns)
68461:
$17,100
Nebraska:
$12,804
Total itemized deductions: $38,674 (15% of AGI, reported on 54.3% of returns)
Here:
$38,674
State:
$23,343
Here:
15.4% of AGI
State:
18.7% of AGI
(% of AGI for various income ranges: 34.6% for AGIs $25k-50k, 12.6% for AGIs $50k-75k, 16.2% for AGIs $75k-100k, 21.4% for AGIs $100k-200k, 11.3% for AGIs over 200k)
Charity contributions: $7,793 (reported on 42.9% of returns)
Here:
$7,793
State:
$4,921
(% of AGI for various income ranges: 3.0% for AGIs below $25k, 4.8% for AGIs $50k-75k, 4.7% for AGIs $100k-200k, 1.7% for AGIs over 200k)
Taxes paid: $20,647 (reported on 54.3% of returns)
68461:
$20,647
State:
$9,758
(% of AGI for various income ranges: 16.4% for AGIs $25k-50k, 6.3% for AGIs $75k-100k, 8.6% for AGIs $100k-200k, 7.4% for AGIs over 200k)
Earned income credit: $2,650 (reported on 5.7% of returns)
Here:
$2,650
State:
$2,188
(% of AGI for various income ranges: 4.7% for AGIs below $25k)
Percentage of individuals using paid preparers for their 2012 taxes: 68.6%
Here:
69%
State:
57%
(% for various income ranges: 63.6% for AGIs below $25k, 40.0% for AGIs $25k-50k, 75.0% for AGIs $50k-75k, 75.0% for AGIs $75k-100k, 66.7% for AGIs $100k-200k, 100.0% for AGIs over 200k)
Averages for the 2004 tax year for zip code 68461, filed in 2005:
Average Adjusted Gross Income (AGI) in 2004: $85,061 (Individual Income Tax Returns)
Here:
$85,061
State:
$44,271
Salary/wage: $69,506 (reported on 82.4% of returns)
Here:
$69,506
State:
$38,230
(% of AGI for various income ranges: 887.5% for AGIs below $10k, 66.5% for AGIs $10k-25k, 82.8% for AGIs $25k-50k, 70.6% for AGIs $50k-75k, 72.2% for AGIs $75k-100k, 62.8% for AGIs over 100k)
Taxable interest for individuals: $1,809 (reported on 60.5% of returns)
This zip code:
$1,809
Nebraska:
$1,759
(% of AGI for various income ranges: 72.5% for AGIs below $10k, 2.3% for AGIs $10k-25k, 0.5% for AGIs $25k-50k, 2.0% for AGIs $50k-75k, 2.2% for AGIs $75k-100k, 1.0% for AGIs over 100k)
Taxable dividends: $3,393 (reported on 41.0% of returns)
Here:
$3,393
State:
$2,804
(% of AGI for various income ranges: 42.5% for AGIs below $10k, 0.5% for AGIs $25k-50k, 2.2% for AGIs $50k-75k, 2.0% for AGIs $75k-100k, 1.6% for AGIs over 100k)
Net capital gain/loss: +$14,333 (reported on 34.7% of returns)
Here:
+$14,333
State:
+$7,887
(% of AGI for various income ranges: -27.5% for AGIs below $10k, 0.1% for AGIs $25k-50k, 0.9% for AGIs $50k-75k, 1.8% for AGIs $75k-100k, 8.0% for AGIs over 100k)
Profit/loss from business: +$2,397 (reported on 17.6% of returns)
Here:
+$2,397
State:
+$7,743
(% of AGI for various income ranges: 37.5% for AGIs below $10k, -1.1% for AGIs $25k-50k, -1.2% for AGIs $50k-75k, 0.9% for AGIs over 100k)
IRA payment deduction: $1,667 (reported on 3.6% of returns)
68461:
$1,667
Nebraska:
$2,902
Total itemized deductions: $28,641 (16% of AGI, reported on 39.8% of returns)
Here:
$28,641
State:
$18,692
Here:
16.0% of AGI
State:
21.1% of AGI
(% of AGI for various income ranges: 10.7% for AGIs $25k-50k, 17.2% for AGIs $50k-75k, 18.4% for AGIs $75k-100k, 13.1% for AGIs over 100k)
Charity contributions deductions: $6,246 (3% of AGI, reported on 35.9% of returns)
Here:
$6,246
State:
$3,500
Here:
3.3% of AGI
State:
3.8% of AGI
(% of AGI for various income ranges: 1.0% for AGIs $25k-50k, 1.6% for AGIs $50k-75k, 3.1% for AGIs $75k-100k, 3.0% for AGIs over 100k)
Total tax: $19,115 (reported on 79.6% of returns)
68461:
$19,115
State:
$6,550
(% of AGI for various income ranges: 25.0% for AGIs below $10k, 6.0% for AGIs $10k-25k, 7.8% for AGIs $25k-50k, 8.0% for AGIs $50k-75k, 9.3% for AGIs $75k-100k, 22.1% for AGIs over 100k)
Earned income credit: $1,150 (reported on 6.1% of returns)
Here:
$1,150
State:
$1,643
Percentage of individuals using paid preparers for their 2004 taxes: 69.0%
Here:
69%
State:
62%
(% for various income ranges: 67.5% for AGIs below $10k, 57.4% for AGIs $10k-25k, 71.2% for AGIs $25k-50k, 69.0% for AGIs $50k-75k, 60.6% for AGIs $75k-100k, 81.5% for AGIs over 100k)
Household received Food Stamps/SNAP in the past 12 months: 0 Household did not receive Food Stamps/SNAP in the past 12 months: 320
Women who did not have a birth in the past 12 months: 91 (84 now married, 7 unmarried)
Housing units in zip code 68461 with a mortgage: 128 Median monthly owner costs for units with a mortgage: $1,994 Median monthly owner costs for units without a mortgage: $1,503
Residents with income below the poverty level in 2022:
This zip code:
5.6%
Whole state:
11.2%
Residents with income below 50% of the poverty level in 2022:
This zip code:
5.6%
Whole state:
6.1%
Median number of rooms in houses and condos:
Here:
7.6
State:
7.1
Notable locations in this zip code not listed on our city pages
Size of family households: 54 2-persons, 10 3-persons, 75 4-persons, 7 5-persons, 19 7-or-more-persons
Size of nonfamily households: 157 1-person
253 married couples with children.
0 single-parent households ().
101.2% of residents of 68461 zip code speak English at home.
Foreign born population: 0 (0.0%)
:
0.0%
Whole state:
7.2%
40%German
20%European
13%American
12%Polish
7%Irish
7%Norwegian
Facilities with environmental interests located in this zip code:
GREENWOOD FARMERS COOPERATIVE WALTON ANHYDROUS (1621 SOUTH 118TH in WALTON, NE)
AIR MINOR (AIRS/AFS) STATE MASTER (Nebraska tracking) - EPCRA, AIR PROGRAM CRITERIA AND HAZARDOUS AIR POLLUTANT INVENTORY (Inventory of air pollution sources) Business SIC classification: GRAIN AND FIELD BEANS Alternative names: GREENWOOD FARMERS CO-OP
FARMERS UNION COOP-WALTON (MAIN ST in WALTON, NE)
COMPLIANCE ACTIVITY (Tracking inspections of insecticide, fungicide, and rodenticide, and toxic substances) Alternative names: FARMERS UNION COOP ASSN, FARMERS UNION COOP ASSN-WALTON
WALTON GROUND WATER CONTAMINATION (HWY 34 2 MI E OF LINCOLN in WALTON, NE)
SUPERFUND (Superfund database) Alternative names: WALTON PUBLIC WATER SUPPLY
43.8%Bottled, tank, or LP gas
32.1%Electricity
16.5%Other fuel
5.2%Wood
3.2%Utility gas
Population in 1990: 268. Population change in the 1990s: +293 (+109.3%).
Place of birth for U.S.-born residents:
This state: 610
Northeast: 7
Midwest: 112
West: 21
54% of the 68461 zip code residents lived in the same house 5 years ago. Out of people who lived in different houses, 79% lived in this county. Out of people who lived in different counties, 50% lived in Nebraska.
98% of the 68461 zip code residents lived in the same house 1 year ago. Out of people who lived in different houses, 130% moved from this county.
Private vs. public school enrollment:
Students in private schools in grades 1 to 8 (elementary and middle school): 62
Here:
37.4%
Nebraska:
14.1%
Students in private schools in grades 9 to 12 (high school): 19
Here:
24.2%
Nebraska:
12.5%
Students in private undergraduate colleges:
Here:
0.0%
Nebraska:
18.0%
Occupation by median earnings in the past 12 months ($)
203,385Management occupations
53,023Health diagnosing and treating practitioners and other technical occupations
Top industries in this zip code by the number of employees in 2005:
Administrative and Support and Waste Management and Remediation Services: Janitorial Services (50-99 employees: 1 establishment, 5-9 employees: 1 establishment)
Construction: Painting and Wall Covering Contractors (20-49: 1)
Construction: Poured Concrete Foundation and Structure Contractors (10-19: 1)
Finance and Insurance: Third Party Administration of Insurance and Pension Funds (10-19: 1)
Other Services (except Public Administration): Civic and Social Organizations (10-19: 1)
Construction: Electrical Contractors (5-9: 1)
Administrative and Support and Waste Management and Remediation Services: Landscaping Services (5-9: 1)
Health Care and Social Assistance: Residential Mental Retardation Facilities (5-9: 1)
Finance and Insurance: Investment Advice (1-4: 1)
Home Mortgage Disclosure Act Aggregated Statistics For Year 2009 (Based on 2 partial tracts)
A) FHA, FSA/RHS & VA Home Purchase Loans
B) Conventional Home Purchase Loans
C) Refinancings
D) Home Improvement Loans
F) Non-occupant Loans on < 5 Family Dwellings (A B C & D)
G) Loans On Manufactured Home Dwelling (A B C & D)
Number
Average Value
Number
Average Value
Number
Average Value
Number
Average Value
Number
Average Value
Number
Average Value
LOANS ORIGINATED
9
$157,992
13
$170,332
83
$172,749
5
$44,492
3
$165,370
1
$121,300
APPLICATIONS APPROVED, NOT ACCEPTED
1
$105,270
1
$154,610
6
$138,815
1
$55,100
0
$0
0
$0
APPLICATIONS DENIED
3
$125,897
2
$156,665
13
$163,278
2
$34,440
0
$0
1
$70,520
APPLICATIONS WITHDRAWN
2
$90,360
2
$135,390
11
$154,574
0
$0
0
$0
0
$0
FILES CLOSED FOR INCOMPLETENESS
0
$0
0
$0
2
$130,145
0
$0
1
$44,620
0
$0
Aggregated Statistics For Year 2008 (Based on 2 partial tracts)
A) FHA, FSA/RHS & VA Home Purchase Loans
B) Conventional Home Purchase Loans
C) Refinancings
D) Home Improvement Loans
F) Non-occupant Loans on < 5 Family Dwellings (A B C & D)
G) Loans On Manufactured Home Dwelling (A B C & D)
Number
Average Value
Number
Average Value
Number
Average Value
Number
Average Value
Number
Average Value
Number
Average Value
LOANS ORIGINATED
7
$136,577
17
$157,018
39
$171,397
5
$75,044
4
$103,778
1
$101,770
APPLICATIONS APPROVED, NOT ACCEPTED
1
$91,490
2
$167,565
3
$131,380
1
$32,690
0
$0
0
$0
APPLICATIONS DENIED
0
$0
1
$249,800
11
$153,639
2
$27,035
1
$139,400
0
$0
APPLICATIONS WITHDRAWN
0
$0
1
$184,630
6
$157,250
1
$22,000
0
$0
0
$0
FILES CLOSED FOR INCOMPLETENESS
0
$0
0
$0
1
$221,020
0
$0
0
$0
0
$0
Aggregated Statistics For Year 2007 (Based on 2 partial tracts)
A) FHA, FSA/RHS & VA Home Purchase Loans
B) Conventional Home Purchase Loans
C) Refinancings
D) Home Improvement Loans
F) Non-occupant Loans on < 5 Family Dwellings (A B C & D)
G) Loans On Manufactured Home Dwelling (A B C & D)
Number
Average Value
Number
Average Value
Number
Average Value
Number
Average Value
Number
Average Value
Number
Average Value
LOANS ORIGINATED
2
$150,090
26
$166,022
38
$141,988
7
$36,274
3
$232,943
1
$74,020
APPLICATIONS APPROVED, NOT ACCEPTED
0
$0
3
$133,640
2
$144,125
1
$56,330
0
$0
0
$0
APPLICATIONS DENIED
0
$0
2
$112,465
19
$123,425
3
$72,097
1
$86,760
1
$75,660
APPLICATIONS WITHDRAWN
0
$0
3
$119,797
8
$160,394
0
$0
0
$0
0
$0
FILES CLOSED FOR INCOMPLETENESS
0
$0
0
$0
2
$159,340
0
$0
0
$0
0
$0
Aggregated Statistics For Year 2006 (Based on 2 partial tracts)
A) FHA, FSA/RHS & VA Home Purchase Loans
B) Conventional Home Purchase Loans
C) Refinancings
D) Home Improvement Loans
F) Non-occupant Loans on < 5 Family Dwellings (A B C & D)
G) Loans On Manufactured Home Dwelling (A B C & D)
Number
Average Value
Number
Average Value
Number
Average Value
Number
Average Value
Number
Average Value
Number
Average Value
LOANS ORIGINATED
3
$136,587
24
$144,674
41
$124,002
7
$24,349
6
$89,333
1
$61,470
APPLICATIONS APPROVED, NOT ACCEPTED
0
$0
3
$132,750
5
$148,278
1
$27,140
0
$0
0
$0
APPLICATIONS DENIED
1
$102,390
3
$125,827
12
$119,659
3
$65,793
0
$0
1
$88,820
APPLICATIONS WITHDRAWN
0
$0
3
$152,007
8
$138,266
1
$76,690
0
$0
0
$0
FILES CLOSED FOR INCOMPLETENESS
0
$0
1
$106,910
2
$117,705
0
$0
0
$0
0
$0
Aggregated Statistics For Year 2005 (Based on 2 partial tracts)
A) FHA, FSA/RHS & VA Home Purchase Loans
B) Conventional Home Purchase Loans
C) Refinancings
D) Home Improvement Loans
F) Non-occupant Loans on < 5 Family Dwellings (A B C & D)
G) Loans On Manufactured Home Dwelling (A B C & D)
Number
Average Value
Number
Average Value
Number
Average Value
Number
Average Value
Number
Average Value
Number
Average Value
LOANS ORIGINATED
2
$114,210
25
$129,758
52
$138,361
5
$24,260
5
$103,746
1
$37,420
APPLICATIONS APPROVED, NOT ACCEPTED
0
$0
1
$136,930
7
$135,490
1
$5,140
0
$0
1
$63,740
APPLICATIONS DENIED
0
$0
4
$111,488
16
$155,511
3
$48,797
0
$0
1
$50,780
APPLICATIONS WITHDRAWN
0
$0
3
$128,500
14
$117,676
1
$48,110
0
$0
0
$0
FILES CLOSED FOR INCOMPLETENESS
0
$0
1
$50,990
3
$125,760
0
$0
0
$0
0
$0
Aggregated Statistics For Year 2004 (Based on 2 partial tracts)
A) FHA, FSA/RHS & VA Home Purchase Loans
B) Conventional Home Purchase Loans
C) Refinancings
D) Home Improvement Loans
F) Non-occupant Loans on < 5 Family Dwellings (A B C & D)
G) Loans On Manufactured Home Dwelling (A B C & D)
Number
Average Value
Number
Average Value
Number
Average Value
Number
Average Value
Number
Average Value
Number
Average Value
LOANS ORIGINATED
3
$115,683
28
$151,615
58
$131,935
7
$50,636
6
$106,330
1
$48,930
APPLICATIONS APPROVED, NOT ACCEPTED
0
$0
2
$145,155
8
$137,778
1
$39,680
0
$0
1
$54,480
APPLICATIONS DENIED
1
$72,370
3
$102,527
16
$120,494
2
$59,725
1
$73,400
0
$0
APPLICATIONS WITHDRAWN
0
$0
1
$72,580
9
$134,280
1
$69,080
0
$0
0
$0
FILES CLOSED FOR INCOMPLETENESS
0
$0
0
$0
5
$118,632
0
$0
0
$0
0
$0
Aggregated Statistics For Year 2003 (Based on 2 partial tracts)
A) FHA, FSA/RHS & VA Home Purchase Loans
B) Conventional Home Purchase Loans
C) Refinancings
D) Home Improvement Loans
F) Non-occupant Loans on < 5 Family Dwellings (A B C & D)
Number
Average Value
Number
Average Value
Number
Average Value
Number
Average Value
Number
Average Value
LOANS ORIGINATED
4
$96,220
20
$117,140
117
$127,989
7
$22,910
6
$52,977
APPLICATIONS APPROVED, NOT ACCEPTED
0
$0
1
$119,450
8
$109,482
0
$0
0
$0
APPLICATIONS DENIED
0
$0
3
$84,160
25
$116,822
1
$22,620
0
$0
APPLICATIONS WITHDRAWN
0
$0
1
$183,190
12
$118,820
0
$0
0
$0
FILES CLOSED FOR INCOMPLETENESS
0
$0
0
$0
1
$210,530
0
$0
0
$0
Aggregated Statistics For Year 2002 (Based on 2 partial tracts)
A) FHA, FSA/RHS & VA Home Purchase Loans
B) Conventional Home Purchase Loans
C) Refinancings
D) Home Improvement Loans
F) Non-occupant Loans on < 5 Family Dwellings (A B C & D)
Number
Average Value
Number
Average Value
Number
Average Value
Number
Average Value
Number
Average Value
LOANS ORIGINATED
5
$82,446
15
$120,934
80
$133,077
5
$24,014
4
$63,428
APPLICATIONS APPROVED, NOT ACCEPTED
0
$0
1
$56,950
6
$145,393
1
$26,320
0
$0
APPLICATIONS DENIED
0
$0
1
$96,840
16
$102,119
2
$23,440
0
$0
APPLICATIONS WITHDRAWN
0
$0
1
$172,090
15
$120,797
0
$0
0
$0
FILES CLOSED FOR INCOMPLETENESS
0
$0
0
$0
3
$119,043
0
$0
0
$0
Aggregated Statistics For Year 2001 (Based on 2 partial tracts)
A) FHA, FSA/RHS & VA Home Purchase Loans
B) Conventional Home Purchase Loans
C) Refinancings
D) Home Improvement Loans
F) Non-occupant Loans on < 5 Family Dwellings (A B C & D)
Number
Average Value
Number
Average Value
Number
Average Value
Number
Average Value
Number
Average Value
LOANS ORIGINATED
3
$93,067
14
$113,109
65
$115,307
8
$18,350
4
$68,875
APPLICATIONS APPROVED, NOT ACCEPTED
0
$0
0
$0
3
$121,100
1
$22,620
0
$0
APPLICATIONS DENIED
0
$0
3
$88,887
13
$99,384
3
$21,177
0
$0
APPLICATIONS WITHDRAWN
0
$0
1
$180,720
8
$103,005
0
$0
0
$0
FILES CLOSED FOR INCOMPLETENESS
0
$0
0
$0
3
$95,123
0
$0
0
$0
Aggregated Statistics For Year 2000 (Based on 2 partial tracts)
A) FHA, FSA/RHS & VA Home Purchase Loans
B) Conventional Home Purchase Loans
C) Refinancings
D) Home Improvement Loans
F) Non-occupant Loans on < 5 Family Dwellings (A B C & D)
Number
Average Value
Number
Average Value
Number
Average Value
Number
Average Value
Number
Average Value
LOANS ORIGINATED
4
$98,585
20
$107,796
24
$85,264
9
$23,530
4
$74,530
APPLICATIONS APPROVED, NOT ACCEPTED
0
$0
0
$0
5
$100,416
1
$54,280
0
$0
APPLICATIONS DENIED
0
$0
1
$130,560
14
$93,196
4
$14,650
0
$0
APPLICATIONS WITHDRAWN
0
$0
2
$139,910
6
$68,568
1
$32,280
0
$0
FILES CLOSED FOR INCOMPLETENESS
0
$0
0
$0
3
$98,893
0
$0
0
$0
Aggregated Statistics For Year 1999 (Based on 1 partial tract)
A) FHA, FSA/RHS & VA Home Purchase Loans
B) Conventional Home Purchase Loans
C) Refinancings
D) Home Improvement Loans
F) Non-occupant Loans on < 5 Family Dwellings (A B C & D)

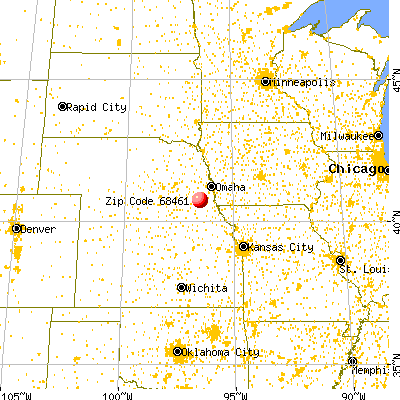


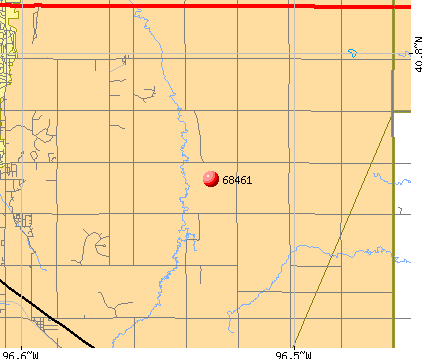 Nearest zip codes: 68520, 68526, 68527, 68317, 68347, 68506.