Estimated zip code population in 2022: 3,089 Zip code population in 2010: 3,268 Zip code population in 2000: 3,016
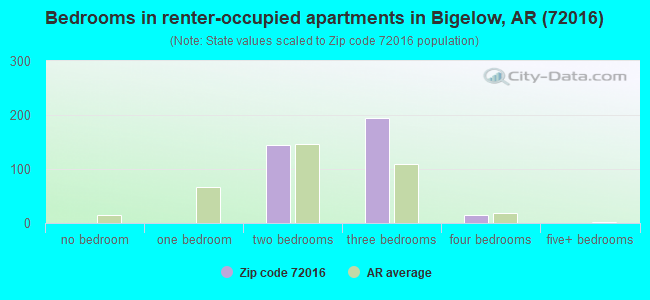
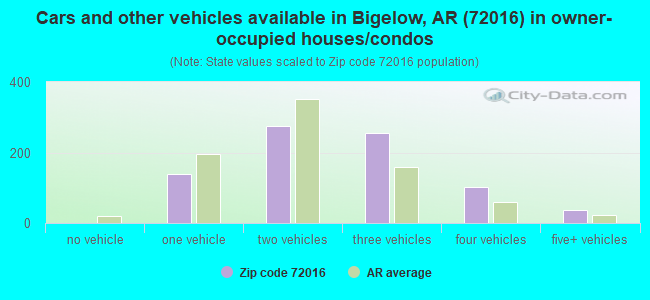
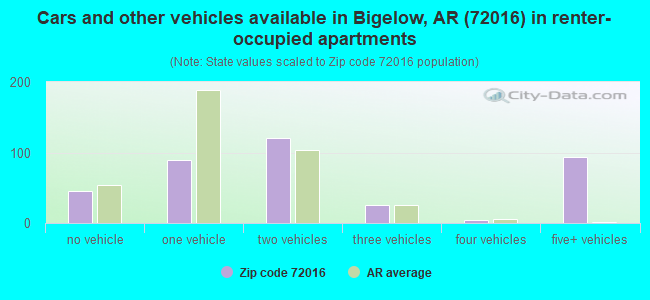
Houses and condos: 1,419 Renter-occupied apartments: 366
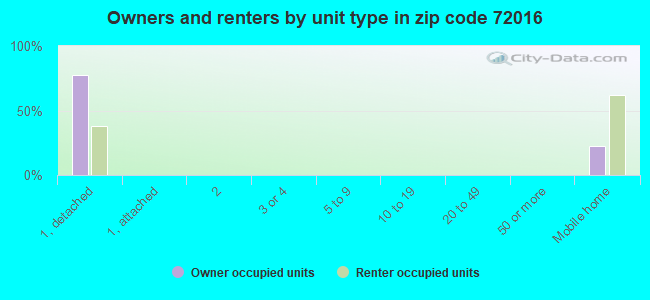
% of renters here:
31%
State:
34%
March 2022 cost of living index in zip code 72016: 79.3 (low, U.S. average is 100)
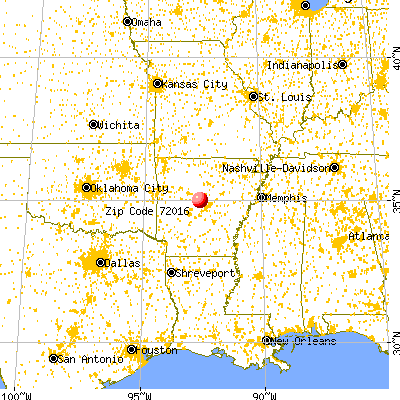
Land area: 81.2 sq. mi. Water area: 6.5 sq. mi.
Population density: 38 people per square mile
(very low).
OSM Map
General Map
Google Map
MSN Map
OSM Map
General Map
Google Map
MSN Map
OSM Map
General Map
Google Map
MSN Map
OSM Map
General Map
Google Map
MSN Map
Please wait while loading the map...
Real estate property taxes paid for housing units in 2022:
This zip code:
0.5% ($873)
Arkansas:
0.5% ($977)
Median real estate property taxes paid for housing units with mortgages in 2022: $931 (0.5%) Median real estate property taxes paid for housing units with no mortgage in 2022: $625 (0.4%)
Business Search- 14 Million verified businesses
Males: 1,560
(50.5%)
Females: 1,528
(49.5%)
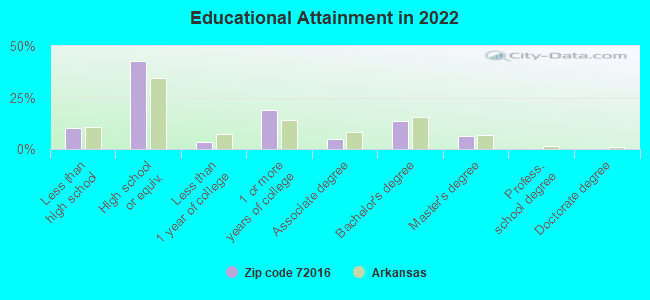
For population 25 years and over in 72016:
High school or higher: 88.9%
Bachelor's degree or higher: 19.8%
Graduate or professional degree: 6.5%
Unemployed: 6.6%
Mean travel time to work (commute): 41.0 minutes
For population 15 years and over in 72016:
Never married: 24.5%
Now married: 61.9%
Separated: 0.5%
Widowed: 5.5%
Divorced: 7.6%
Zip code 72016 compared to state average:
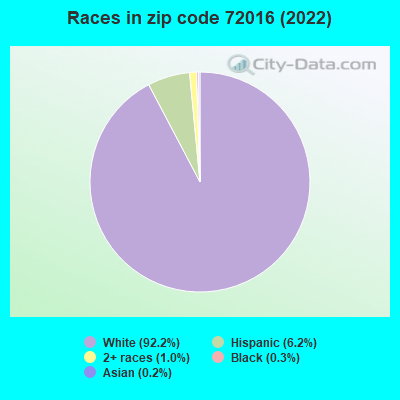
Black race population percentage significantly below state average.
Foreign-born population percentage significantly below state average.
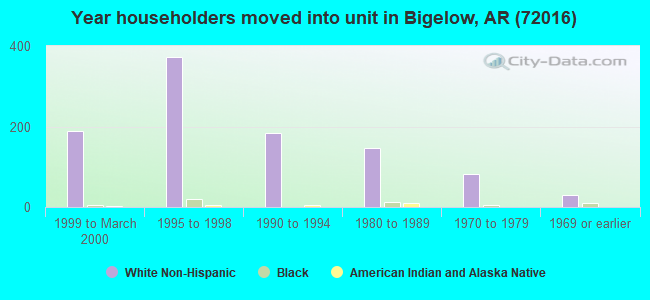
Length of stay since moving in significantly above state average.
Estimated median house/condo value in 2022: $171,718
72016:
$171,718
Arkansas:
$179,800
According to our research of Arkansas and other state lists, there were 7 registered sex offenders living in 72016 zip code as of May 23, 2024. The ratio of all residents to sex offenders in zip code 72016 is 469 to 1. The ratio of registered sex offenders to all residents in this zip code is near the state average.
Median resident age:
This zip code:
41.0 years
Arkansas median age:
38.9 years
Average household size:
This zip code:
2.6 people
Arkansas:
2.4 people
Averages for the 2020 tax year for zip code 72016, filed in 2021:
Average Adjusted Gross Income (AGI) in 2020: $56,190 (Individual Income Tax Returns)
Here:
$56,190
State:
$64,872
Salary/wage: $52,391 (reported on 78.2% of returns)
Here:
$52,391
State:
$50,644
(% of AGI for various income ranges: 1217.1% for AGIs below $25k, 3582.9% for AGIs $25k-50k, 6623.8% for AGIs $50k-75k, 10620.0% for AGIs $75k-100k, 16164.4% for AGIs $100k-200k)
Taxable interest for individuals: $969 (reported on 21.0% of returns)
This zip code:
$969
Arkansas:
$1,857
(% of AGI for various income ranges: 11.6% for AGIs below $25k, 14.2% for AGIs $25k-50k, 10.8% for AGIs $50k-75k, 20.0% for AGIs $75k-100k, 82.2% for AGIs $100k-200k)
Ordinary dividends: $3,007 (reported on 11.3% of returns)
Here:
$3,007
State:
$21,681
(% of AGI for various income ranges: 12.3% for AGIs below $25k, 16.2% for AGIs $25k-50k, 73.8% for AGIs $75k-100k, 316.7% for AGIs $100k-200k)
Net capital gain/loss in AGI: +$6,700 (reported on 8.9% of returns)
Here:
+$6,700
State:
+$22,815
(% of AGI for various income ranges: 37.1% for AGIs $25k-50k, 108.5% for AGIs $50k-75k, 401.1% for AGIs $100k-200k)
Profit/loss from business: +$10,213 (reported on 18.5% of returns)
Here:
+$10,213
State:
+$9,743
(% of AGI for various income ranges: 162.6% for AGIs below $25k, 217.1% for AGIs $25k-50k, 424.6% for AGIs $50k-75k, 316.2% for AGIs $75k-100k, 576.7% for AGIs $100k-200k)
Taxable individual retirement arrangement distribution: $13,380 (reported on 8.1% of returns)
72016:
$13,380
Arkansas:
$18,502
(% of AGI for various income ranges: 72.3% for AGIs below $25k, 202.9% for AGIs $25k-50k, 783.8% for AGIs $75k-100k)
Total itemized deductions: $28,825 (reported on 3.2% of returns)
Here:
$28,825
State:
$52,840
(% of AGI for various income ranges: 1281.1% for AGIs $100k-200k)
Charity contributions: $17,733 (reported on 2.4% of returns)
Here:
$17,733
State:
$35,735
(% of AGI for various income ranges: 591.1% for AGIs $100k-200k)
Taxes paid: $6,750 (reported on 3.2% of returns)
72016:
$6,750
State:
$7,196
(% of AGI for various income ranges: 300.0% for AGIs $100k-200k)
Earned income credit: $2,350 (reported on 17.7% of returns)
Here:
$2,350
State:
$2,546
(% of AGI for various income ranges: 114.2% for AGIs below $25k, 67.9% for AGIs $25k-50k)
Percentage of individuals using paid preparers for their 2020 taxes: 93.5%
Here:
94%
State:
94%
(% for various income ranges: 93.0% for AGIs below $25k, 93.5% for AGIs $25k-50k, 94.7% for AGIs $50k-75k, 92.3% for AGIs $75k-100k, 93.3% for AGIs $100k-200k, 100.0% for AGIs over 200k)
Averages for the 2012 tax year for zip code 72016, filed in 2013:
Average Adjusted Gross Income (AGI) in 2012: $47,107 (Individual Income Tax Returns)
Here:
$47,107
State:
$52,148
Salary/wage: $42,995 (reported on 83.6% of returns)
Here:
$42,995
State:
$41,669
(% of AGI for various income ranges: 74.5% for AGIs below $25k, 79.8% for AGIs $25k-50k, 79.1% for AGIs $50k-75k, 77.3% for AGIs $75k-100k, 72.0% for AGIs $100k-200k)
Taxable interest for individuals: $575 (reported on 26.2% of returns)
This zip code:
$575
Arkansas:
$1,648
(% of AGI for various income ranges: 1.4% for AGIs below $25k, 0.2% for AGIs $25k-50k, 0.2% for AGIs $50k-75k, 0.1% for AGIs $75k-100k, 0.2% for AGIs $100k-200k)
Ordinary dividends: $1,314 (reported on 11.5% of returns)
Here:
$1,314
State:
$20,675
(% of AGI for various income ranges: 0.9% for AGIs below $25k, 0.3% for AGIs $25k-50k, 0.2% for AGIs $50k-75k, 0.4% for AGIs $100k-200k)
Net capital gain/loss in AGI: +$2,480 (reported on 8.2% of returns)
Here:
+$2,480
State:
+$15,222
(% of AGI for various income ranges: 0.4% for AGIs $25k-50k, 0.2% for AGIs $50k-75k, 1.1% for AGIs $100k-200k)
Profit/loss from business: +$8,143 (reported on 17.2% of returns)
Here:
+$8,143
State:
+$9,665
(% of AGI for various income ranges: 9.8% for AGIs below $25k, 3.0% for AGIs $25k-50k, 5.0% for AGIs $50k-75k, 0.8% for AGIs $100k-200k)
Taxable individual retirement arrangement distribution: $11,033 (reported on 7.4% of returns)
72016:
$11,033
Arkansas:
$13,644
(% of AGI for various income ranges: 2.5% for AGIs below $25k, 4.0% for AGIs $25k-50k, 3.6% for AGIs $75k-100k)
Total itemized deductions: $19,273 (23% of AGI, reported on 24.6% of returns)
Here:
$19,273
State:
$23,276
Here:
22.9% of AGI
State:
19.1% of AGI
(% of AGI for various income ranges: 8.2% for AGIs below $25k, 7.2% for AGIs $25k-50k, 7.6% for AGIs $50k-75k, 12.5% for AGIs $75k-100k, 13.1% for AGIs $100k-200k)
Charity contributions: $4,255 (reported on 18.0% of returns)
Here:
$4,255
State:
$5,996
(% of AGI for various income ranges: 1.5% for AGIs $25k-50k, 1.0% for AGIs $50k-75k, 2.1% for AGIs $75k-100k, 2.5% for AGIs $100k-200k)
Taxes paid: $5,790 (reported on 24.6% of returns)
72016:
$5,790
State:
$7,941
(% of AGI for various income ranges: 0.8% for AGIs below $25k, 1.2% for AGIs $25k-50k, 1.7% for AGIs $50k-75k, 3.5% for AGIs $75k-100k, 5.7% for AGIs $100k-200k)
Earned income credit: $2,423 (reported on 21.3% of returns)
Here:
$2,423
State:
$2,455
(% of AGI for various income ranges: 7.9% for AGIs below $25k, 1.3% for AGIs $25k-50k)
Percentage of individuals using paid preparers for their 2012 taxes: 65.6%
Here:
66%
State:
61%
(% for various income ranges: 63.8% for AGIs below $25k, 65.6% for AGIs $25k-50k, 65.0% for AGIs $50k-75k, 66.7% for AGIs $75k-100k, 72.7% for AGIs $100k-200k)
Averages for the 2004 tax year for zip code 72016, filed in 2005:
Average Adjusted Gross Income (AGI) in 2004: $37,236 (Individual Income Tax Returns)
Here:
$37,236
State:
$39,270
Salary/wage: $36,087 (reported on 85.5% of returns)
Here:
$36,087
State:
$34,079
(% of AGI for various income ranges: 94.5% for AGIs below $10k, 78.7% for AGIs $10k-25k, 87.6% for AGIs $25k-50k, 89.1% for AGIs $50k-75k, 86.0% for AGIs $75k-100k, 66.8% for AGIs over 100k)
Taxable interest for individuals: $772 (reported on 28.6% of returns)
This zip code:
$772
Arkansas:
$1,904
(% of AGI for various income ranges: 6.8% for AGIs below $10k, 1.1% for AGIs $10k-25k, 0.4% for AGIs $25k-50k, 0.3% for AGIs $50k-75k, 0.2% for AGIs $75k-100k, 0.5% for AGIs over 100k)
Taxable dividends: $1,163 (reported on 12.9% of returns)
Here:
$1,163
State:
$5,995
(% of AGI for various income ranges: 3.5% for AGIs below $10k, 0.2% for AGIs $10k-25k, 0.2% for AGIs $25k-50k, 0.2% for AGIs $50k-75k, 0.2% for AGIs $75k-100k, 1.0% for AGIs over 100k)
Net capital gain/loss: +$6,634 (reported on 11.3% of returns)
Here:
+$6,634
State:
+$10,430
(% of AGI for various income ranges: -1.3% for AGIs below $10k, 0.9% for AGIs $10k-25k, 0.7% for AGIs $25k-50k, 0.7% for AGIs $50k-75k, -0.1% for AGIs $75k-100k, 8.4% for AGIs over 100k)
Profit/loss from business: +$5,397 (reported on 20.1% of returns)
Here:
+$5,397
State:
+$7,823
(% of AGI for various income ranges: 23.0% for AGIs below $10k, 6.5% for AGIs $10k-25k, 3.6% for AGIs $25k-50k, 1.6% for AGIs $50k-75k, 1.6% for AGIs $75k-100k)
IRA payment deduction: $2,524 (reported on 1.8% of returns)
72016:
$2,524
Arkansas:
$3,204
Total itemized deductions: $15,201 (23% of AGI, reported on 25.6% of returns)
Here:
$15,201
State:
$18,389
Here:
22.8% of AGI
State:
21.0% of AGI
(% of AGI for various income ranges: 9.4% for AGIs $10k-25k, 8.6% for AGIs $25k-50k, 9.4% for AGIs $50k-75k, 16.0% for AGIs $75k-100k, 12.7% for AGIs over 100k)
Charity contributions deductions: $2,980 (4% of AGI, reported on 21.1% of returns)
Here:
$2,980
State:
$4,725
Here:
4.3% of AGI
State:
5.1% of AGI
(% of AGI for various income ranges: 1.0% for AGIs $10k-25k, 1.2% for AGIs $25k-50k, 1.1% for AGIs $50k-75k, 3.0% for AGIs $75k-100k, 2.9% for AGIs over 100k)
Total tax: $4,406 (reported on 76.3% of returns)
72016:
$4,406
State:
$6,047
(% of AGI for various income ranges: 4.0% for AGIs below $10k, 3.9% for AGIs $10k-25k, 6.3% for AGIs $25k-50k, 8.3% for AGIs $50k-75k, 10.6% for AGIs $75k-100k, 17.1% for AGIs over 100k)
Earned income credit: $1,963 (reported on 20.5% of returns)
Here:
$1,963
State:
$1,909
Percentage of individuals using paid preparers for their 2004 taxes: 65.4%
Here:
65%
State:
67%
(% for various income ranges: 57.1% for AGIs below $10k, 70.4% for AGIs $10k-25k, 67.2% for AGIs $25k-50k, 63.7% for AGIs $50k-75k, 58.6% for AGIs $75k-100k, 70.4% for AGIs over 100k)
Household received Food Stamps/SNAP in the past 12 months: 60 Household did not receive Food Stamps/SNAP in the past 12 months: 1,125
Women who had a birth in the past 12 months: 3 (3 now married, 0 unmarried) Women who did not have a birth in the past 12 months: 700 (380 now married, 320 unmarried)
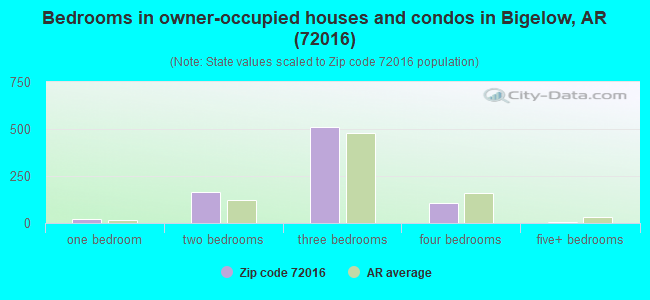
Housing units in zip code 72016 with a mortgage: 401 Houses without a mortgage: 3
Median monthly owner costs for units with a mortgage: $1,116 Median monthly owner costs for units without a mortgage: $330
Residents with income below the poverty level in 2022:
This zip code:
16.4%
Whole state:
16.8%
Residents with income below 50% of the poverty level in 2022:
This zip code:
3.4%
Whole state:
8.5%
Median number of rooms in houses and condos:
Here:
5.9
State:
6.1
Median number of rooms in apartments:
Here:
4.3
State:
4.3
Notable locations in this zip code not listed on our city pages
Cemeteries: Faisst Cemetery (1), Wye Cemetery (2), Casey Cemetery (3), Stony Point Cemetery (4), Saint Francis Cemetery (5). Display/hide their locations on the map
Reservoirs: Jones Lake Number Two (A), Ouachita Creek Watershed Site Three Reservoir (B), Ouachita Creek Watershed Site Two Reservoir (C), Ouachita Creek Watershed Site One Reservoir (D), The Campbells Lake (E), Francis Lake (F). Display/hide their locations on the map
Streams, rivers, and creeks: Lamb Creek (A), Fourche LaFave River (B), West Fork Mill Creek (C), Deerlick Creek (D), Wilhite Branch (E), Taylor Creek (F), Stillhouse Branch (G), Bringle Creek (H), Ouachita Creek (I). Display/hide their locations on the map
Size of family households: 499 2-persons, 106 3-persons, 184 4-persons, 114 5-persons, 24 7-or-more-persons
Size of nonfamily households: 235 1-person, 2 2-persons, 5 4-persons
381 married couples with children.
251 single-parent households (251 women).
93.0% of residents of 72016 zip code speak English at home.
6.4% of residents speak Spanish at home (80% very well, 20% well).
0.2% of residents speak Asian or Pacific Island language at home (100% well).
Foreign born population: 48 (1.6%) (0.0% of them are naturalized citizens)
:
1.6%
Whole state:
5.1%
83%Honduras
12%Malaysia
28%American
11%German
11%English
6%Portuguese
5%Scottish
4%Irish
3%French
Year of entry for the foreign-born population
72010 or later
02000 to 2009
391990 to 1999
15Before 1990
Facilities with environmental interests located in this zip code:
BAY HAWK INDUSTRIES-BIGELOW (415 LANGSTON LOOP in BIGELOW, AR)
STATE MASTER (PDS) - AIR-1827-AOP-R0, AIR MAJOR (Resource Conservation and Recovery Act (tracking hazardous waste)) Organizations: FEWELL BOBBY (CONTACT/OWNER)
Alternative names: BAY HAWK INDUSTRIES INC
ANNE WATSON ELEMENTARY SCHOOL (P.O. BOX 358 in BIGELOW, AR)
(Geographic Names Information System) (National Center for Education Statistics) - STATE ID-5301001 Organizations: EAST END (SCHOOL DISTRICT)
BIGELOW HIGH SCHOOL (P.O. BOX 360 in BIGELOW, AR)
(Geographic Names Information System) (National Center for Education Statistics) - STATE ID-5301002 Organizations: EAST END (SCHOOL DISTRICT)
ANNE WATSON ELEMENTARY SCHOOL (#1 PANTHER DR in BIGELOW, AR)
National Pollutant Discharge Elimination System NON-MAJOR (Tracking pollutant discharge elimination systems) - permit Business SIC classification: ELEMENTARY AND SECONDARY SCHOOLS
BIGELOW WASTEWATER SYSTEM (SEC-8 TWP-4N RNG-15W in BIGELOW, AR)
National Pollutant Discharge Elimination System NON-MAJOR (Tracking pollutant discharge elimination systems) - permit Business SIC classification: SEWERAGE SYSTEMS Alternative names: BIGELOW, CITY OF
BAY HAWK INDUSTRIES INC (HIGHWAY 113 AND CONNIE ROAD in BIGELOW, AR)
AIR MAJOR (AIRS/AFS) Business SIC classification: BOAT BUILDING AND REPAIRING
Housing units lacking complete plumbing facilities: 5.9% Housing units lacking complete kitchen facilities: 5.8%
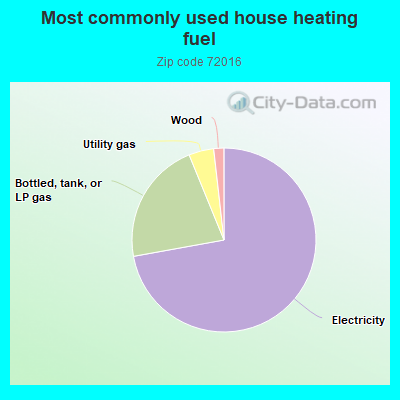
72.3%Electricity
21.7%Bottled, tank, or LP gas
4.4%Utility gas
1.8%Wood
Population in 1990: 2,001. Population change in the 1990s: +1,015 (+50.7%).
Place of birth for U.S.-born residents:
This state: 2,120
Northeast: 13
Midwest: 257
South: 426
West: 197
58% of the 72016 zip code residents lived in the same house 5 years ago. Out of people who lived in different houses, 31% lived in this county. Out of people who lived in different counties, 50% lived in Arkansas.
92% of the 72016 zip code residents lived in the same house 1 year ago. Out of people who lived in different houses, 10% moved from this county. Out of people who lived in different houses, 64% moved from different county within same state. Out of people who lived in different houses, 38% moved from different state.
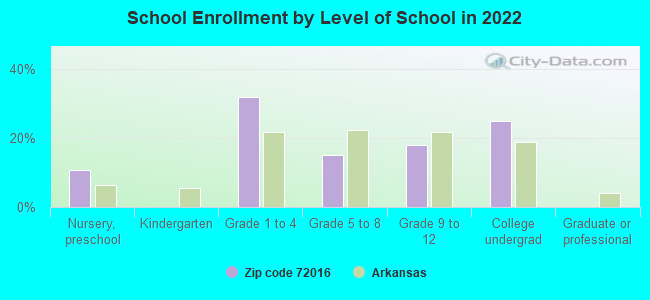
Private vs. public school enrollment:
Students in private schools in grades 1 to 8 (elementary and middle school):
Here:
0.0%
Arkansas:
10.5%
Students in private schools in grades 9 to 12 (high school): 11
Here:
8.9%
Arkansas:
8.7%
Students in private undergraduate colleges:
Here:
0.0%
Arkansas:
19.4%
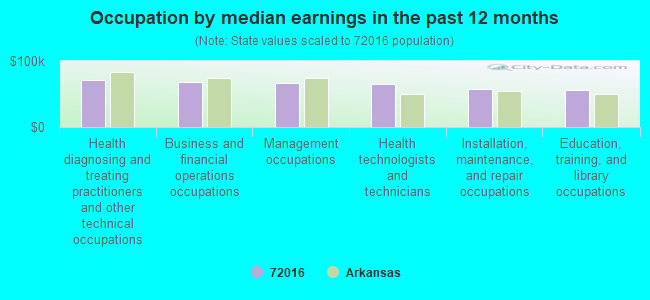
Occupation by median earnings in the past 12 months ($)
71,671Health diagnosing and treating practitioners and other technical occupations
68,326Business and financial operations occupations
67,375Management occupations
64,985Health technologists and technicians
57,276Installation, maintenance, and repair occupations
56,504Education, training, and library occupations
Companies with federal contracts located in this zip code:
KELLOGG TRUCKING (304 ROSS HOLLOW RD in BIGELOW, AR) : $80,495 in 14 contractsfrom 2002 to 2004
Contracts for Operation of Government-Owned Facilities -- Recreation Facilities (Non-Building), Facilities Operations Support Services by Army, U.S. Army Corps of Engineers - civil program financing only Signed by year:2000: $0; 2001: $0; 2002: $5,185; 2003: $28,730; 2004: $46,580; 2005: $0; 2006: $0.
Biggest contracts:
$18,190 with Army for Operation of Government-Owned Facilities -- Recreation Facilities (Non-Building). Signed on 2004-03-10. Completion date: 2002-11-30.
$18,190 with U.S. Army Corps of Engineers - civil program financing only for Operation of Government-Owned Facilities -- Recreation Facilities (Non-Building). Signed on 2004-03-10. Completion date: 2002-11-30.
$18,190, same as above.Signed on 2003-04-01. Completion date: 2002-11-30.
$2,635 with Army for Operation of Government-Owned Facilities -- Recreation Facilities (Non-Building). Signed on 2003-12-08. Completion date: 2002-11-30.
JOHNSON BROTHERS CONSTRUCTION, (329 HIGHWAY 113 SOUTH in BIGELOW, AR; small business) : $22,695 in 2 contractsin 2004
$21,345 with Army for Construction of Structures and Facilities -- Other Utilities. Signed on 2004-02-24. Completion date: 2004-03-05.
$1,350, same as above.Signed on 2004-04-03. Completion date: 2004-03-05.
NELSON Q CARDEN (542 KENNEY RD in BIGELOW, AR; small business)
$19,400 with Army for Construction of Structures and Facilities -- Recreation Facilities (Non-Building). Signed on 2004-06-15. Completion date: 2004-06-21.
Top industries in this zip code by the number of employees in 2005:
Construction: Power and Communication Line and Related Structures Construction (20-49 employees: 1 establishment, 5-9 employees: 1 establishment)
Construction: Water and Sewer Line and Related Structures Construction (5-9: 2, 1-4: 1)
Construction: Commercial and Institutional Building Construction (5-9: 1, 1-4: 1)
Real Estate and Rental and Leasing: Construction, Mining, and Forestry Machinery and Equipment Rental and Leasing (1-4: 3)
Other Services (except Public Administration): Religious Organizations (1-4: 2)
Finance and Insurance: Insurance Agencies and Brokerages (1-4: 2)
Administrative and Support and Waste Management and Remediation Services: Landscaping Services (1-4: 1)
People in group quarters in 2000:
18 people in local jails and other confinement facilities (including police lockups)
Fatal accident statistics in 2013:
Fatal accident count: 1
Vehicles involved in fatal accidents: 1
Fatal accidents caused by drunken drivers: 0
Fatalities: 1
Persons involved in fatal accidents: 2
Pedestrians involved in fatal accidents: 0
Fatal accident statistics in 2010:
Fatal accident count: 1
Vehicles involved in fatal accidents: 1
Fatal accidents caused by drunken drivers: 1
Fatalities: 1
Persons involved in fatal accidents: 2
Pedestrians involved in fatal accidents: 0
Home Mortgage Disclosure Act Aggregated Statistics For Year 2009 (Based on 2 partial tracts)
A) FHA, FSA/RHS & VA Home Purchase Loans
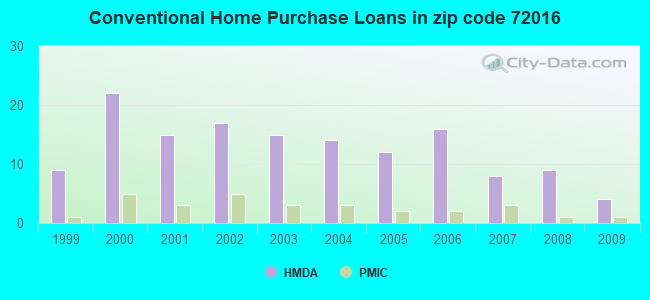
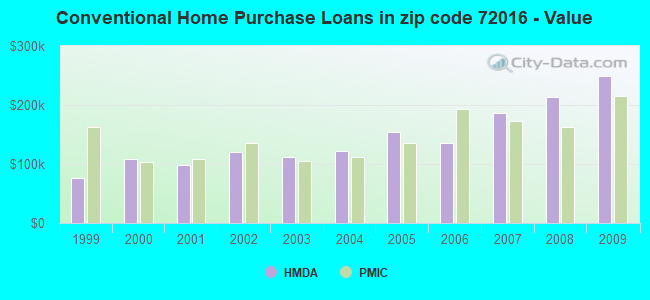
B) Conventional Home Purchase Loans
C) Refinancings
D) Home Improvement Loans
G) Loans On Manufactured Home Dwelling (A B C & D)
Number
Average Value
Number
Average Value
Number
Average Value
Number
Average Value
Number
Average Value
LOANS ORIGINATED
3
$209,723
4
$248,418
24
$188,271
2
$59,645
1
$98,580
APPLICATIONS APPROVED, NOT ACCEPTED
0
$0
1
$137,510
2
$212,485
1
$9,530
0
$0
APPLICATIONS DENIED
1
$126,330
1
$414,200
4
$242,618
2
$95,475
0
$0
APPLICATIONS WITHDRAWN
0
$0
1
$212,900
6
$252,387
0
$0
0
$0
FILES CLOSED FOR INCOMPLETENESS
0
$0
0
$0
2
$108,935
0
$0
0
$0
Aggregated Statistics For Year 2008 (Based on 2 partial tracts)
A) FHA, FSA/RHS & VA Home Purchase Loans
B) Conventional Home Purchase Loans
C) Refinancings
D) Home Improvement Loans
G) Loans On Manufactured Home Dwelling (A B C & D)
Number
Average Value
Number
Average Value
Number
Average Value
Number
Average Value
Number
Average Value
LOANS ORIGINATED
1
$147,040
9
$214,096
15
$179,266
4
$45,975
1
$49,290
APPLICATIONS APPROVED, NOT ACCEPTED
0
$0
0
$0
2
$120,740
1
$10,770
0
$0
APPLICATIONS DENIED
1
$154,910
2
$98,785
9
$202,221
1
$84,080
2
$47,010
APPLICATIONS WITHDRAWN
0
$0
1
$401,360
3
$266,743
0
$0
0
$0
FILES CLOSED FOR INCOMPLETENESS
0
$0
0
$0
2
$155,945
0
$0
0
$0
Aggregated Statistics For Year 2007 (Based on 2 partial tracts)
B) Conventional Home Purchase Loans
C) Refinancings
D) Home Improvement Loans
F) Non-occupant Loans on < 5 Family Dwellings (A B C & D)
G) Loans On Manufactured Home Dwelling (A B C & D)
Number
Average Value
Number
Average Value
Number
Average Value
Number
Average Value
Number
Average Value
LOANS ORIGINATED
8
$187,011
16
$215,876
4
$40,592
3
$121,500
1
$55,920
APPLICATIONS APPROVED, NOT ACCEPTED
2
$139,585
0
$0
1
$28,170
0
$0
1
$106,040
APPLICATIONS DENIED
2
$341,715
6
$128,127
2
$20,505
0
$0
0
$0
APPLICATIONS WITHDRAWN
1
$94,850
5
$134,532
0
$0
0
$0
0
$0
FILES CLOSED FOR INCOMPLETENESS
0
$0
1
$98,170
1
$23,610
0
$0
0
$0
Aggregated Statistics For Year 2006 (Based on 2 partial tracts)
B) Conventional Home Purchase Loans
C) Refinancings
D) Home Improvement Loans
F) Non-occupant Loans on < 5 Family Dwellings (A B C & D)
G) Loans On Manufactured Home Dwelling (A B C & D)
Number
Average Value
Number
Average Value
Number
Average Value
Number
Average Value
Number
Average Value
LOANS ORIGINATED
16
$136,091
15
$178,797
5
$73,148
2
$135,030
2
$59,025
APPLICATIONS APPROVED, NOT ACCEPTED
2
$134,410
2
$144,140
1
$147,040
0
$0
1
$21,950
APPLICATIONS DENIED
2
$60,475
7
$232,544
2
$5,385
0
$0
2
$68,755
APPLICATIONS WITHDRAWN
1
$190,950
6
$213,865
0
$0
0
$0
0
$0
FILES CLOSED FOR INCOMPLETENESS
0
$0
2
$234,230
0
$0
0
$0
0
$0
Aggregated Statistics For Year 2005 (Based on 2 partial tracts)
A) FHA, FSA/RHS & VA Home Purchase Loans
B) Conventional Home Purchase Loans
C) Refinancings
D) Home Improvement Loans
F) Non-occupant Loans on < 5 Family Dwellings (A B C & D)
G) Loans On Manufactured Home Dwelling (A B C & D)
Number
Average Value
Number
Average Value
Number
Average Value
Number
Average Value
Number
Average Value
Number
Average Value
LOANS ORIGINATED
2
$90,710
12
$153,565
19
$156,241
6
$64,408
1
$227,810
2
$53,430
APPLICATIONS APPROVED, NOT ACCEPTED
0
$0
2
$163,610
1
$87,400
0
$0
0
$0
1
$76,210
APPLICATIONS DENIED
0
$0
5
$73,894
8
$169,252
2
$30,235
0
$0
2
$49,705
APPLICATIONS WITHDRAWN
1
$53,850
1
$64,620
7
$187,514
2
$126,125
0
$0
1
$86,570
FILES CLOSED FOR INCOMPLETENESS
0
$0
0
$0
1
$336,740
0
$0
0
$0
0
$0
Aggregated Statistics For Year 2004 (Based on 2 partial tracts)
A) FHA, FSA/RHS & VA Home Purchase Loans
B) Conventional Home Purchase Loans
C) Refinancings
D) Home Improvement Loans
F) Non-occupant Loans on < 5 Family Dwellings (A B C & D)
G) Loans On Manufactured Home Dwelling (A B C & D)
Number
Average Value
Number
Average Value
Number
Average Value
Number
Average Value
Number
Average Value
Number
Average Value
LOANS ORIGINATED
2
$78,905
14
$122,721
21
$144,615
2
$29,615
3
$62,267
3
$45,563
APPLICATIONS APPROVED, NOT ACCEPTED
0
$0
2
$50,325
5
$267,242
0
$0
0
$0
2
$32,100
APPLICATIONS DENIED
0
$0
2
$184,525
8
$191,154
1
$29,410
0
$0
1
$55,920
APPLICATIONS WITHDRAWN
0
$0
1
$103,550
6
$180,453
1
$46,800
0
$0
0
$0
FILES CLOSED FOR INCOMPLETENESS
0
$0
0
$0
1
$315,210
0
$0
0
$0
0
$0
Aggregated Statistics For Year 2003 (Based on 2 partial tracts)
A) FHA, FSA/RHS & VA Home Purchase Loans
B) Conventional Home Purchase Loans
C) Refinancings
D) Home Improvement Loans
F) Non-occupant Loans on < 5 Family Dwellings (A B C & D)
Number
Average Value
Number
Average Value
Number
Average Value
Number
Average Value
Number
Average Value
LOANS ORIGINATED
1
$132,960
15
$111,945
49
$130,803
3
$79,803
2
$35,415
APPLICATIONS APPROVED, NOT ACCEPTED
0
$0
2
$90,090
11
$106,035
0
$0
0
$0
APPLICATIONS DENIED
0
$0
2
$58,400
16
$182,921
2
$7,665
2
$44,320
APPLICATIONS WITHDRAWN
0
$0
2
$110,590
9
$223,253
1
$17,400
0
$0
FILES CLOSED FOR INCOMPLETENESS
0
$0
0
$0
1
$102,720
0
$0
0
$0
Aggregated Statistics For Year 2002 (Based on 2 partial tracts)
A) FHA, FSA/RHS & VA Home Purchase Loans
B) Conventional Home Purchase Loans
C) Refinancings
D) Home Improvement Loans
F) Non-occupant Loans on < 5 Family Dwellings (A B C & D)
Number
Average Value
Number
Average Value
Number
Average Value
Number
Average Value
Number
Average Value
LOANS ORIGINATED
4
$86,672
17
$119,826
44
$150,213
5
$27,172
4
$67,515
APPLICATIONS APPROVED, NOT ACCEPTED
0
$0
3
$68,620
5
$133,786
2
$50,530
0
$0
APPLICATIONS DENIED
0
$0
9
$67,837
12
$116,701
1
$32,720
1
$40,180
APPLICATIONS WITHDRAWN
0
$0
2
$172,515
6
$92,850
1
$20,710
1
$51,360
FILES CLOSED FOR INCOMPLETENESS
0
$0
0
$0
1
$125,920
0
$0
0
$0
Aggregated Statistics For Year 2001 (Based on 2 partial tracts)
A) FHA, FSA/RHS & VA Home Purchase Loans
B) Conventional Home Purchase Loans
C) Refinancings
D) Home Improvement Loans
F) Non-occupant Loans on < 5 Family Dwellings (A B C & D)
Number
Average Value
Number
Average Value
Number
Average Value
Number
Average Value
Number
Average Value
LOANS ORIGINATED
2
$101,685
15
$97,751
36
$133,338
4
$33,655
2
$65,030
APPLICATIONS APPROVED, NOT ACCEPTED
0
$0
2
$78,700
2
$268,610
1
$19,470
0
$0
APPLICATIONS DENIED
0
$0
6
$40,660
16
$121,179
3
$12,150
1
$45,980
APPLICATIONS WITHDRAWN
0
$0
0
$0
10
$104,088
0
$0
0
$0
FILES CLOSED FOR INCOMPLETENESS
0
$0
0
$0
5
$152,426
0
$0
0
$0
Aggregated Statistics For Year 2000 (Based on 2 partial tracts)
A) FHA, FSA/RHS & VA Home Purchase Loans
B) Conventional Home Purchase Loans
C) Refinancings
D) Home Improvement Loans
F) Non-occupant Loans on < 5 Family Dwellings (A B C & D)
Number
Average Value
Number
Average Value
Number
Average Value
Number
Average Value
Number
Average Value
LOANS ORIGINATED
1
$110,180
22
$108,181
13
$128,529
5
$18,390
1
$143,730
APPLICATIONS APPROVED, NOT ACCEPTED
0
$0
10
$40,964
5
$185,230
0
$0
0
$0
APPLICATIONS DENIED
2
$51,775
21
$47,100
18
$96,601
4
$22,470
2
$27,545
APPLICATIONS WITHDRAWN
1
$50,530
2
$72,690
8
$118,461
1
$28,990
0
$0
FILES CLOSED FOR INCOMPLETENESS
0
$0
0
$0
4
$94,438
0
$0
0
$0
Aggregated Statistics For Year 1999 (Based on 1 partial tract)
A) FHA, FSA/RHS & VA Home Purchase Loans
B) Conventional Home Purchase Loans
C) Refinancings
D) Home Improvement Loans
F) Non-occupant Loans on < 5 Family Dwellings (A B C & D)
Detailed PMIC statistics for the following Tracts:0042.01
2004 - 2018 National Fire Incident Reporting System (NFIRS) incidents
Based on the data from the years 2004 - 2018 the average number of fire incidents per year is 30. The highest number of reported fire incidents - 46 took place in 2008, and the least - 10 in 2004. The data has an increasing trend.
When looking into fire subcategories, the most reports belonged to: Outside Fires (61.1%), and Structure Fires (29.4%).
Fire incident types reported to NFIRS in Zip Code 72016


 Nearest zip codes: 72070, 72106, 72135, 72034, 72125, 72107.


 Based on the data from the years 2004 - 2018 the average number of fire incidents per year is 30. The highest number of reported fire incidents - 46 took place in 2008, and the least - 10 in 2004. The data has an increasing trend.
 When looking into fire subcategories, the most reports belonged to: Outside Fires (61.1%), and Structure Fires (29.4%).