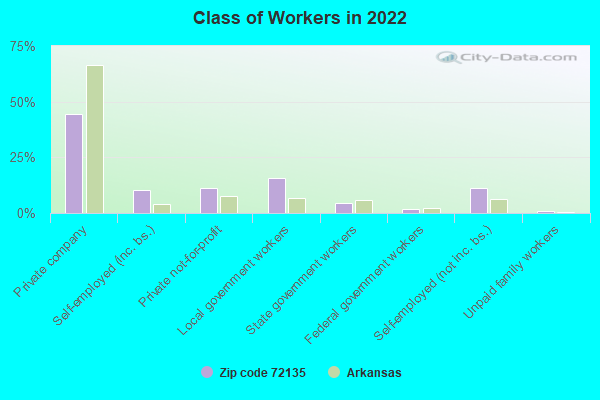
Estimated zip code population in 2022: 3,273 Zip code population in 2010: 2,623 Zip code population in 2000: 2,646
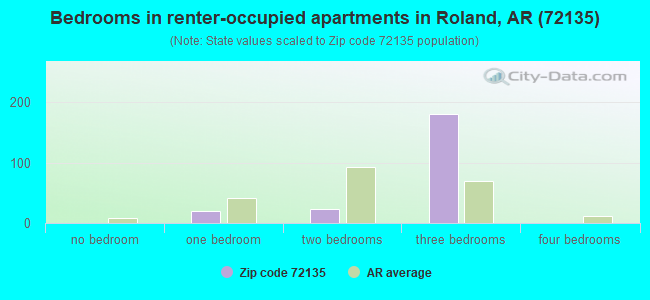
Houses and condos: 1,496 Renter-occupied apartments: 234
% of renters here:
16%
State:
34%
March 2022 cost of living index in zip code 72135: 80.0 (low, U.S. average is 100)
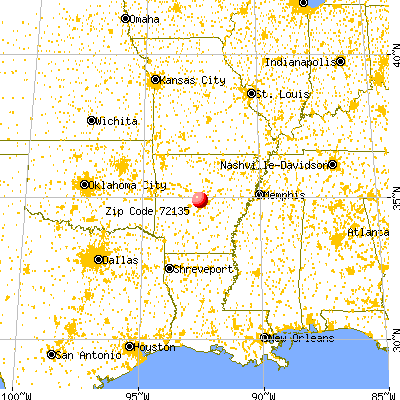
Land area: 71.0 sq. mi. Water area: 13.8 sq. mi.
Population density: 46 people per square mile
(very low).
OSM Map
General Map
Google Map
MSN Map
OSM Map
General Map
Google Map
MSN Map
OSM Map
General Map
Google Map
MSN Map
OSM Map
General Map
Google Map
MSN Map
Please wait while loading the map...
Real estate property taxes paid for housing units in 2022:
This zip code:
0.4% ($1,143)
Arkansas:
0.5% ($977)
Median real estate property taxes paid for housing units with mortgages in 2022: $1,818 (0.4%) Median real estate property taxes paid for housing units with no mortgage in 2022: $716 (0.4%)
Business Search- 14 Million verified businesses
Males: 1,579
(48.2%)
Females: 1,694
(51.8%)
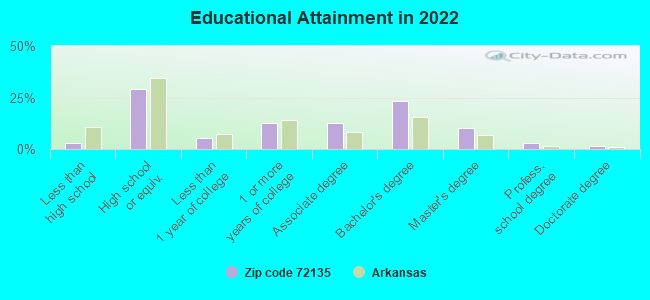
For population 25 years and over in 72135:
High school or higher: 98.3%
Bachelor's degree or higher: 37.7%
Graduate or professional degree: 14.3%
Unemployed: 4.8%
Mean travel time to work (commute): 30.4 minutes
For population 15 years and over in 72135:
Never married: 13.2%
Now married: 67.0%
Separated: 0.0%
Widowed: 9.0%
Divorced: 10.8%
Zip code 72135 compared to state average:
Median household income above state average.
Median house value above state average.
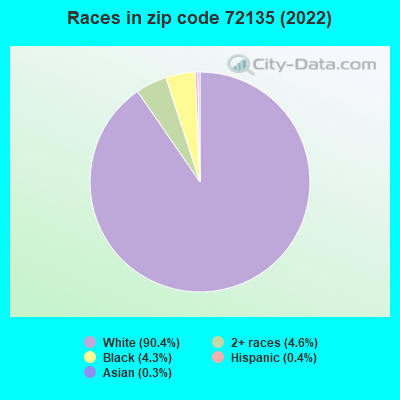
Black race population percentage significantly below state average.
Hispanic race population percentage significantly below state average.
Median age significantly above state average.
Foreign-born population percentage significantly below state average.
Renting percentage below state average.
Number of college students below state average.
Percentage of population with a bachelor's degree or higher above state average.
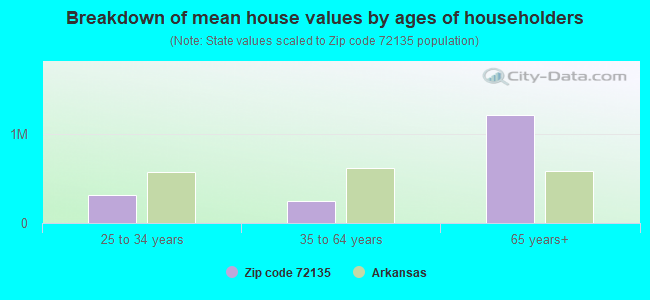
Estimated median house/condo value in 2022: $298,154
72135:
$298,154
Arkansas:
$179,800
According to our research of Arkansas and other state lists, there were 2 registered sex offenders living in 72135 zip code as of May 22, 2024. The ratio of all residents to sex offenders in zip code 72135 is 1,253 to 1. The ratio of registered sex offenders to all residents in this zip code is much lower than the state average.
Median resident age:
This zip code:
51.4 years
Arkansas median age:
38.9 years
Average household size:
This zip code:
2.3 people
Arkansas:
2.4 people
Averages for the 2020 tax year for zip code 72135, filed in 2021:
Average Adjusted Gross Income (AGI) in 2020: $135,214 (Individual Income Tax Returns)
Here:
$135,214
State:
$64,872
Salary/wage: $89,532 (reported on 75.8% of returns)
Here:
$89,532
State:
$50,644
(% of AGI for various income ranges: 1115.8% for AGIs below $25k, 3734.7% for AGIs $25k-50k, 6607.0% for AGIs $50k-75k, 8992.9% for AGIs $75k-100k, 17353.3% for AGIs $100k-200k, 83930.0% for AGIs over 200k)
Taxable interest for individuals: $1,885 (reported on 42.7% of returns)
This zip code:
$1,885
Arkansas:
$1,857
(% of AGI for various income ranges: 20.0% for AGIs below $25k, 31.8% for AGIs $25k-50k, 64.0% for AGIs $50k-75k, 57.1% for AGIs $75k-100k, 132.5% for AGIs $100k-200k, 1288.0% for AGIs over 200k)
Ordinary dividends: $12,897 (reported on 29.8% of returns)
Here:
$12,897
State:
$21,681
(% of AGI for various income ranges: 65.8% for AGIs below $25k, 82.4% for AGIs $25k-50k, 88.0% for AGIs $50k-75k, 127.1% for AGIs $75k-100k, 590.0% for AGIs $100k-200k, 7244.0% for AGIs over 200k)
Net capital gain/loss in AGI: +$14,485 (reported on 26.6% of returns)
Here:
+$14,485
State:
+$22,815
(% of AGI for various income ranges: 6.8% for AGIs below $25k, 9.4% for AGIs $25k-50k, 115.0% for AGIs $50k-75k, 227.1% for AGIs $75k-100k, 504.2% for AGIs $100k-200k, 7744.0% for AGIs over 200k)
Profit/loss from business: +$12,927 (reported on 21.0% of returns)
Here:
+$12,927
State:
+$9,743
(% of AGI for various income ranges: 158.9% for AGIs below $25k, 223.5% for AGIs $25k-50k, 232.0% for AGIs $50k-75k, 544.3% for AGIs $75k-100k, 598.3% for AGIs $100k-200k, 2696.0% for AGIs over 200k)
Taxable individual retirement arrangement distribution: $24,129 (reported on 13.7% of returns)
72135:
$24,129
Arkansas:
$18,502
(% of AGI for various income ranges: 108.4% for AGIs below $25k, 144.1% for AGIs $25k-50k, 469.0% for AGIs $50k-75k, 694.3% for AGIs $75k-100k, 1333.3% for AGIs $100k-200k, 2192.0% for AGIs over 200k)
Total itemized deductions: $42,668 (reported on 15.3% of returns)
Here:
$42,668
State:
$52,840
(% of AGI for various income ranges: 314.2% for AGIs below $25k, 743.0% for AGIs $50k-75k, 1065.0% for AGIs $100k-200k, 10978.0% for AGIs over 200k)
Charity contributions: $20,161 (reported on 14.5% of returns)
Here:
$20,161
State:
$35,735
(% of AGI for various income ranges: 317.0% for AGIs $50k-75k, 430.8% for AGIs $100k-200k, 5590.0% for AGIs over 200k)
Taxes paid: $8,353 (reported on 15.3% of returns)
72135:
$8,353
State:
$7,196
(% of AGI for various income ranges: 30.0% for AGIs below $25k, 168.0% for AGIs $50k-75k, 275.8% for AGIs $100k-200k, 2062.0% for AGIs over 200k)
Earned income credit: $2,079 (reported on 11.3% of returns)
Here:
$2,079
State:
$2,546
(% of AGI for various income ranges: 84.7% for AGIs below $25k, 76.5% for AGIs $25k-50k)
Percentage of individuals using paid preparers for their 2020 taxes: 89.5%
Here:
90%
State:
94%
(% for various income ranges: 87.1% for AGIs below $25k, 88.0% for AGIs $25k-50k, 93.8% for AGIs $50k-75k, 91.7% for AGIs $75k-100k, 87.5% for AGIs $100k-200k, 93.8% for AGIs over 200k)
Averages for the 2012 tax year for zip code 72135, filed in 2013:
Average Adjusted Gross Income (AGI) in 2012: $81,868 (Individual Income Tax Returns)
Here:
$81,868
State:
$52,148
Salary/wage: $62,820 (reported on 83.2% of returns)
Here:
$62,820
State:
$41,669
(% of AGI for various income ranges: 78.3% for AGIs below $25k, 74.7% for AGIs $25k-50k, 72.1% for AGIs $50k-75k, 69.3% for AGIs $75k-100k, 69.6% for AGIs $100k-200k, 53.1% for AGIs over 200k)
Taxable interest for individuals: $1,425 (reported on 40.8% of returns)
This zip code:
$1,425
Arkansas:
$1,648
(% of AGI for various income ranges: 1.2% for AGIs below $25k, 0.6% for AGIs $25k-50k, 0.4% for AGIs $50k-75k, 0.6% for AGIs $75k-100k, 0.7% for AGIs $100k-200k, 0.8% for AGIs over 200k)
Ordinary dividends: $4,517 (reported on 23.2% of returns)
Here:
$4,517
State:
$20,675
(% of AGI for various income ranges: 0.8% for AGIs below $25k, 1.3% for AGIs $25k-50k, 0.4% for AGIs $50k-75k, 0.9% for AGIs $75k-100k, 1.5% for AGIs $100k-200k, 1.5% for AGIs over 200k)
Net capital gain/loss in AGI: +$9,564 (reported on 20.0% of returns)
Here:
+$9,564
State:
+$15,222
(% of AGI for various income ranges: 1.0% for AGIs $25k-50k, 0.1% for AGIs $50k-75k, 0.6% for AGIs $100k-200k, 5.1% for AGIs over 200k)
Profit/loss from business: +$15,152 (reported on 20.0% of returns)
Here:
+$15,152
State:
+$9,665
(% of AGI for various income ranges: 9.8% for AGIs below $25k, 5.5% for AGIs $25k-50k, 4.2% for AGIs $50k-75k, 4.1% for AGIs $75k-100k, 4.9% for AGIs $100k-200k, 1.7% for AGIs over 200k)
Taxable individual retirement arrangement distribution: $23,531 (reported on 10.4% of returns)
72135:
$23,531
Arkansas:
$13,644
(% of AGI for various income ranges: 3.3% for AGIs $25k-50k, 5.8% for AGIs $50k-75k, 3.8% for AGIs $100k-200k, 2.7% for AGIs over 200k)
Total itemized deductions: $30,466 (20% of AGI, reported on 40.0% of returns)
Here:
$30,466
State:
$23,276
Here:
19.6% of AGI
State:
19.1% of AGI
(% of AGI for various income ranges: 8.0% for AGIs below $25k, 11.6% for AGIs $25k-50k, 14.0% for AGIs $50k-75k, 14.4% for AGIs $75k-100k, 15.7% for AGIs $100k-200k, 16.2% for AGIs over 200k)
Charity contributions: $7,770 (reported on 35.2% of returns)
Here:
$7,770
State:
$5,996
(% of AGI for various income ranges: 1.2% for AGIs below $25k, 2.4% for AGIs $25k-50k, 2.8% for AGIs $50k-75k, 2.8% for AGIs $75k-100k, 3.2% for AGIs $100k-200k, 4.1% for AGIs over 200k)
Taxes paid: $12,394 (reported on 40.0% of returns)
72135:
$12,394
State:
$7,941
(% of AGI for various income ranges: 1.0% for AGIs below $25k, 2.3% for AGIs $25k-50k, 3.6% for AGIs $50k-75k, 4.6% for AGIs $75k-100k, 6.1% for AGIs $100k-200k, 8.4% for AGIs over 200k)
Earned income credit: $2,040 (reported on 12.0% of returns)
Here:
$2,040
State:
$2,455
(% of AGI for various income ranges: 4.6% for AGIs below $25k, 0.8% for AGIs $25k-50k)
Percentage of individuals using paid preparers for their 2012 taxes: 52.0%
Here:
52%
State:
61%
(% for various income ranges: 45.0% for AGIs below $25k, 48.3% for AGIs $25k-50k, 47.1% for AGIs $50k-75k, 60.0% for AGIs $75k-100k, 57.9% for AGIs $100k-200k, 80.0% for AGIs over 200k)
Averages for the 2004 tax year for zip code 72135, filed in 2005:
Average Adjusted Gross Income (AGI) in 2004: $62,219 (Individual Income Tax Returns)
Here:
$62,219
State:
$39,270
Salary/wage: $52,847 (reported on 84.7% of returns)
Here:
$52,847
State:
$34,079
(% of AGI for various income ranges: 92.4% for AGIs below $10k, 77.9% for AGIs $10k-25k, 81.2% for AGIs $25k-50k, 77.3% for AGIs $50k-75k, 77.4% for AGIs $75k-100k, 66.1% for AGIs over 100k)
Taxable interest for individuals: $1,366 (reported on 46.3% of returns)
This zip code:
$1,366
Arkansas:
$1,904
(% of AGI for various income ranges: 4.3% for AGIs below $10k, 1.7% for AGIs $10k-25k, 1.3% for AGIs $25k-50k, 1.7% for AGIs $50k-75k, 0.7% for AGIs $75k-100k, 0.7% for AGIs over 100k)
Taxable dividends: $1,893 (reported on 25.8% of returns)
Here:
$1,893
State:
$5,995
(% of AGI for various income ranges: 1.3% for AGIs below $10k, 0.3% for AGIs $10k-25k, 0.5% for AGIs $25k-50k, 1.2% for AGIs $50k-75k, 1.3% for AGIs $75k-100k, 0.7% for AGIs over 100k)
Net capital gain/loss: +$16,387 (reported on 21.1% of returns)
Here:
+$16,387
State:
+$10,430
(% of AGI for various income ranges: -1.3% for AGIs below $10k, -0.4% for AGIs $10k-25k, -0.0% for AGIs $25k-50k, 1.3% for AGIs $50k-75k, 3.7% for AGIs $75k-100k, 9.2% for AGIs over 100k)
Profit/loss from business: +$13,288 (reported on 20.0% of returns)
Here:
+$13,288
State:
+$7,823
(% of AGI for various income ranges: 2.4% for AGIs below $10k, 8.8% for AGIs $10k-25k, 5.3% for AGIs $25k-50k, 4.8% for AGIs $50k-75k, 3.0% for AGIs $75k-100k, 3.7% for AGIs over 100k)
IRA payment deduction: $3,421 (reported on 3.2% of returns)
72135:
$3,421
Arkansas:
$3,204
Total itemized deductions: $22,447 (19% of AGI, reported on 41.2% of returns)
Here:
$22,447
State:
$18,389
Here:
19.4% of AGI
State:
21.0% of AGI
(% of AGI for various income ranges: 9.2% for AGIs $10k-25k, 10.4% for AGIs $25k-50k, 16.0% for AGIs $50k-75k, 18.6% for AGIs $75k-100k, 15.7% for AGIs over 100k)
Charity contributions deductions: $5,727 (5% of AGI, reported on 36.7% of returns)
Here:
$5,727
State:
$4,725
Here:
4.7% of AGI
State:
5.1% of AGI
(% of AGI for various income ranges: 1.6% for AGIs $10k-25k, 2.1% for AGIs $25k-50k, 2.9% for AGIs $50k-75k, 3.5% for AGIs $75k-100k, 4.0% for AGIs over 100k)
Total tax: $11,103 (reported on 77.4% of returns)
72135:
$11,103
State:
$6,047
(% of AGI for various income ranges: 2.9% for AGIs below $10k, 4.9% for AGIs $10k-25k, 6.9% for AGIs $25k-50k, 9.7% for AGIs $50k-75k, 10.2% for AGIs $75k-100k, 18.5% for AGIs over 100k)
Earned income credit: $1,611 (reported on 13.5% of returns)
Here:
$1,611
State:
$1,909
Percentage of individuals using paid preparers for their 2004 taxes: 57.4%
Here:
57%
State:
67%
(% for various income ranges: 44.5% for AGIs below $10k, 57.1% for AGIs $10k-25k, 58.4% for AGIs $25k-50k, 57.8% for AGIs $50k-75k, 61.5% for AGIs $75k-100k, 68.4% for AGIs over 100k)
Household received Food Stamps/SNAP in the past 12 months: 11 Household did not receive Food Stamps/SNAP in the past 12 months: 1,453
Women who had a birth in the past 12 months: 12 (13 now married, 0 unmarried) Women who did not have a birth in the past 12 months: 520 (267 now married, 252 unmarried)
Housing units in zip code 72135 with a mortgage: 640 (13 second mortgage, 12 both second mortgage and home equity loan) Median monthly owner costs for units with a mortgage: $2,025 Median monthly owner costs for units without a mortgage: $389
Residents with income below the poverty level in 2022:
This zip code:
3.2%
Whole state:
16.8%
Residents with income below 50% of the poverty level in 2022:
This zip code:
3.2%
Whole state:
8.5%
Median number of rooms in houses and condos:
Here:
6.0
State:
6.1
Median number of rooms in apartments:
Here:
5.3
State:
4.3
Notable locations in this zip code not listed on our city pages
Notable locations in zip code 72135: Jolly Roger Landing (A), West Pulaski Fire Department Station 3 (B), Lake Maumelle Fire Department (C), Lake Maumelle Volunteer Fire Department District 8 Station 1 (D), Lake Maumelle Volunteer Fire Department District 8 Station 2 (E). Display/hide their locations on the map
Cemeteries: Kennerly Cemetery (1), Guenther Cemetery (2), Rainey Cemetery (3), Pleasant Grove Cemetery (4), Browns Valley of Rest Cemetery (5). Display/hide their locations on the map
Streams, rivers, and creeks: Neal Creek (A), Mill Bayou (B), Worthen Creek (C), Dead Horse Branch (D), Kinley Creek (E), Nowlin Creek (F), Twin Creek (G). Display/hide their locations on the map
Size of family households: 655 2-persons, 54 3-persons, 289 4-persons, 40 5-persons
Size of nonfamily households: 406 1-person, 8 2-persons
558 married couples with children.
78 single-parent households (78 women).
99.6% of residents of 72135 zip code speak English at home.
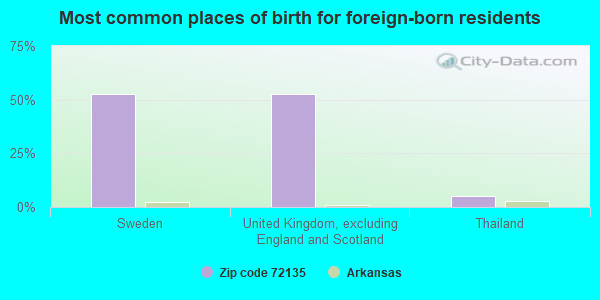
Foreign born population: 19 (0.6%) (100.0% of them are naturalized citizens)
This zip code:
0.6%
Whole state:
5.1%
53%Sweden
53%United Kingdom, excluding England and Scotland
5%Thailand
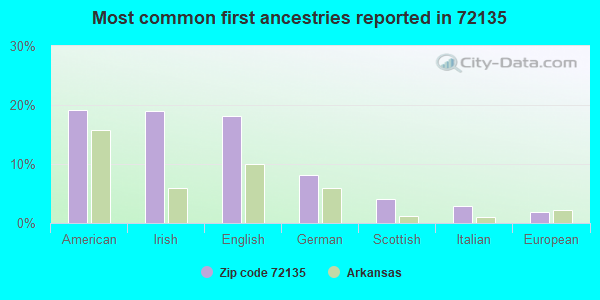
19%American
19%Irish
18%English
8%German
4%Scottish
3%Italian
2%European
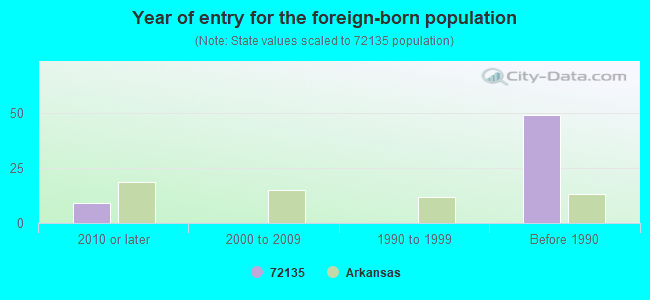
Year of entry for the foreign-born population
92010 or later
02000 to 2009
01990 to 1999
49Before 1990
Facilities with environmental interests located in this zip code:
ALOTIAN CLUB TREATMENT PLANT (101 ALOTIAN DRIVE in ROLAND, AR)
National Pollutant Discharge Elimination System NON-MAJOR (Tracking pollutant discharge elimination systems) - permit Business SIC classification: MEMBERSHIP SPORTS AND RECREATION CLUBS Alternative names: ALOTIAN GOLF, LLC
Housing units lacking complete plumbing facilities: 0.6% Housing units lacking complete kitchen facilities: 1.4%
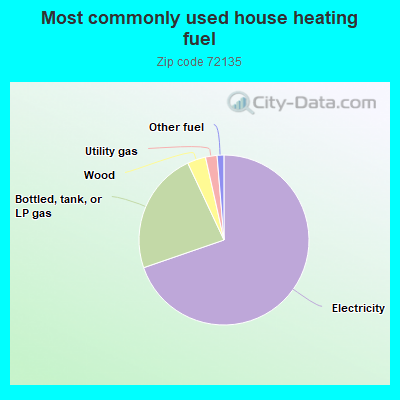
69.8%Electricity
23.3%Bottled, tank, or LP gas
3.5%Wood
2.2%Utility gas
1.3%Other fuel
Population in 1990: 1,824. Population change in the 1990s: +822 (+45.1%).
Place of birth for U.S.-born residents:
This state: 2,389
Northeast: 86
Midwest: 205
South: 393
West: 119
62% of the 72135 zip code residents lived in the same house 5 years ago. Out of people who lived in different houses, 76% lived in this county. Out of people who lived in different counties, 50% lived in Arkansas.
97% of the 72135 zip code residents lived in the same house 1 year ago. Out of people who lived in different houses, 69% moved from this county. Out of people who lived in different houses, 38% moved from different state.
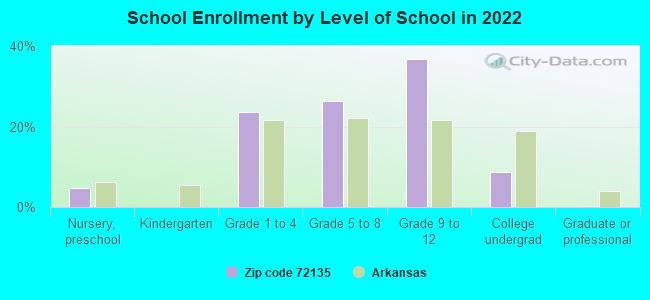
Private vs. public school enrollment:
Students in private schools in grades 1 to 8 (elementary and middle school): 83
Here:
28.5%
Arkansas:
10.5%
Students in private schools in grades 9 to 12 (high school): 153
Here:
70.7%
Arkansas:
8.7%
Students in private undergraduate colleges: 6
Here:
13.0%
Arkansas:
19.4%
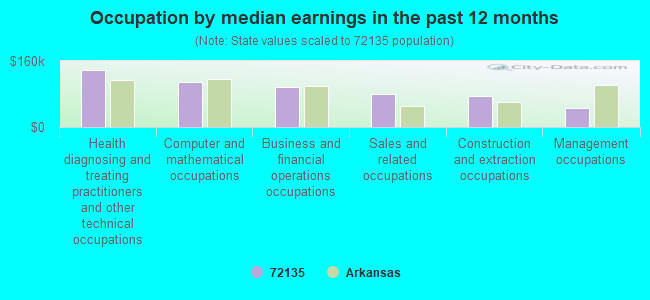
Occupation by median earnings in the past 12 months ($)
137,599Health diagnosing and treating practitioners and other technical occupations
108,377Computer and mathematical occupations
97,830Business and financial operations occupations
80,496Sales and related occupations
76,146Construction and extraction occupations
46,162Management occupations
Companies with federal contracts located in this zip code:
COMMERCIAL INTERIOR CONTRACTOR (13300 BART MORELAND DR in ROLAND, AR; small business)
$2,599 with Army for Maintenance, Repair or Alteration of Real Property -- Office Buildings. Signed on 2002-06-07. Completion date: 2002-08-30.
Top industries in this zip code by the number of employees in 2005:
Arts, Entertainment, and Recreation: Golf Courses and Country Clubs (50-99 employees: 1 establishment)
Construction: New Single-Family Housing Construction (except Operative Builders) (10-19: 1, 1-4: 4)
Finance and Insurance: Insurance Agencies and Brokerages (5-9: 1, 1-4: 1)
Construction: Residential Remodelers (1-4: 4)
Other Services (except Public Administration): Religious Organizations (1-4: 4)
Professional, Scientific, and Technical Services: Payroll Services (5-9: 1)
Health Care and Social Assistance: Offices of Physicians (except Mental Health Specialists) (1-4: 3)
Construction: Painting and Wall Covering Contractors (1-4: 3)
Fatal accident statistics in 2011:
Fatal accident count: 1
Vehicles involved in fatal accidents: 1
Fatal accidents caused by drunken drivers: 0
Fatalities: 1
Persons involved in fatal accidents: 1
Pedestrians involved in fatal accidents: 0
Home Mortgage Disclosure Act Aggregated Statistics For Year 2009 (Based on 10 partial tracts)
A) FHA, FSA/RHS & VA Home Purchase Loans
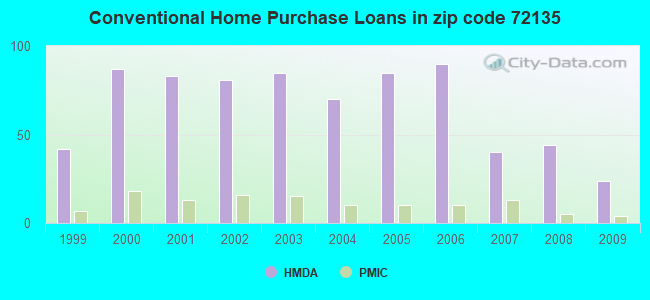
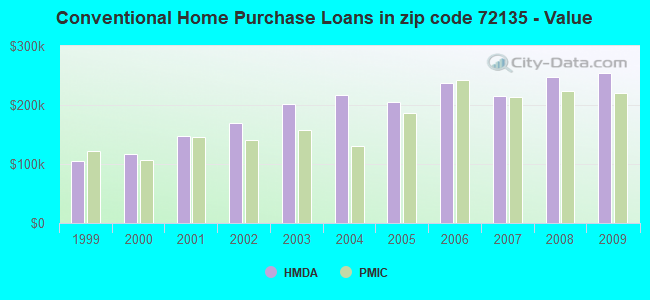
B) Conventional Home Purchase Loans
C) Refinancings
D) Home Improvement Loans
F) Non-occupant Loans on < 5 Family Dwellings (A B C & D)
G) Loans On Manufactured Home Dwelling (A B C & D)
Number
Average Value
Number
Average Value
Number
Average Value
Number
Average Value
Number
Average Value
Number
Average Value
LOANS ORIGINATED
20
$183,922
24
$253,878
166
$239,294
16
$60,975
5
$289,274
7
$59,579
APPLICATIONS APPROVED, NOT ACCEPTED
0
$0
2
$192,925
13
$197,259
2
$13,365
1
$36,960
1
$126,680
APPLICATIONS DENIED
7
$186,863
7
$369,626
35
$326,193
11
$63,222
1
$76,140
2
$31,785
APPLICATIONS WITHDRAWN
1
$260,200
6
$429,245
34
$235,329
1
$22,180
1
$308,250
1
$77,620
FILES CLOSED FOR INCOMPLETENESS
1
$141,930
1
$1,043,010
11
$242,122
0
$0
0
$0
0
$0
Aggregated Statistics For Year 2008 (Based on 10 partial tracts)
A) FHA, FSA/RHS & VA Home Purchase Loans
B) Conventional Home Purchase Loans
C) Refinancings
D) Home Improvement Loans
F) Non-occupant Loans on < 5 Family Dwellings (A B C & D)
G) Loans On Manufactured Home Dwelling (A B C & D)
Number
Average Value
Number
Average Value
Number
Average Value
Number
Average Value
Number
Average Value
Number
Average Value
LOANS ORIGINATED
6
$119,398
44
$247,146
94
$242,402
24
$56,890
6
$85,190
7
$52,177
APPLICATIONS APPROVED, NOT ACCEPTED
2
$129,260
2
$58,835
8
$165,176
3
$11,797
1
$59,270
3
$49,080
APPLICATIONS DENIED
3
$144,887
10
$94,097
42
$284,212
7
$65,173
2
$95,010
5
$52,764
APPLICATIONS WITHDRAWN
0
$0
3
$432,557
16
$308,550
1
$31,380
0
$0
0
$0
FILES CLOSED FOR INCOMPLETENESS
0
$0
0
$0
9
$149,721
2
$38,810
0
$0
0
$0
Aggregated Statistics For Year 2007 (Based on 10 partial tracts)
A) FHA, FSA/RHS & VA Home Purchase Loans
B) Conventional Home Purchase Loans
C) Refinancings
D) Home Improvement Loans
F) Non-occupant Loans on < 5 Family Dwellings (A B C & D)
G) Loans On Manufactured Home Dwelling (A B C & D)
Number
Average Value
Number
Average Value
Number
Average Value
Number
Average Value
Number
Average Value
Number
Average Value
LOANS ORIGINATED
3
$109,390
40
$215,328
86
$247,133
23
$47,962
13
$139,116
3
$66,343
APPLICATIONS APPROVED, NOT ACCEPTED
2
$86,615
7
$122,463
5
$181,160
6
$29,065
2
$166,320
4
$92,860
APPLICATIONS DENIED
1
$48,050
17
$477,314
31
$284,188
8
$37,575
3
$143,203
4
$72,628
APPLICATIONS WITHDRAWN
0
$0
7
$381,643
21
$213,570
0
$0
0
$0
0
$0
FILES CLOSED FOR INCOMPLETENESS
0
$0
1
$195,250
6
$244,752
3
$22,083
0
$0
1
$17,430
Aggregated Statistics For Year 2006 (Based on 10 partial tracts)
A) FHA, FSA/RHS & VA Home Purchase Loans
B) Conventional Home Purchase Loans
C) Refinancings
D) Home Improvement Loans
F) Non-occupant Loans on < 5 Family Dwellings (A B C & D)
G) Loans On Manufactured Home Dwelling (A B C & D)
Number
Average Value
Number
Average Value
Number
Average Value
Number
Average Value
Number
Average Value
Number
Average Value
LOANS ORIGINATED
2
$147,890
90
$236,513
93
$295,213
30
$67,693
13
$110,545
10
$54,190
APPLICATIONS APPROVED, NOT ACCEPTED
1
$263,890
14
$228,486
8
$199,518
3
$163,400
1
$32,540
3
$31,867
APPLICATIONS DENIED
1
$40,660
20
$252,107
40
$320,682
9
$6,889
1
$58,110
10
$51,595
APPLICATIONS WITHDRAWN
1
$228,950
9
$495,248
28
$254,200
1
$221,760
0
$0
0
$0
FILES CLOSED FOR INCOMPLETENESS
0
$0
1
$182,580
11
$260,346
1
$381,200
1
$58,110
0
$0
Aggregated Statistics For Year 2005 (Based on 10 partial tracts)
A) FHA, FSA/RHS & VA Home Purchase Loans
B) Conventional Home Purchase Loans
C) Refinancings
D) Home Improvement Loans
F) Non-occupant Loans on < 5 Family Dwellings (A B C & D)
G) Loans On Manufactured Home Dwelling (A B C & D)
Number
Average Value
Number
Average Value
Number
Average Value
Number
Average Value
Number
Average Value
Number
Average Value
LOANS ORIGINATED
7
$113,799
85
$205,375
112
$225,194
35
$59,641
6
$141,277
12
$47,225
APPLICATIONS APPROVED, NOT ACCEPTED
0
$0
10
$182,883
12
$302,317
1
$136,750
3
$203,527
3
$71,280
APPLICATIONS DENIED
0
$0
23
$142,423
45
$279,379
8
$27,216
1
$3,700
9
$41,341
APPLICATIONS WITHDRAWN
2
$75,545
10
$145,568
34
$285,145
5
$148,948
3
$141,873
3
$80,967
FILES CLOSED FOR INCOMPLETENESS
0
$0
2
$165,970
6
$409,792
0
$0
0
$0
1
$73,220
Aggregated Statistics For Year 2004 (Based on 10 partial tracts)
A) FHA, FSA/RHS & VA Home Purchase Loans
B) Conventional Home Purchase Loans
C) Refinancings
D) Home Improvement Loans
F) Non-occupant Loans on < 5 Family Dwellings (A B C & D)
G) Loans On Manufactured Home Dwelling (A B C & D)
Number
Average Value
Number
Average Value
Number
Average Value
Number
Average Value
Number
Average Value
Number
Average Value
LOANS ORIGINATED
8
$84,918
70
$217,501
114
$200,185
17
$43,084
16
$81,269
11
$50,054
APPLICATIONS APPROVED, NOT ACCEPTED
1
$166,190
13
$145,796
24
$266,575
2
$314,575
1
$116,790
9
$39,646
APPLICATIONS DENIED
2
$148,825
16
$253,354
46
$263,858
4
$182,330
3
$122,363
9
$46,672
APPLICATIONS WITHDRAWN
0
$0
9
$180,370
29
$293,254
4
$97,698
3
$525,237
2
$48,540
FILES CLOSED FOR INCOMPLETENESS
0
$0
0
$0
9
$259,909
1
$77,620
0
$0
0
$0
Aggregated Statistics For Year 2003 (Based on 10 partial tracts)
A) FHA, FSA/RHS & VA Home Purchase Loans
B) Conventional Home Purchase Loans
C) Refinancings
D) Home Improvement Loans
F) Non-occupant Loans on < 5 Family Dwellings (A B C & D)
Number
Average Value
Number
Average Value
Number
Average Value
Number
Average Value
Number
Average Value
LOANS ORIGINATED
9
$131,799
85
$201,609
272
$171,393
18
$56,991
12
$80,132
APPLICATIONS APPROVED, NOT ACCEPTED
2
$78,220
10
$157,740
42
$108,846
3
$74,167
2
$84,455
APPLICATIONS DENIED
3
$119,173
13
$69,620
62
$203,881
6
$19,363
8
$41,438
APPLICATIONS WITHDRAWN
1
$110,140
12
$156,684
41
$212,528
3
$24,893
0
$0
FILES CLOSED FOR INCOMPLETENESS
0
$0
0
$0
5
$98,892
0
$0
1
$110,410
Aggregated Statistics For Year 2002 (Based on 10 partial tracts)
A) FHA, FSA/RHS & VA Home Purchase Loans
B) Conventional Home Purchase Loans
C) Refinancings
D) Home Improvement Loans
F) Non-occupant Loans on < 5 Family Dwellings (A B C & D)
Number
Average Value
Number
Average Value
Number
Average Value
Number
Average Value
Number
Average Value
LOANS ORIGINATED
16
$102,008
81
$170,338
243
$175,787
25
$33,906
17
$159,672
APPLICATIONS APPROVED, NOT ACCEPTED
0
$0
13
$76,502
24
$196,140
7
$47,374
1
$218,490
APPLICATIONS DENIED
3
$72,670
34
$70,017
42
$128,475
6
$26,143
3
$37,577
APPLICATIONS WITHDRAWN
2
$111,760
8
$132,010
27
$133,266
2
$29,055
2
$72,055
FILES CLOSED FOR INCOMPLETENESS
1
$107,920
3
$108,693
8
$110,322
0
$0
0
$0
Aggregated Statistics For Year 2001 (Based on 10 partial tracts)
A) FHA, FSA/RHS & VA Home Purchase Loans
B) Conventional Home Purchase Loans
C) Refinancings
D) Home Improvement Loans
F) Non-occupant Loans on < 5 Family Dwellings (A B C & D)
Number
Average Value
Number
Average Value
Number
Average Value
Number
Average Value
Number
Average Value
LOANS ORIGINATED
11
$100,126
83
$148,194
184
$159,911
18
$27,185
11
$76,049
APPLICATIONS APPROVED, NOT ACCEPTED
0
$0
10
$86,372
11
$240,387
5
$13,734
1
$106,920
APPLICATIONS DENIED
3
$67,490
25
$75,755
70
$177,278
11
$15,144
6
$58,337
APPLICATIONS WITHDRAWN
3
$97,867
7
$147,717
40
$116,203
0
$0
0
$0
FILES CLOSED FOR INCOMPLETENESS
0
$0
0
$0
15
$155,179
0
$0
1
$60,430
Aggregated Statistics For Year 2000 (Based on 10 partial tracts)
A) FHA, FSA/RHS & VA Home Purchase Loans
B) Conventional Home Purchase Loans
C) Refinancings
D) Home Improvement Loans
F) Non-occupant Loans on < 5 Family Dwellings (A B C & D)
Number
Average Value
Number
Average Value
Number
Average Value
Number
Average Value
Number
Average Value
LOANS ORIGINATED
5
$99,084
87
$116,353
65
$134,312
25
$18,126
7
$121,711
APPLICATIONS APPROVED, NOT ACCEPTED
0
$0
30
$49,673
20
$157,617
1
$54,700
2
$14,790
APPLICATIONS DENIED
5
$58,110
67
$47,623
65
$119,333
17
$19,140
10
$50,717
APPLICATIONS WITHDRAWN
3
$75,600
9
$62,163
27
$110,970
4
$25,882
0
$0
FILES CLOSED FOR INCOMPLETENESS
1
$90,650
1
$118,270
13
$93,531
0
$0
1
$41,840
Aggregated Statistics For Year 1999 (Based on 5 partial tracts)
A) FHA, FSA/RHS & VA Home Purchase Loans
B) Conventional Home Purchase Loans
C) Refinancings
D) Home Improvement Loans
F) Non-occupant Loans on < 5 Family Dwellings (A B C & D)
Detailed PMIC statistics for the following Tracts:0042.01
, 0042.02
2003 - 2018 National Fire Incident Reporting System (NFIRS) incidents
Based on the data from the years 2003 - 2018 the average number of fire incidents per year is 25. The highest number of reported fire incidents - 45 took place in 2017, and the least - 9 in 2009. The data has an increasing trend.
When looking into fire subcategories, the most reports belonged to: Outside Fires (57.3%), and Structure Fires (28.5%).
Fire incident types reported to NFIRS in Zip Code 72135


 Nearest zip codes: 72223, 72106, 72016, 72113, 72212, 72210.


 Based on the data from the years 2003 - 2018 the average number of fire incidents per year is 25. The highest number of reported fire incidents - 45 took place in 2017, and the least - 9 in 2009. The data has an increasing trend.
 When looking into fire subcategories, the most reports belonged to: Outside Fires (57.3%), and Structure Fires (28.5%).