Estimated zip code population in 2022: 764 Zip code population in 2010: 969 Zip code population in 2000: 878
Houses and condos: 332 Renter-occupied apartments: 23
% of renters here:
8%
State:
34%
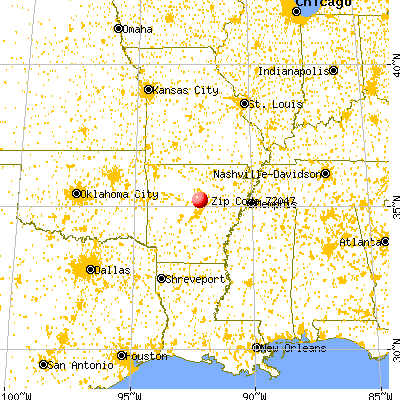
March 2022 cost of living index in zip code 72047: 79.3 (low, U.S. average is 100)
Land area: 31.5 sq. mi. Water area: 0.0 sq. mi.
Population density: 24 people per square mile
(very low).
OSM Map
General Map
Google Map
MSN Map
OSM Map
General Map
Google Map
MSN Map
OSM Map
General Map
Google Map
MSN Map
OSM Map
General Map
Google Map
MSN Map
Please wait while loading the map...
Real estate property taxes paid for housing units in 2022:
This zip code:
0.3% ($751)
Arkansas:
0.5% ($977)
Median real estate property taxes paid for housing units with mortgages in 2022: $737 (0.4%) Median real estate property taxes paid for housing units with no mortgage in 2022: $842 (0.3%)
Business Search- 14 Million verified businesses
Males: 385
(50.4%)
Females: 379
(49.6%)
For population 25 years and over in 72047:
High school or higher: 93.3%
Bachelor's degree or higher: 14.7%
Graduate or professional degree: 7.5%
Unemployed: 0.2%
Mean travel time to work (commute): 32.3 minutes
For population 15 years and over in 72047:
Never married: 30.4%
Now married: 51.4%
Separated: 1.2%
Widowed: 8.0%
Divorced: 9.0%
Zip code 72047 compared to state average:
Unemployed percentage significantly below state average.
Black race population percentage significantly below state average.
Hispanic race population percentage significantly below state average.
Foreign-born population percentage significantly below state average.
Renting percentage significantly below state average.
Length of stay since moving in significantly below state average.
House age below state average.
Percentage of population with a bachelor's degree or higher below state average.
Estimated median house/condo value in 2022: $215,007
72047:
$215,007
Arkansas:
$179,800
According to our research of Arkansas and other state lists, there were 2 registered sex offenders living in 72047 zip code as of May 28, 2024. The ratio of all residents to sex offenders in zip code 72047 is 442 to 1. The ratio of registered sex offenders to all residents in this zip code is near the state average.
Median resident age:
This zip code:
34.9 years
Arkansas median age:
38.9 years
Average household size:
This zip code:
2.5 people
Arkansas:
2.4 people
Averages for the 2020 tax year for zip code 72047, filed in 2021:
Average Adjusted Gross Income (AGI) in 2020: $56,118 (Individual Income Tax Returns)
Here:
$56,118
State:
$64,872
Salary/wage: $55,311 (reported on 80.0% of returns)
Here:
$55,311
State:
$50,644
(% of AGI for various income ranges: 981.0% for AGIs below $25k, 3518.9% for AGIs $25k-50k, 6565.7% for AGIs $50k-75k, 9115.0% for AGIs $75k-100k, 18805.0% for AGIs $100k-200k)
Taxable interest for individuals: $278 (reported on 20.0% of returns)
This zip code:
$278
Arkansas:
$1,857
(% of AGI for various income ranges: 18.0% for AGIs below $25k, 2.9% for AGIs $50k-75k, 12.5% for AGIs $100k-200k)
Ordinary dividends: $600 (reported on 6.7% of returns)
Here:
$600
State:
$21,681
(% of AGI for various income ranges: 25.7% for AGIs $50k-75k)
Net capital gain/loss in AGI: +$2,175 (reported on 8.9% of returns)
Here:
+$2,175
State:
+$22,815
(% of AGI for various income ranges: 217.5% for AGIs $75k-100k)
Profit/loss from business: +$5,600 (reported on 17.8% of returns)
Here:
+$5,600
State:
+$9,743
(% of AGI for various income ranges: 186.0% for AGIs below $25k, 141.1% for AGIs $25k-50k, 337.5% for AGIs $75k-100k)
Taxable individual retirement arrangement distribution: $23,300 (reported on 4.4% of returns)
72047:
$23,300
Arkansas:
$18,502
(% of AGI for various income ranges: 517.8% for AGIs $25k-50k)
Earned income credit: $2,756 (reported on 20.0% of returns)
Here:
$2,756
State:
$2,546
(% of AGI for various income ranges: 154.0% for AGIs below $25k, 104.4% for AGIs $25k-50k)
Percentage of individuals using paid preparers for their 2020 taxes: 91.1%
Here:
91%
State:
94%
(% for various income ranges: 92.3% for AGIs below $25k, 90.9% for AGIs $25k-50k, 88.9% for AGIs $50k-75k, 100.0% for AGIs $75k-100k, 85.7% for AGIs $100k-200k)
Averages for the 2012 tax year for zip code 72047, filed in 2013:
Average Adjusted Gross Income (AGI) in 2012: $45,805 (Individual Income Tax Returns)
Here:
$45,805
State:
$52,148
Salary/wage: $44,062 (reported on 87.2% of returns)
Here:
$44,062
State:
$41,669
(% of AGI for various income ranges: 67.6% for AGIs below $25k, 91.7% for AGIs $25k-50k, 87.3% for AGIs $50k-75k, 81.9% for AGIs $75k-100k, 82.9% for AGIs $100k-200k)
Taxable interest for individuals: $418 (reported on 28.2% of returns)
This zip code:
$418
Arkansas:
$1,648
(% of AGI for various income ranges: 0.2% for AGIs below $25k, 0.7% for AGIs $25k-50k, 0.1% for AGIs $50k-75k, 0.2% for AGIs $75k-100k)
Ordinary dividends: $600 (reported on 10.3% of returns)
Here:
$600
State:
$20,675
Net capital gain/loss in AGI: +$150 (reported on 10.3% of returns)
Here:
+$150
State:
+$15,222
Profit/loss from business: +$4,943 (reported on 17.9% of returns)
Here:
+$4,943
State:
+$9,665
Total itemized deductions: $17,790 (21% of AGI, reported on 25.6% of returns)
Here:
$17,790
State:
$23,276
Here:
20.6% of AGI
State:
19.1% of AGI
(% of AGI for various income ranges: 10.9% for AGIs $25k-50k, 7.4% for AGIs $50k-75k, 12.4% for AGIs $75k-100k, 14.5% for AGIs $100k-200k)
Charity contributions: $3,086 (reported on 17.9% of returns)
Here:
$3,086
State:
$5,996
(% of AGI for various income ranges: 2.7% for AGIs below $25k, 1.9% for AGIs $50k-75k, 1.8% for AGIs $100k-200k)
Taxes paid: $5,790 (reported on 25.6% of returns)
72047:
$5,790
State:
$7,941
(% of AGI for various income ranges: 2.3% for AGIs $25k-50k, 2.2% for AGIs $50k-75k, 4.0% for AGIs $75k-100k, 5.9% for AGIs $100k-200k)
Earned income credit: $2,743 (reported on 17.9% of returns)
Here:
$2,743
State:
$2,455
(% of AGI for various income ranges: 7.3% for AGIs below $25k, 1.1% for AGIs $25k-50k)
Percentage of individuals using paid preparers for their 2012 taxes: 79.5%
Here:
79%
State:
61%
(% for various income ranges: 80.0% for AGIs below $25k, 70.0% for AGIs $25k-50k, 85.7% for AGIs $50k-75k, 75.0% for AGIs $75k-100k, 100.0% for AGIs $100k-200k)
Averages for the 2004 tax year for zip code 72047, filed in 2005:
Average Adjusted Gross Income (AGI) in 2004: $31,477 (Individual Income Tax Returns)
Here:
$31,477
State:
$39,270
Salary/wage: $33,215 (reported on 85.0% of returns)
Here:
$33,215
State:
$34,079
(% of AGI for various income ranges: 119.4% for AGIs below $10k, 79.0% for AGIs $10k-25k, 88.2% for AGIs $25k-50k, 92.8% for AGIs $50k-75k, 93.3% for AGIs $75k-100k)
Taxable interest for individuals: $706 (reported on 27.3% of returns)
This zip code:
$706
Arkansas:
$1,904
(% of AGI for various income ranges: 6.2% for AGIs below $10k, 1.3% for AGIs $10k-25k, 0.6% for AGIs $25k-50k, 0.1% for AGIs $50k-75k, 0.1% for AGIs $75k-100k)
Taxable dividends: $212 (reported on 8.8% of returns)
Here:
$212
State:
$5,995
Net capital gain/loss: +$710 (reported on 8.3% of returns)
Here:
+$710
State:
+$10,430
Profit/loss from business: +$2,820 (reported on 16.4% of returns)
Here:
+$2,820
State:
+$7,823
Total itemized deductions: $14,358 (24% of AGI, reported on 18.0% of returns)
Here:
$14,358
State:
$18,389
Here:
24.2% of AGI
State:
21.0% of AGI
Charity contributions deductions: $2,667 (4% of AGI, reported on 12.9% of returns)
Here:
$2,667
State:
$4,725
Here:
4.1% of AGI
State:
5.1% of AGI
Total tax: $2,903 (reported on 71.6% of returns)
72047:
$2,903
State:
$6,047
(% of AGI for various income ranges: 2.9% for AGIs below $10k, 4.0% for AGIs $10k-25k, 4.9% for AGIs $25k-50k, 7.4% for AGIs $50k-75k, 11.2% for AGIs $75k-100k)
Earned income credit: $1,932 (reported on 23.6% of returns)
Here:
$1,932
State:
$1,909
Percentage of individuals using paid preparers for their 2004 taxes: 71.8%
Here:
72%
State:
67%
(% for various income ranges: 64.3% for AGIs below $10k, 73.7% for AGIs $10k-25k, 71.2% for AGIs $25k-50k, 71.9% for AGIs $50k-75k, 87.5% for AGIs $75k-100k)
Likely homosexual households (counted as self-reported same-sex unmarried-partner households)
Lesbian couples: 0.0% of all households
Gay men: 0.4% of all households
Household received Food Stamps/SNAP in the past 12 months: 8 Household did not receive Food Stamps/SNAP in the past 12 months: 297
Women who had a birth in the past 12 months: 17 (17 now married, 0 unmarried) Women who did not have a birth in the past 12 months: 237 (111 now married, 126 unmarried)
Housing units in zip code 72047 with a mortgage: 168 (25 second mortgage, 15 home equity loan, 6 both second mortgage and home equity loan) Median monthly owner costs for units with a mortgage: $1,188 Median monthly owner costs for units without a mortgage: $289
Residents with income below the poverty level in 2022:
This zip code:
16.4%
Whole state:
16.8%
Residents with income below 50% of the poverty level in 2022:
This zip code:
0.4%
Whole state:
8.5%
Median number of rooms in houses and condos:
Here:
5.6
State:
6.1
Median number of rooms in apartments:
Here:
5.6
State:
4.3
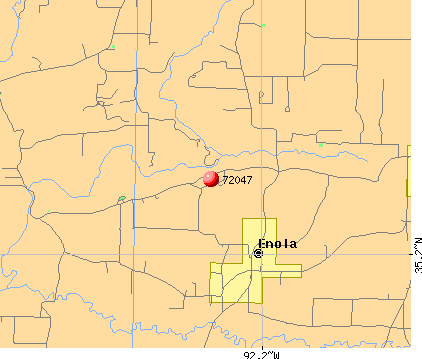
Notable locations in this zip code not listed on our city pages
Churches in zip code 72047 include: Mount Zion Baptist Church (A), Crossroads Church (B), Marcus Hill Church (C), The Church of Jesus Christ of Latter Day Saints (D), Barney Church of Christ (E). Display/hide their locations on the map
Streams, rivers, and creeks: White Oak Branch (A), Turkey Creek (B), Cardin Branch (C), Caney Creek (D), Bailey Branch (E). Display/hide their locations on the map
Size of family households: 70 2-persons, 36 3-persons, 49 4-persons, 29 5-persons, 7 7-or-more-persons
Size of nonfamily households: 95 1-person, 13 2-persons
143 married couples with children.
98 single-parent households (44 men, 54 women).
99.5% of residents of 72047 zip code speak English at home.
Foreign born population: 0 (0.0%)
:
0.0%
Whole state:
5.1%
10%English
4%American
3%German
1%Irish
0%Italian
0%Northern European
Year of entry for the foreign-born population
02010 or later
02000 to 2009
01990 to 1999
23Before 1990
Facilities with environmental interests located in this zip code:
AIRGAS, AIR SEPARATION DIV. (500 INDUSTRIAL PARK DRIVE in MULBERRY, AR)
National Pollutant Discharge Elimination System NON-MAJOR (Tracking pollutant discharge elimination systems) - permit Business SIC classification: INDUSTRIAL GASES
Housing units lacking complete plumbing facilities: 2.2%
71.8%Electricity
17.2%Utility gas
10.3%Wood
1.4%Bottled, tank, or LP gas
Population in 1990: 500. Population change in the 1990s: +378 (+75.6%).
Place of birth for U.S.-born residents:
This state: 608
Northeast: 1
Midwest: 47
South: 53
West: 22
53% of the 72047 zip code residents lived in the same house 5 years ago. Out of people who lived in different houses, 71% lived in this county. Out of people who lived in different counties, 50% lived in Arkansas.
96% of the 72047 zip code residents lived in the same house 1 year ago. Out of people who lived in different houses, 71% moved from this county. Out of people who lived in different houses, 12% moved from different county within same state. Out of people who lived in different houses, 12% moved from different state.
Private vs. public school enrollment:
Students in private schools in grades 1 to 8 (elementary and middle school): 7
Here:
8.2%
Arkansas:
10.5%
Students in private schools in grades 9 to 12 (high school):
Here:
0.0%
Arkansas:
8.7%
Students in private undergraduate colleges: 7
Here:
16.0%
Arkansas:
19.4%
Occupation by median earnings in the past 12 months ($)
61,485Construction and extraction occupations
54,794Installation, maintenance, and repair occupations
52,808Sales and related occupations
48,411Production occupations
40,526Office and administrative support occupations
40,159Education, training, and library occupations
Top industries in this zip code by the number of employees in 2005:
Construction: Drywall and Insulation Contractors (5-9 employees: 1 establishment)
Construction: Poured Concrete Foundation and Structure Contractors (5-9: 1)
Construction: Electrical Contractors (1-4: 2)
Construction: New Single-Family Housing Construction (except Operative Builders) (1-4: 2)
Other Services (except Public Administration): Consumer Electronics Repair and Maintenance (1-4: 1)
Home Mortgage Disclosure Act Aggregated Statistics For Year 2009 (Based on 2 partial tracts)
A) FHA, FSA/RHS & VA Home Purchase Loans
B) Conventional Home Purchase Loans
C) Refinancings
D) Home Improvement Loans
F) Non-occupant Loans on < 5 Family Dwellings (A B C & D)
G) Loans On Manufactured Home Dwelling (A B C & D)
Number
Average Value
Number
Average Value
Number
Average Value
Number
Average Value
Number
Average Value
Number
Average Value
LOANS ORIGINATED
14
$120,075
12
$104,339
38
$128,553
4
$52,655
3
$45,080
11
$50,108
APPLICATIONS APPROVED, NOT ACCEPTED
0
$0
1
$71,850
1
$155,670
1
$14,790
0
$0
1
$44,020
APPLICATIONS DENIED
1
$64,800
6
$61,812
16
$147,638
2
$59,520
1
$93,330
6
$55,002
APPLICATIONS WITHDRAWN
1
$97,910
2
$93,155
9
$135,049
1
$97,910
0
$0
0
$0
FILES CLOSED FOR INCOMPLETENESS
1
$71,850
0
$0
1
$185,610
0
$0
0
$0
0
$0
Aggregated Statistics For Year 2008 (Based on 2 partial tracts)
A) FHA, FSA/RHS & VA Home Purchase Loans
B) Conventional Home Purchase Loans
C) Refinancings
D) Home Improvement Loans
F) Non-occupant Loans on < 5 Family Dwellings (A B C & D)
G) Loans On Manufactured Home Dwelling (A B C & D)
Number
Average Value
Number
Average Value
Number
Average Value
Number
Average Value
Number
Average Value
Number
Average Value
LOANS ORIGINATED
10
$134,928
11
$85,456
24
$127,335
6
$23,245
6
$63,337
9
$55,139
APPLICATIONS APPROVED, NOT ACCEPTED
1
$49,310
6
$55,295
1
$121,160
0
$0
0
$0
6
$66,390
APPLICATIONS DENIED
3
$102,607
6
$110,003
13
$114,872
3
$23,127
1
$61,640
7
$61,383
APPLICATIONS WITHDRAWN
1
$177,510
1
$172,580
4
$169,232
0
$0
0
$0
0
$0
FILES CLOSED FOR INCOMPLETENESS
0
$0
0
$0
2
$134,895
0
$0
0
$0
1
$18,310
Aggregated Statistics For Year 2007 (Based on 2 partial tracts)
A) FHA, FSA/RHS & VA Home Purchase Loans
B) Conventional Home Purchase Loans
C) Refinancings
D) Home Improvement Loans
F) Non-occupant Loans on < 5 Family Dwellings (A B C & D)
G) Loans On Manufactured Home Dwelling (A B C & D)
Number
Average Value
Number
Average Value
Number
Average Value
Number
Average Value
Number
Average Value
Number
Average Value
LOANS ORIGINATED
5
$113,902
24
$104,853
24
$115,874
4
$16,818
6
$101,785
14
$66,817
APPLICATIONS APPROVED, NOT ACCEPTED
0
$0
2
$84,880
4
$102,755
0
$0
0
$0
2
$68,680
APPLICATIONS DENIED
1
$122,920
14
$73,811
13
$90,624
5
$20,216
1
$77,480
11
$50,493
APPLICATIONS WITHDRAWN
0
$0
3
$120,803
6
$102,138
0
$0
1
$11,270
1
$89,110
FILES CLOSED FOR INCOMPLETENESS
0
$0
0
$0
1
$89,810
0
$0
0
$0
0
$0
Aggregated Statistics For Year 2006 (Based on 2 partial tracts)
A) FHA, FSA/RHS & VA Home Purchase Loans
B) Conventional Home Purchase Loans
C) Refinancings
D) Home Improvement Loans
F) Non-occupant Loans on < 5 Family Dwellings (A B C & D)
G) Loans On Manufactured Home Dwelling (A B C & D)
Number
Average Value
Number
Average Value
Number
Average Value
Number
Average Value
Number
Average Value
Number
Average Value
LOANS ORIGINATED
7
$113,107
23
$79,536
25
$112,436
7
$47,597
5
$78,752
12
$54,004
APPLICATIONS APPROVED, NOT ACCEPTED
0
$0
5
$65,368
5
$69,594
1
$42,970
2
$82,415
5
$46,914
APPLICATIONS DENIED
1
$127,500
13
$64,588
14
$93,384
2
$11,095
1
$66,920
14
$53,384
APPLICATIONS WITHDRAWN
1
$157,790
4
$100,730
7
$116,024
0
$0
0
$0
0
$0
FILES CLOSED FOR INCOMPLETENESS
1
$38,740
1
$77,130
3
$102,607
0
$0
0
$0
0
$0
Aggregated Statistics For Year 2005 (Based on 2 partial tracts)
A) FHA, FSA/RHS & VA Home Purchase Loans
B) Conventional Home Purchase Loans
C) Refinancings
D) Home Improvement Loans
F) Non-occupant Loans on < 5 Family Dwellings (A B C & D)
G) Loans On Manufactured Home Dwelling (A B C & D)
Number
Average Value
Number
Average Value
Number
Average Value
Number
Average Value
Number
Average Value
Number
Average Value
LOANS ORIGINATED
3
$102,960
19
$86,641
26
$97,288
4
$13,825
6
$46,315
11
$51,581
APPLICATIONS APPROVED, NOT ACCEPTED
0
$0
2
$70,970
4
$66,565
0
$0
0
$0
2
$55,295
APPLICATIONS DENIED
1
$67,620
9
$60,970
13
$78,378
4
$31,082
0
$0
7
$48,000
APPLICATIONS WITHDRAWN
1
$82,060
6
$87,110
14
$149,936
1
$29,940
2
$93,335
2
$65,685
FILES CLOSED FOR INCOMPLETENESS
0
$0
1
$85,580
2
$100,375
0
$0
0
$0
0
$0
Aggregated Statistics For Year 2004 (Based on 2 partial tracts)
A) FHA, FSA/RHS & VA Home Purchase Loans
B) Conventional Home Purchase Loans
C) Refinancings
D) Home Improvement Loans
F) Non-occupant Loans on < 5 Family Dwellings (A B C & D)
G) Loans On Manufactured Home Dwelling (A B C & D)
Number
Average Value
Number
Average Value
Number
Average Value
Number
Average Value
Number
Average Value
Number
Average Value
LOANS ORIGINATED
5
$114,184
18
$73,023
33
$97,880
6
$36,922
5
$86,922
9
$44,926
APPLICATIONS APPROVED, NOT ACCEPTED
0
$0
3
$72,083
4
$68,150
0
$0
0
$0
2
$45,960
APPLICATIONS DENIED
2
$93,155
17
$53,804
15
$74,643
3
$19,020
3
$67,037
15
$40,268
APPLICATIONS WITHDRAWN
1
$104,250
3
$108,127
8
$109,226
0
$0
1
$58,470
0
$0
FILES CLOSED FOR INCOMPLETENESS
0
$0
0
$0
1
$153,560
0
$0
0
$0
0
$0
Aggregated Statistics For Year 2003 (Based on 2 partial tracts)
A) FHA, FSA/RHS & VA Home Purchase Loans
B) Conventional Home Purchase Loans
C) Refinancings
D) Home Improvement Loans
F) Non-occupant Loans on < 5 Family Dwellings (A B C & D)
Number
Average Value
Number
Average Value
Number
Average Value
Number
Average Value
Number
Average Value
LOANS ORIGINATED
5
$94,108
25
$85,260
54
$101,140
6
$14,792
2
$170,995
APPLICATIONS APPROVED, NOT ACCEPTED
1
$94,040
3
$48,133
5
$111,224
0
$0
0
$0
APPLICATIONS DENIED
0
$0
13
$45,759
17
$95,571
3
$10,213
1
$10,210
APPLICATIONS WITHDRAWN
0
$0
2
$77,130
12
$91,602
1
$6,340
0
$0
FILES CLOSED FOR INCOMPLETENESS
0
$0
1
$137,360
2
$144,225
0
$0
0
$0
Aggregated Statistics For Year 2002 (Based on 2 partial tracts)
A) FHA, FSA/RHS & VA Home Purchase Loans
B) Conventional Home Purchase Loans
C) Refinancings
D) Home Improvement Loans
F) Non-occupant Loans on < 5 Family Dwellings (A B C & D)
Number
Average Value
Number
Average Value
Number
Average Value
Number
Average Value
Number
Average Value
LOANS ORIGINATED
4
$84,528
19
$53,497
45
$79,409
6
$17,317
5
$33,952
APPLICATIONS APPROVED, NOT ACCEPTED
0
$0
4
$64,365
6
$77,425
2
$16,730
0
$0
APPLICATIONS DENIED
0
$0
12
$53,534
15
$86,125
2
$9,155
0
$0
APPLICATIONS WITHDRAWN
1
$59,870
2
$145,635
5
$98,264
0
$0
0
$0
FILES CLOSED FOR INCOMPLETENESS
0
$0
1
$66,920
4
$119,925
0
$0
0
$0
Aggregated Statistics For Year 2001 (Based on 2 partial tracts)
A) FHA, FSA/RHS & VA Home Purchase Loans
B) Conventional Home Purchase Loans
C) Refinancings
D) Home Improvement Loans
F) Non-occupant Loans on < 5 Family Dwellings (A B C & D)
Number
Average Value
Number
Average Value
Number
Average Value
Number
Average Value
Number
Average Value
LOANS ORIGINATED
4
$69,560
23
$64,606
38
$83,666
9
$13,540
1
$28,180
APPLICATIONS APPROVED, NOT ACCEPTED
0
$0
7
$37,383
5
$89,670
1
$34,520
0
$0
APPLICATIONS DENIED
0
$0
17
$47,982
16
$67,138
3
$21,600
1
$67,270
APPLICATIONS WITHDRAWN
0
$0
1
$30,290
8
$75,282
1
$19,370
0
$0
FILES CLOSED FOR INCOMPLETENESS
0
$0
0
$0
1
$123,270
0
$0
0
$0
Aggregated Statistics For Year 2000 (Based on 2 partial tracts)
A) FHA, FSA/RHS & VA Home Purchase Loans
B) Conventional Home Purchase Loans
C) Refinancings
D) Home Improvement Loans
F) Non-occupant Loans on < 5 Family Dwellings (A B C & D)
Number
Average Value
Number
Average Value
Number
Average Value
Number
Average Value
Number
Average Value
LOANS ORIGINATED
4
$84,615
26
$50,392
19
$54,332
6
$23,773
3
$24,890
APPLICATIONS APPROVED, NOT ACCEPTED
0
$0
7
$41,560
2
$40,680
2
$16,730
0
$0
APPLICATIONS DENIED
1
$60,580
37
$39,285
14
$57,635
4
$11,182
2
$34,515
APPLICATIONS WITHDRAWN
0
$0
1
$40,150
6
$65,275
0
$0
0
$0
FILES CLOSED FOR INCOMPLETENESS
0
$0
0
$0
2
$41,735
1
$11,270
0
$0
Aggregated Statistics For Year 1999 (Based on 1 partial tract)
A) FHA, FSA/RHS & VA Home Purchase Loans
B) Conventional Home Purchase Loans
C) Refinancings
D) Home Improvement Loans
F) Non-occupant Loans on < 5 Family Dwellings (A B C & D)
Detailed PMIC statistics for the following Tracts:0302.00
2002 - 2018 National Fire Incident Reporting System (NFIRS) incidents
Based on the data from the years 2002 - 2018 the average number of fires per year is 13. The highest number of reported fires - 28 took place in 2018, and the least - 0 in 2005. The data has an increasing trend.
When looking into fire subcategories, the most incidents belonged to: Outside Fires (68.4%), and Structure Fires (24.4%).
Fire incident types reported to NFIRS in Zip Code 72047


 Nearest zip codes: 72111, 72173, 72061, 72058, 72131, 72045.


 Based on the data from the years 2002 - 2018 the average number of fires per year is 13. The highest number of reported fires - 28 took place in 2018, and the least - 0 in 2005. The data has an increasing trend.
 When looking into fire subcategories, the most incidents belonged to: Outside Fires (68.4%), and Structure Fires (24.4%).