Estimated zip code population in 2022: 1,503 Zip code population in 2010: 1,362 Zip code population in 2000: 1,101
Houses and condos: 635 Renter-occupied apartments: 60
% of renters here:
10%
State:
34%
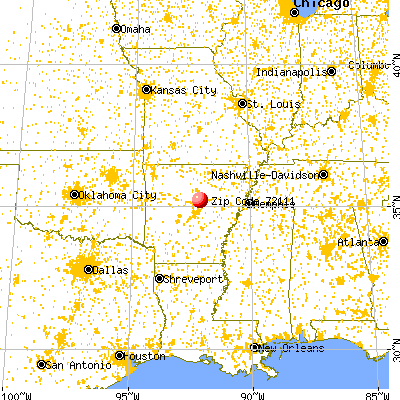
March 2022 cost of living index in zip code 72111: 78.0 (low, U.S. average is 100)
Land area: 58.6 sq. mi. Water area: 0.0 sq. mi.
Population density: 26 people per square mile
(very low).
OSM Map
General Map
Google Map
MSN Map
OSM Map
General Map
Google Map
MSN Map
OSM Map
General Map
Google Map
MSN Map
OSM Map
General Map
Google Map
MSN Map
Please wait while loading the map...
Real estate property taxes paid for housing units in 2022:
This zip code:
0.5% ($779)
Arkansas:
0.5% ($977)
Median real estate property taxes paid for housing units with mortgages in 2022: $1,315 (1.2%) Median real estate property taxes paid for housing units with no mortgage in 2022: $613 (0.5%)
Business Search- 14 Million verified businesses
Males: 726
(48.3%)
Females: 777
(51.7%)
For population 25 years and over in 72111:
High school or higher: 78.4%
Bachelor's degree or higher: 15.5%
Graduate or professional degree: 10.5%
Unemployed: 0.8%
Mean travel time to work (commute): 36.5 minutes
For population 15 years and over in 72111:
Never married: 18.9%
Now married: 64.1%
Separated: 0.0%
Widowed: 7.1%
Divorced: 9.9%
Zip code 72111 compared to state average:
Unemployed percentage significantly below state average.
Black race population percentage significantly below state average.
Hispanic race population percentage significantly below state average.
Median age above state average.
Foreign-born population percentage significantly below state average.
Renting percentage significantly below state average.
Length of stay since moving in significantly above state average.
Number of college students significantly below state average.
Percentage of population with a bachelor's degree or higher below state average.
Averages for the 2020 tax year for zip code 72111, filed in 2021:
Average Adjusted Gross Income (AGI) in 2020: $60,218 (Individual Income Tax Returns)
Here:
$60,218
State:
$64,872
Salary/wage: $51,451 (reported on 83.9% of returns)
Here:
$51,451
State:
$50,644
(% of AGI for various income ranges: 1330.0% for AGIs below $25k, 3322.7% for AGIs $25k-50k, 7257.1% for AGIs $50k-75k, 11487.5% for AGIs $75k-100k, 17980.0% for AGIs $100k-200k)
Taxable interest for individuals: $515 (reported on 23.2% of returns)
This zip code:
$515
Arkansas:
$1,857
(% of AGI for various income ranges: 2.9% for AGIs below $25k, 1.8% for AGIs $25k-50k, 4.3% for AGIs $50k-75k, 62.5% for AGIs $75k-100k, 66.0% for AGIs $100k-200k)
Ordinary dividends: $983 (reported on 10.7% of returns)
Here:
$983
State:
$21,681
(% of AGI for various income ranges: 10.0% for AGIs below $25k, 112.5% for AGIs $75k-100k)
Net capital gain/loss in AGI: +$9,600 (reported on 8.9% of returns)
Here:
+$9,600
State:
+$22,815
(% of AGI for various income ranges: 13.6% for AGIs $25k-50k, 930.0% for AGIs $100k-200k)
Profit/loss from business: +$7,550 (reported on 17.9% of returns)
Here:
+$7,550
State:
+$9,743
(% of AGI for various income ranges: 138.6% for AGIs below $25k, 320.9% for AGIs $25k-50k, 520.0% for AGIs $75k-100k)
Taxable individual retirement arrangement distribution: $19,033 (reported on 5.4% of returns)
72111:
$19,033
Arkansas:
$18,502
(% of AGI for various income ranges: 815.7% for AGIs $50k-75k)
Total itemized deductions: $23,967 (reported on 5.4% of returns)
Here:
$23,967
State:
$52,840
(% of AGI for various income ranges: 1027.1% for AGIs $50k-75k)
Taxes paid: $6,700 (reported on 5.4% of returns)
72111:
$6,700
State:
$7,196
(% of AGI for various income ranges: 287.1% for AGIs $50k-75k)
Earned income credit: $2,500 (reported on 16.1% of returns)
Here:
$2,500
State:
$2,546
(% of AGI for various income ranges: 103.6% for AGIs below $25k, 72.7% for AGIs $25k-50k)
Percentage of individuals using paid preparers for their 2020 taxes: 96.4%
Here:
96%
State:
94%
(% for various income ranges: 100.0% for AGIs below $25k, 100.0% for AGIs $25k-50k, 90.0% for AGIs $50k-75k, 85.7% for AGIs $75k-100k, 100.0% for AGIs $100k-200k)
Averages for the 2012 tax year for zip code 72111, filed in 2013:
Average Adjusted Gross Income (AGI) in 2012: $48,829 (Individual Income Tax Returns)
Here:
$48,829
State:
$52,148
Salary/wage: $45,062 (reported on 81.6% of returns)
Here:
$45,062
State:
$41,669
(% of AGI for various income ranges: 64.1% for AGIs below $25k, 79.5% for AGIs $25k-50k, 75.4% for AGIs $50k-75k, 81.3% for AGIs $75k-100k, 71.9% for AGIs $100k-200k)
Taxable interest for individuals: $392 (reported on 26.5% of returns)
This zip code:
$392
Arkansas:
$1,648
(% of AGI for various income ranges: 0.6% for AGIs below $25k, 0.3% for AGIs $25k-50k, 0.3% for AGIs $75k-100k)
Ordinary dividends: $925 (reported on 8.2% of returns)
Here:
$925
State:
$20,675
Net capital gain/loss in AGI: +$1,400 (reported on 8.2% of returns)
Here:
+$1,400
State:
+$15,222
Profit/loss from business: +$9,100 (reported on 16.3% of returns)
Here:
+$9,100
State:
+$9,665
(% of AGI for various income ranges: 11.4% for AGIs below $25k, 8.2% for AGIs $25k-50k, 1.1% for AGIs $50k-75k)
Taxable individual retirement arrangement distribution: $12,200 (reported on 4.1% of returns)
72111:
$12,200
Arkansas:
$13,644
Total itemized deductions: $21,508 (23% of AGI, reported on 24.5% of returns)
Here:
$21,508
State:
$23,276
Here:
23.4% of AGI
State:
19.1% of AGI
(% of AGI for various income ranges: 9.8% for AGIs $25k-50k, 10.8% for AGIs $50k-75k, 11.6% for AGIs $75k-100k, 14.5% for AGIs $100k-200k)
Charity contributions: $4,289 (reported on 18.4% of returns)
Here:
$4,289
State:
$5,996
(% of AGI for various income ranges: 2.8% for AGIs below $25k, 3.2% for AGIs $50k-75k, 2.2% for AGIs $100k-200k)
Taxes paid: $7,064 (reported on 22.4% of returns)
72111:
$7,064
State:
$7,941
(% of AGI for various income ranges: 1.9% for AGIs $25k-50k, 2.7% for AGIs $50k-75k, 3.1% for AGIs $75k-100k, 5.8% for AGIs $100k-200k)
Earned income credit: $2,470 (reported on 20.4% of returns)
Here:
$2,470
State:
$2,455
(% of AGI for various income ranges: 8.0% for AGIs below $25k, 1.4% for AGIs $25k-50k)
Percentage of individuals using paid preparers for their 2012 taxes: 69.4%
Here:
69%
State:
61%
(% for various income ranges: 58.8% for AGIs below $25k, 71.4% for AGIs $25k-50k, 66.7% for AGIs $50k-75k, 80.0% for AGIs $75k-100k, 100.0% for AGIs $100k-200k)
Averages for the 2004 tax year for zip code 72111, filed in 2005:
Average Adjusted Gross Income (AGI) in 2004: $33,967 (Individual Income Tax Returns)
Here:
$33,967
State:
$39,270
Salary/wage: $35,734 (reported on 82.1% of returns)
Here:
$35,734
State:
$34,079
(% of AGI for various income ranges: 116.9% for AGIs below $10k, 89.1% for AGIs $10k-25k, 88.8% for AGIs $25k-50k, 92.2% for AGIs $50k-75k, 89.7% for AGIs $75k-100k, 59.3% for AGIs over 100k)
Taxable interest for individuals: $419 (reported on 27.7% of returns)
This zip code:
$419
Arkansas:
$1,904
(% of AGI for various income ranges: 2.2% for AGIs below $10k, 0.4% for AGIs $10k-25k, 0.5% for AGIs $25k-50k, 0.2% for AGIs $50k-75k, 0.1% for AGIs $75k-100k, 0.2% for AGIs over 100k)
Taxable dividends: $306 (reported on 10.0% of returns)
Here:
$306
State:
$5,995
(% of AGI for various income ranges: 1.7% for AGIs below $10k, 0.0% for AGIs $25k-50k, 0.1% for AGIs $50k-75k, 0.1% for AGIs $75k-100k)
Net capital gain/loss: +$646 (reported on 9.8% of returns)
Here:
+$646
State:
+$10,430
Profit/loss from business: +$5,886 (reported on 21.4% of returns)
Here:
+$5,886
State:
+$7,823
(% of AGI for various income ranges: 5.8% for AGIs below $10k, 11.2% for AGIs $10k-25k, 7.0% for AGIs $25k-50k, 0.5% for AGIs $50k-75k)
Total itemized deductions: $15,113 (24% of AGI, reported on 27.1% of returns)
Here:
$15,113
State:
$18,389
Here:
23.8% of AGI
State:
21.0% of AGI
(% of AGI for various income ranges: 16.4% for AGIs $10k-25k, 8.1% for AGIs $25k-50k, 13.4% for AGIs $50k-75k, 14.3% for AGIs $75k-100k, 11.9% for AGIs over 100k)
Charity contributions deductions: $2,580 (4% of AGI, reported on 20.4% of returns)
Here:
$2,580
State:
$4,725
Here:
4.1% of AGI
State:
5.1% of AGI
(% of AGI for various income ranges: 2.4% for AGIs $10k-25k, 1.1% for AGIs $25k-50k, 1.6% for AGIs $50k-75k, 3.0% for AGIs $75k-100k)
Total tax: $4,104 (reported on 70.3% of returns)
72111:
$4,104
State:
$6,047
(% of AGI for various income ranges: 4.3% for AGIs below $10k, 4.0% for AGIs $10k-25k, 5.7% for AGIs $25k-50k, 8.2% for AGIs $50k-75k, 9.9% for AGIs $75k-100k, 17.7% for AGIs over 100k)
Earned income credit: $1,905 (reported on 23.6% of returns)
Here:
$1,905
State:
$1,909
Percentage of individuals using paid preparers for their 2004 taxes: 68.6%
Here:
69%
State:
67%
(% for various income ranges: 64.3% for AGIs below $10k, 66.7% for AGIs $10k-25k, 74.6% for AGIs $25k-50k, 67.1% for AGIs $50k-75k, 72.7% for AGIs $75k-100k, 71.4% for AGIs over 100k)
Household received Food Stamps/SNAP in the past 12 months: 57 Household did not receive Food Stamps/SNAP in the past 12 months: 523
Women who had a birth in the past 12 months: 28 (12 now married, 16 unmarried) Women who did not have a birth in the past 12 months: 267 (140 now married, 127 unmarried)
Housing units in zip code 72111 with a mortgage: 247 (14 second mortgage) Median monthly owner costs for units with a mortgage: $1,473 Median monthly owner costs for units without a mortgage: $433
Residents with income below the poverty level in 2022:
This zip code:
17.9%
Whole state:
16.8%
Residents with income below 50% of the poverty level in 2022:
This zip code:
17.3%
Whole state:
8.5%
Median number of rooms in houses and condos:
Here:
5.7
State:
6.1
Median number of rooms in apartments:
Here:
5.4
State:
4.3
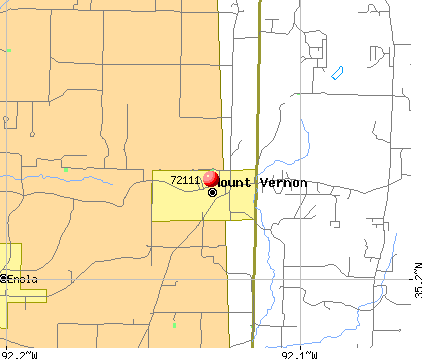
Notable locations in this zip code not listed on our city pages
Churches in zip code 72111 include: Union Hill Church (A), Bethlehem Church (B), Cedar Hill Church (C), Mount Olive Church (D), Mount Nebo Church (E), Cedar Glade Assembly of God Church (F). Display/hide their locations on the map
Streams, rivers, and creeks: Little Creek (A), Hall Branch (B), Clear Creek (C), Mortar Creek (D), Nichols Creek (E), Trobough Branch (F). Display/hide their locations on the map
Size of family households: 280 2-persons, 31 3-persons, 53 4-persons, 48 5-persons, 54 6-persons, 1 7-or-more-persons
Size of nonfamily households: 88 1-person, 25 2-persons
306 married couples with children.
39 single-parent households (37 men, 2 women).
98.0% of residents of 72111 zip code speak English at home.
1.1% of residents speak Spanish at home (100% very well).
1.1% of residents speak other Indo-European language at home (100% very well).
Foreign born population: 26 (1.8%) (15.8% of them are naturalized citizens)
This zip code:
1.8%
Whole state:
5.1%
58%France
15%Belize
15%Mexico
4%Australia
18%American
10%Irish
8%German
3%French
1%English
Year of entry for the foreign-born population
352010 or later
22000 to 2009
01990 to 1999
18Before 1990
Housing units lacking complete plumbing facilities: 9.1% Housing units lacking complete kitchen facilities: 0.8%
71.0%Electricity
15.6%Utility gas
9.7%Wood
3.9%Bottled, tank, or LP gas
Population in 1990: 534. Population change in the 1990s: +567 (+106.2%).
Place of birth for U.S.-born residents:
This state: 1,164
Northeast: 3
Midwest: 98
South: 127
West: 44
56% of the 72111 zip code residents lived in the same house 5 years ago. Out of people who lived in different houses, 38% lived in this county. Out of people who lived in different counties, 50% lived in Arkansas.
96% of the 72111 zip code residents lived in the same house 1 year ago. Out of people who lived in different houses, 86% moved from this county. Out of people who lived in different houses, 5% moved from different county within same state.
Private vs. public school enrollment:
Students in private schools in grades 1 to 8 (elementary and middle school): 24
Here:
17.5%
Arkansas:
10.5%
Students in private schools in grades 9 to 12 (high school): 28
Here:
21.6%
Arkansas:
8.7%
Occupation by median earnings in the past 12 months ($)
129,927Construction and extraction occupations
55,885Installation, maintenance, and repair occupations
35,138Management occupations
20,558Production occupations
17,166Food preparation and serving related occupations
2,501Building and grounds cleaning and maintenance occupations
Top industries in this zip code by the number of employees in 2005:
Administrative and Support and Waste Management and Remediation Services: Landscaping Services (10-19 employees: 1 establishment)
Construction: Site Preparation Contractors (5-9: 1, 1-4: 1)
Health Care and Social Assistance: Child Day Care Services (5-9: 1)
Construction: Poured Concrete Foundation and Structure Contractors (5-9: 1)
Health Care and Social Assistance: Offices of Physicians (except Mental Health Specialists) (5-9: 1)
Professional, Scientific, and Technical Services: Marketing Consulting Services (1-4: 1)
Professional, Scientific, and Technical Services: Veterinary Services (1-4: 1)
Other Services (except Public Administration): Religious Organizations (1-4: 1)
Information: Cellular and Other Wireless Telecommunications (1-4: 1)
Fatal accident statistics in 2014:
Fatal accident count: 1
Vehicles involved in fatal accidents: 2
Fatal accidents caused by drunken drivers: 0
Fatalities: 1
Persons involved in fatal accidents: 4
Pedestrians involved in fatal accidents: 0
Fatal accident statistics in 2013:
Fatal accident count: 1
Vehicles involved in fatal accidents: 2
Fatal accidents caused by drunken drivers: 0
Fatalities: 1
Persons involved in fatal accidents: 3
Pedestrians involved in fatal accidents: 0
Home Mortgage Disclosure Act Aggregated Statistics For Year 2009 (Based on 2 partial tracts)
A) FHA, FSA/RHS & VA Home Purchase Loans
B) Conventional Home Purchase Loans
C) Refinancings
D) Home Improvement Loans
F) Non-occupant Loans on < 5 Family Dwellings (A B C & D)
G) Loans On Manufactured Home Dwelling (A B C & D)
Number
Average Value
Number
Average Value
Number
Average Value
Number
Average Value
Number
Average Value
Number
Average Value
LOANS ORIGINATED
17
$120,616
15
$101,815
46
$129,534
5
$51,380
3
$54,990
14
$48,023
APPLICATIONS APPROVED, NOT ACCEPTED
0
$0
1
$87,640
2
$94,940
1
$18,040
0
$0
1
$53,700
APPLICATIONS DENIED
1
$79,050
8
$56,546
20
$144,066
2
$72,600
2
$56,920
8
$50,318
APPLICATIONS WITHDRAWN
1
$119,430
2
$113,630
11
$134,777
2
$59,715
0
$0
0
$0
FILES CLOSED FOR INCOMPLETENESS
1
$87,640
0
$0
1
$226,400
0
$0
0
$0
0
$0
Aggregated Statistics For Year 2008 (Based on 2 partial tracts)
A) FHA, FSA/RHS & VA Home Purchase Loans
B) Conventional Home Purchase Loans
C) Refinancings
D) Home Improvement Loans
F) Non-occupant Loans on < 5 Family Dwellings (A B C & D)
G) Loans On Manufactured Home Dwelling (A B C & D)
Number
Average Value
Number
Average Value
Number
Average Value
Number
Average Value
Number
Average Value
Number
Average Value
LOANS ORIGINATED
12
$137,150
13
$88,200
29
$128,539
7
$24,303
8
$57,942
11
$55,028
APPLICATIONS APPROVED, NOT ACCEPTED
1
$60,140
7
$57,811
2
$73,890
0
$0
0
$0
8
$60,735
APPLICATIONS DENIED
4
$93,868
8
$100,634
16
$113,844
3
$28,210
1
$75,180
9
$58,234
APPLICATIONS WITHDRAWN
2
$108,260
1
$210,500
5
$165,138
0
$0
0
$0
0
$0
FILES CLOSED FOR INCOMPLETENESS
0
$0
0
$0
3
$109,690
0
$0
0
$0
1
$22,340
Aggregated Statistics For Year 2007 (Based on 2 partial tracts)
A) FHA, FSA/RHS & VA Home Purchase Loans
B) Conventional Home Purchase Loans
C) Refinancings
D) Home Improvement Loans
F) Non-occupant Loans on < 5 Family Dwellings (A B C & D)
G) Loans On Manufactured Home Dwelling (A B C & D)
Number
Average Value
Number
Average Value
Number
Average Value
Number
Average Value
Number
Average Value
Number
Average Value
LOANS ORIGINATED
6
$115,777
29
$105,844
29
$116,970
5
$16,410
7
$106,419
17
$67,119
APPLICATIONS APPROVED, NOT ACCEPTED
0
$0
3
$69,023
4
$125,335
0
$0
0
$0
3
$55,847
APPLICATIONS DENIED
1
$149,930
17
$74,144
16
$89,813
6
$20,550
2
$47,255
14
$48,391
APPLICATIONS WITHDRAWN
0
$0
4
$110,515
7
$106,786
0
$0
1
$13,750
2
$54,345
FILES CLOSED FOR INCOMPLETENESS
0
$0
0
$0
1
$109,550
0
$0
0
$0
0
$0
Aggregated Statistics For Year 2006 (Based on 2 partial tracts)
A) FHA, FSA/RHS & VA Home Purchase Loans
B) Conventional Home Purchase Loans
C) Refinancings
D) Home Improvement Loans
F) Non-occupant Loans on < 5 Family Dwellings (A B C & D)
G) Loans On Manufactured Home Dwelling (A B C & D)
Number
Average Value
Number
Average Value
Number
Average Value
Number
Average Value
Number
Average Value
Number
Average Value
LOANS ORIGINATED
9
$107,304
27
$82,642
31
$110,601
9
$45,156
6
$80,048
14
$56,461
APPLICATIONS APPROVED, NOT ACCEPTED
0
$0
6
$66,445
6
$70,740
1
$52,410
3
$67,017
6
$47,685
APPLICATIONS DENIED
2
$77,760
16
$64,011
17
$93,805
3
$9,020
1
$81,620
18
$50,645
APPLICATIONS WITHDRAWN
2
$96,230
5
$98,292
9
$110,073
0
$0
0
$0
0
$0
FILES CLOSED FOR INCOMPLETENESS
1
$47,260
2
$47,040
4
$93,868
0
$0
0
$0
0
$0
Aggregated Statistics For Year 2005 (Based on 2 partial tracts)
A) FHA, FSA/RHS & VA Home Purchase Loans
B) Conventional Home Purchase Loans
C) Refinancings
D) Home Improvement Loans
F) Non-occupant Loans on < 5 Family Dwellings (A B C & D)
G) Loans On Manufactured Home Dwelling (A B C & D)
Number
Average Value
Number
Average Value
Number
Average Value
Number
Average Value
Number
Average Value
Number
Average Value
LOANS ORIGINATED
3
$125,587
23
$87,302
32
$96,418
4
$16,862
7
$48,421
13
$53,238
APPLICATIONS APPROVED, NOT ACCEPTED
0
$0
3
$57,710
4
$81,195
0
$0
0
$0
2
$67,445
APPLICATIONS DENIED
1
$82,480
11
$60,847
16
$77,677
5
$30,330
0
$0
8
$51,230
APPLICATIONS WITHDRAWN
1
$100,100
7
$91,076
18
$142,246
1
$36,520
3
$75,897
2
$80,120
FILES CLOSED FOR INCOMPLETENESS
0
$0
1
$104,390
3
$81,623
0
$0
0
$0
0
$0
Aggregated Statistics For Year 2004 (Based on 2 partial tracts)
A) FHA, FSA/RHS & VA Home Purchase Loans
B) Conventional Home Purchase Loans
C) Refinancings
D) Home Improvement Loans
F) Non-occupant Loans on < 5 Family Dwellings (A B C & D)
G) Loans On Manufactured Home Dwelling (A B C & D)
Number
Average Value
Number
Average Value
Number
Average Value
Number
Average Value
Number
Average Value
Number
Average Value
LOANS ORIGINATED
6
$116,063
22
$72,876
40
$98,496
7
$38,603
6
$88,355
11
$44,835
APPLICATIONS APPROVED, NOT ACCEPTED
0
$0
4
$65,942
4
$83,128
0
$0
0
$0
3
$37,377
APPLICATIONS DENIED
2
$113,630
20
$55,784
18
$75,872
3
$23,200
4
$61,325
18
$40,931
APPLICATIONS WITHDRAWN
1
$127,160
4
$98,915
9
$118,427
0
$0
1
$71,310
0
$0
FILES CLOSED FOR INCOMPLETENESS
0
$0
0
$0
1
$187,310
0
$0
0
$0
0
$0
Aggregated Statistics For Year 2003 (Based on 2 partial tracts)
A) FHA, FSA/RHS & VA Home Purchase Loans
B) Conventional Home Purchase Loans
C) Refinancings
D) Home Improvement Loans
F) Non-occupant Loans on < 5 Family Dwellings (A B C & D)
Number
Average Value
Number
Average Value
Number
Average Value
Number
Average Value
Number
Average Value
LOANS ORIGINATED
6
$95,658
30
$86,665
66
$100,937
7
$15,466
3
$139,047
APPLICATIONS APPROVED, NOT ACCEPTED
1
$114,700
3
$58,713
6
$113,057
0
$0
0
$0
APPLICATIONS DENIED
0
$0
16
$45,349
21
$94,369
4
$9,345
1
$12,460
APPLICATIONS WITHDRAWN
0
$0
3
$62,720
15
$89,385
1
$7,730
0
$0
FILES CLOSED FOR INCOMPLETENESS
0
$0
2
$83,770
3
$117,280
0
$0
0
$0
Aggregated Statistics For Year 2002 (Based on 2 partial tracts)
A) FHA, FSA/RHS & VA Home Purchase Loans
B) Conventional Home Purchase Loans
C) Refinancings
D) Home Improvement Loans
F) Non-occupant Loans on < 5 Family Dwellings (A B C & D)
Number
Average Value
Number
Average Value
Number
Average Value
Number
Average Value
Number
Average Value
LOANS ORIGINATED
5
$82,484
23
$53,906
55
$79,249
8
$15,841
6
$34,512
APPLICATIONS APPROVED, NOT ACCEPTED
0
$0
5
$62,808
7
$80,949
2
$20,405
0
$0
APPLICATIONS DENIED
0
$0
15
$52,239
18
$87,543
3
$7,447
0
$0
APPLICATIONS WITHDRAWN
1
$73,030
3
$118,427
6
$99,882
0
$0
0
$0
FILES CLOSED FOR INCOMPLETENESS
0
$0
1
$81,620
4
$146,280
0
$0
0
$0
Aggregated Statistics For Year 2001 (Based on 2 partial tracts)
A) FHA, FSA/RHS & VA Home Purchase Loans
B) Conventional Home Purchase Loans
C) Refinancings
D) Home Improvement Loans
F) Non-occupant Loans on < 5 Family Dwellings (A B C & D)
Number
Average Value
Number
Average Value
Number
Average Value
Number
Average Value
Number
Average Value
LOANS ORIGINATED
4
$84,845
28
$64,731
47
$82,511
11
$13,513
2
$17,185
APPLICATIONS APPROVED, NOT ACCEPTED
0
$0
8
$39,899
6
$91,147
1
$42,100
0
$0
APPLICATIONS DENIED
0
$0
21
$47,379
20
$65,514
4
$19,762
1
$82,050
APPLICATIONS WITHDRAWN
0
$0
1
$36,950
10
$73,462
1
$23,630
0
$0
FILES CLOSED FOR INCOMPLETENESS
0
$0
0
$0
2
$75,180
0
$0
0
$0
Aggregated Statistics For Year 2000 (Based on 2 partial tracts)
A) FHA, FSA/RHS & VA Home Purchase Loans
B) Conventional Home Purchase Loans
C) Refinancings
D) Home Improvement Loans
F) Non-occupant Loans on < 5 Family Dwellings (A B C & D)
Number
Average Value
Number
Average Value
Number
Average Value
Number
Average Value
Number
Average Value
LOANS ORIGINATED
5
$82,570
32
$49,941
23
$54,746
7
$24,856
3
$30,360
APPLICATIONS APPROVED, NOT ACCEPTED
0
$0
9
$39,428
2
$49,620
3
$13,603
0
$0
APPLICATIONS DENIED
1
$73,890
46
$38,543
18
$54,678
5
$10,912
3
$28,067
APPLICATIONS WITHDRAWN
0
$0
1
$48,970
8
$59,715
0
$0
0
$0
FILES CLOSED FOR INCOMPLETENESS
0
$0
0
$0
2
$50,910
1
$13,750
0
$0
Aggregated Statistics For Year 1999 (Based on 1 partial tract)
A) FHA, FSA/RHS & VA Home Purchase Loans
B) Conventional Home Purchase Loans
C) Refinancings
D) Home Improvement Loans
F) Non-occupant Loans on < 5 Family Dwellings (A B C & D)
Detailed PMIC statistics for the following Tracts:0302.00
2002 - 2018 National Fire Incident Reporting System (NFIRS) incidents
According to the data from the years 2002 - 2018 the average number of fires per year is 9. The highest number of reported fire incidents - 27 took place in 2009, and the least - 0 in 2007. The data has an increasing trend.
When looking into fire subcategories, the most reports belonged to: Outside Fires (71.8%), and Structure Fires (20.8%).
Fire incident types reported to NFIRS in Zip Code 72111


 Nearest zip codes: 72047, 72136, 72137, 72045, 72173, 72131.


 According to the data from the years 2002 - 2018 the average number of fires per year is 9. The highest number of reported fire incidents - 27 took place in 2009, and the least - 0 in 2007. The data has an increasing trend.
 When looking into fire subcategories, the most reports belonged to: Outside Fires (71.8%), and Structure Fires (20.8%).