Estimated zip code population in 2022: 2,178 Zip code population in 2010: 2,376 Zip code population in 2000: 2,443
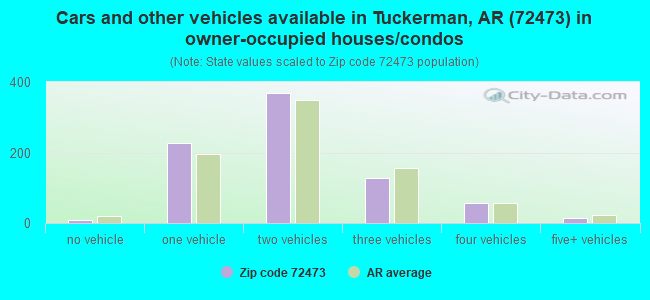
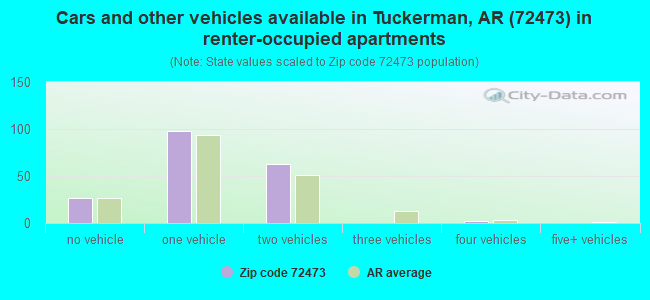
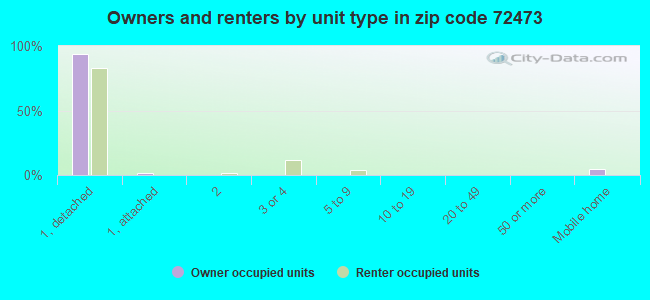
Houses and condos: 1,126 Renter-occupied apartments: 187
% of renters here:
19%
State:
34%
March 2022 cost of living index in zip code 72473: 77.5 (low, U.S. average is 100)
Land area: 57.8 sq. mi. Water area: 0.1 sq. mi.
Population density: 38 people per square mile
(very low).
OSM Map
General Map
Google Map
MSN Map
OSM Map
General Map
Google Map
MSN Map
OSM Map
General Map
Google Map
MSN Map
OSM Map
General Map
Google Map
MSN Map
Please wait while loading the map...
Real estate property taxes paid for housing units in 2022:
This zip code:
0.5% ($425)
Arkansas:
0.5% ($977)
Median real estate property taxes paid for housing units with mortgages in 2022: $450 (0.4%) Median real estate property taxes paid for housing units with no mortgage in 2022: $401 (0.4%)
Business Search- 14 Million verified businesses
Males: 1,210
(55.6%)
Females: 967
(44.4%)
For population 25 years and over in 72473:
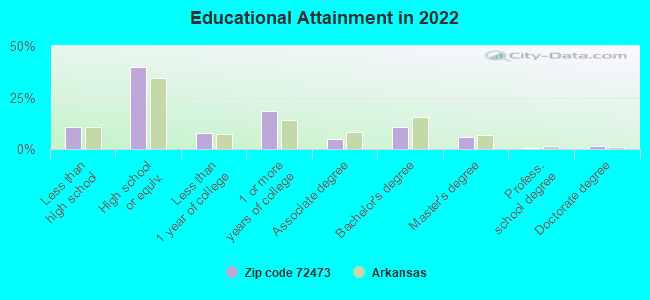
High school or higher: 88.6%
Bachelor's degree or higher: 18.7%
Graduate or professional degree: 7.8%
Unemployed: 2.6%
Mean travel time to work (commute): 20.5 minutes
For population 15 years and over in 72473:
Never married: 24.1%
Now married: 50.9%
Separated: 2.4%
Widowed: 8.3%
Divorced: 14.3%
Zip code 72473 compared to state average:
Median house value below state average.
Unemployed percentage below state average.
Black race population percentage significantly below state average.
Hispanic race population percentage significantly below state average.
Median age significantly above state average.
Foreign-born population percentage significantly below state average.
Renting percentage below state average.
Length of stay since moving in significantly above state average.
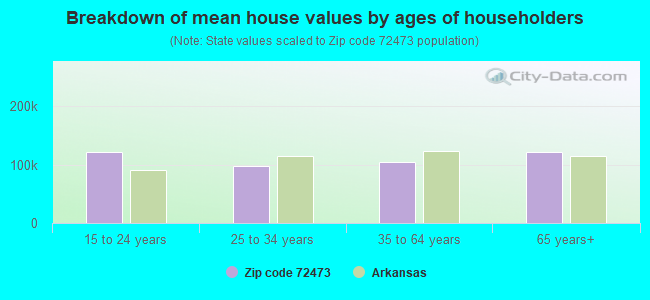
Estimated median house/condo value in 2022: $93,111
72473:
$93,111
Arkansas:
$179,800
According to our research of Arkansas and other state lists, there were 3 registered sex offenders living in 72473 zip code as of May 28, 2024. The ratio of all residents to sex offenders in zip code 72473 is 831 to 1. The ratio of registered sex offenders to all residents in this zip code is lower than the state average.
Median resident age:
This zip code:
47.7 years
Arkansas median age:
38.9 years
Average household size:
This zip code:
2.2 people
Arkansas:
2.4 people
Averages for the 2020 tax year for zip code 72473, filed in 2021:
Average Adjusted Gross Income (AGI) in 2020: $49,096 (Individual Income Tax Returns)
Here:
$49,096
State:
$64,872
Salary/wage: $41,006 (reported on 86.0% of returns)
Here:
$41,006
State:
$50,644
(% of AGI for various income ranges: 1226.4% for AGIs below $25k, 4104.0% for AGIs $25k-50k, 7464.4% for AGIs $50k-75k, 12532.0% for AGIs $75k-100k, 17094.0% for AGIs $100k-200k)
Taxable interest for individuals: $584 (reported on 20.4% of returns)
This zip code:
$584
Arkansas:
$1,857
(% of AGI for various income ranges: 9.2% for AGIs below $25k, 4.5% for AGIs $25k-50k, 26.7% for AGIs $50k-75k, 18.0% for AGIs $75k-100k, 92.0% for AGIs $100k-200k)
Ordinary dividends: $1,671 (reported on 7.5% of returns)
Here:
$1,671
State:
$21,681
(% of AGI for various income ranges: 16.0% for AGIs $25k-50k, 170.0% for AGIs $100k-200k)
Net capital gain/loss in AGI: +$6,933 (reported on 6.5% of returns)
Here:
+$6,933
State:
+$22,815
(% of AGI for various income ranges: 8.4% for AGIs below $25k, 68.9% for AGIs $50k-75k, 666.0% for AGIs $100k-200k)
Profit/loss from business: +$5,025 (reported on 12.9% of returns)
Here:
+$5,025
State:
+$9,743
(% of AGI for various income ranges: 106.8% for AGIs below $25k, 82.5% for AGIs $25k-50k, 26.7% for AGIs $50k-75k, 294.0% for AGIs $75k-100k)
Taxable individual retirement arrangement distribution: $11,080 (reported on 5.4% of returns)
72473:
$11,080
Arkansas:
$18,502
(% of AGI for various income ranges: 114.0% for AGIs below $25k, 298.9% for AGIs $50k-75k)
Earned income credit: $2,459 (reported on 23.7% of returns)
Here:
$2,459
State:
$2,546
(% of AGI for various income ranges: 134.8% for AGIs below $25k, 102.0% for AGIs $25k-50k)
Percentage of individuals using paid preparers for their 2020 taxes: 93.5%
Here:
94%
State:
94%
(% for various income ranges: 91.4% for AGIs below $25k, 96.3% for AGIs $25k-50k, 92.9% for AGIs $50k-75k, 87.5% for AGIs $75k-100k, 100.0% for AGIs $100k-200k)
Averages for the 2012 tax year for zip code 72473, filed in 2013:
Average Adjusted Gross Income (AGI) in 2012: $38,523 (Individual Income Tax Returns)
Here:
$38,523
State:
$52,148
Salary/wage: $33,380 (reported on 88.9% of returns)
Here:
$33,380
State:
$41,669
(% of AGI for various income ranges: 80.7% for AGIs below $25k, 83.1% for AGIs $25k-50k, 84.3% for AGIs $50k-75k, 85.2% for AGIs $75k-100k, 57.5% for AGIs $100k-200k)
Taxable interest for individuals: $675 (reported on 20.2% of returns)
This zip code:
$675
Arkansas:
$1,648
(% of AGI for various income ranges: 0.3% for AGIs below $25k, 0.5% for AGIs $25k-50k, 0.3% for AGIs $50k-75k, 0.3% for AGIs $75k-100k, 0.3% for AGIs $100k-200k)
Ordinary dividends: $1,578 (reported on 9.1% of returns)
Here:
$1,578
State:
$20,675
(% of AGI for various income ranges: 0.2% for AGIs below $25k, 0.3% for AGIs $50k-75k, 1.2% for AGIs $100k-200k)
Net capital gain/loss in AGI: +$380 (reported on 5.1% of returns)
Here:
+$380
State:
+$15,222
(% of AGI for various income ranges: 0.6% for AGIs $75k-100k)
Profit/loss from business: +$5,538 (reported on 13.1% of returns)
Here:
+$5,538
State:
+$9,665
(% of AGI for various income ranges: 6.2% for AGIs below $25k, 2.6% for AGIs $25k-50k, 1.1% for AGIs $50k-75k)
Taxable individual retirement arrangement distribution: $7,167 (reported on 6.1% of returns)
72473:
$7,167
Arkansas:
$13,644
Total itemized deductions: $16,250 (19% of AGI, reported on 12.1% of returns)
Here:
$16,250
State:
$23,276
Here:
19.0% of AGI
State:
19.1% of AGI
(% of AGI for various income ranges: 4.0% for AGIs $25k-50k, 8.9% for AGIs $50k-75k, 9.1% for AGIs $100k-200k)
Charity contributions: $4,575 (reported on 8.1% of returns)
Here:
$4,575
State:
$5,996
(% of AGI for various income ranges: 1.3% for AGIs below $25k, 1.8% for AGIs $50k-75k, 1.6% for AGIs $100k-200k)
Taxes paid: $5,225 (reported on 12.1% of returns)
72473:
$5,225
State:
$7,941
(% of AGI for various income ranges: 0.9% for AGIs $25k-50k, 2.1% for AGIs $50k-75k, 4.0% for AGIs $100k-200k)
Earned income credit: $2,341 (reported on 29.3% of returns)
Here:
$2,341
State:
$2,455
(% of AGI for various income ranges: 8.6% for AGIs below $25k, 1.6% for AGIs $25k-50k)
Percentage of individuals using paid preparers for their 2012 taxes: 72.7%
Here:
73%
State:
61%
(% for various income ranges: 72.3% for AGIs below $25k, 70.4% for AGIs $25k-50k, 69.2% for AGIs $50k-75k, 83.3% for AGIs $75k-100k, 83.3% for AGIs $100k-200k)
Averages for the 2004 tax year for zip code 72473, filed in 2005:
Average Adjusted Gross Income (AGI) in 2004: $30,271 (Individual Income Tax Returns)
Here:
$30,271
State:
$39,270
Salary/wage: $27,231 (reported on 87.0% of returns)
Here:
$27,231
State:
$34,079
(% of AGI for various income ranges: 90.6% for AGIs below $10k, 80.6% for AGIs $10k-25k, 87.2% for AGIs $25k-50k, 83.7% for AGIs $50k-75k, 75.3% for AGIs $75k-100k, 38.1% for AGIs over 100k)
Taxable interest for individuals: $1,060 (reported on 27.1% of returns)
This zip code:
$1,060
Arkansas:
$1,904
(% of AGI for various income ranges: 2.7% for AGIs below $10k, 1.5% for AGIs $10k-25k, 0.8% for AGIs $25k-50k, 0.5% for AGIs $50k-75k, 0.6% for AGIs $75k-100k, 1.1% for AGIs over 100k)
Taxable dividends: $795 (reported on 10.8% of returns)
Here:
$795
State:
$5,995
(% of AGI for various income ranges: 0.3% for AGIs below $10k, 0.1% for AGIs $10k-25k, 0.2% for AGIs $25k-50k, 0.3% for AGIs $50k-75k, 0.7% for AGIs $75k-100k, 0.4% for AGIs over 100k)
Net capital gain/loss: +$6,853 (reported on 7.2% of returns)
Here:
+$6,853
State:
+$10,430
(% of AGI for various income ranges: 0.0% for AGIs $10k-25k, 0.2% for AGIs $25k-50k, 1.6% for AGIs $50k-75k, 10.9% for AGIs $75k-100k)
Profit/loss from business: +$4,955 (reported on 12.8% of returns)
Here:
+$4,955
State:
+$7,823
(% of AGI for various income ranges: 13.8% for AGIs below $10k, 5.6% for AGIs $10k-25k, 1.6% for AGIs $25k-50k, 0.4% for AGIs $50k-75k)
IRA payment deduction: $2,731 (reported on 2.5% of returns)
72473:
$2,731
Arkansas:
$3,204
Total itemized deductions: $14,909 (23% of AGI, reported on 10.6% of returns)
Here:
$14,909
State:
$18,389
Here:
23.0% of AGI
State:
21.0% of AGI
(% of AGI for various income ranges: 4.2% for AGIs $10k-25k, 4.0% for AGIs $25k-50k, 4.7% for AGIs $50k-75k, 9.4% for AGIs $75k-100k, 8.5% for AGIs over 100k)
Charity contributions deductions: $3,500 (5% of AGI, reported on 9.0% of returns)
Here:
$3,500
State:
$4,725
Here:
5.3% of AGI
State:
5.1% of AGI
(% of AGI for various income ranges: 0.7% for AGIs $10k-25k, 1.1% for AGIs $25k-50k, 0.7% for AGIs $50k-75k, 1.9% for AGIs $75k-100k, 1.6% for AGIs over 100k)
Total tax: $3,531 (reported on 68.3% of returns)
72473:
$3,531
State:
$6,047
(% of AGI for various income ranges: 2.8% for AGIs below $10k, 3.6% for AGIs $10k-25k, 6.2% for AGIs $25k-50k, 8.7% for AGIs $50k-75k, 11.0% for AGIs $75k-100k, 17.3% for AGIs over 100k)
Earned income credit: $1,828 (reported on 26.4% of returns)
Here:
$1,828
State:
$1,909
Percentage of individuals using paid preparers for their 2004 taxes: 70.5%
Here:
71%
State:
67%
(% for various income ranges: 64.6% for AGIs below $10k, 70.8% for AGIs $10k-25k, 73.4% for AGIs $25k-50k, 70.9% for AGIs $50k-75k, 70.7% for AGIs $75k-100k, 90.5% for AGIs over 100k)
Household received Food Stamps/SNAP in the past 12 months: 68 Household did not receive Food Stamps/SNAP in the past 12 months: 921
Women who had a birth in the past 12 months: 27 (28 now married, 0 unmarried) Women who did not have a birth in the past 12 months: 294 (153 now married, 141 unmarried)
Housing units in zip code 72473 with a mortgage: 333 (10 second mortgage, 6 both second mortgage and home equity loan) Median monthly owner costs for units with a mortgage: $887 Median monthly owner costs for units without a mortgage: $353
Residents with income below the poverty level in 2022:
This zip code:
16.3%
Whole state:
16.8%
Residents with income below 50% of the poverty level in 2022:
This zip code:
8.2%
Whole state:
8.5%
Median number of rooms in houses and condos:
Here:
5.5
State:
6.1
Median number of rooms in apartments:
Here:
5.3
State:
4.3
Notable locations in this zip code not listed on our city pages
Notable locations in zip code 72473: Tuckerman Industrial Park (A), Tuckerman Volunteer Fire Department (B), Tuckerman Police Department (C), Tuckerman Volunteer Fire Department (D). Display/hide their locations on the map
Churches in zip code 72473 include: Campbell Station Baptist Church (A), Church of Christ (B), Tuckerman United Methodist Church (C), New Hope Church (D), Church of Christ (E). Display/hide their locations on the map
Cemeteries: Lawrence Cemetery (1), Gracelawn Cemetery (2), Prysock Cemetery (3), Williamson Cemetery (4), Denton Island Cemetery (5), Parrott Cemetery (6), Harrison Cemetery (7). Display/hide their locations on the map
Size of family households: 356 2-persons, 147 3-persons, 69 4-persons, 52 5-persons, 1 6-persons
Size of nonfamily households: 343 1-person, 21 2-persons
200 married couples with children.
128 single-parent households (45 men, 83 women).
98.0% of residents of 72473 zip code speak English at home.
1.3% of residents speak Spanish at home (50% very well, 38% well, 12% not well).
0.3% of residents speak other Indo-European language at home (100% very well).
Foreign born population: 12 (0.6%) (25.6% of them are naturalized citizens)
This zip code:
0.6%
Whole state:
5.1%
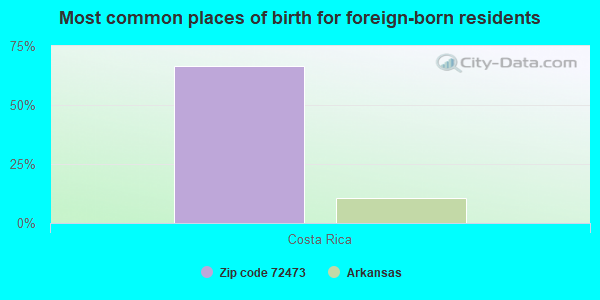
67%Costa Rica
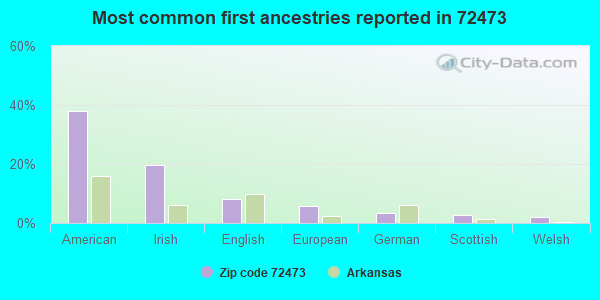
38%American
20%Irish
8%English
6%European
3%German
3%Scottish
2%Welsh
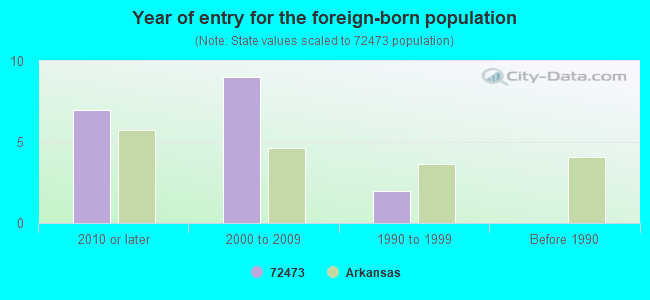
Year of entry for the foreign-born population
72010 or later
92000 to 2009
21990 to 1999
0Before 1990
Facilities with environmental interests located in this zip code:
CENTER POINT ENERGY MRT TUCKERMAN (4 MI SW OF TUCKERMAN/GRACELAWN in TUCKERMAN, AR)
AIR MAJOR (AIRS/AFS) CRITERIA AND HAZARDOUS AIR POLLUTANT INVENTORY (Inventory of air pollution sources) Business SIC classification: NATURAL GAS TRANSMISSION Alternative names: CENTER POINT ENERGY MISS. RIVER TRANS., MRT-TUCKERMAN COMPRESSOR STATION
Housing units lacking complete plumbing facilities: 6.4% Housing units lacking complete kitchen facilities: 7.3%
54.7%Utility gas
39.9%Electricity
3.3%Bottled, tank, or LP gas
2.3%Wood
Population in 1990: 2,564.
Place of birth for U.S.-born residents:
This state: 1,804
Northeast: 24
Midwest: 137
South: 94
West: 76
73% of the 72473 zip code residents lived in the same house 5 years ago. Out of people who lived in different houses, 65% lived in this county. Out of people who lived in different counties, 50% lived in Arkansas.
93% of the 72473 zip code residents lived in the same house 1 year ago. Out of people who lived in different houses, 38% moved from this county. Out of people who lived in different houses, 63% moved from different county within same state.
Private vs. public school enrollment:
Students in private schools in grades 1 to 8 (elementary and middle school):
Here:
0.0%
Arkansas:
10.5%
Students in private schools in grades 9 to 12 (high school):
Here:
0.0%
Arkansas:
8.7%
Students in private undergraduate colleges:
Here:
0.0%
Arkansas:
19.4%
Occupation by median earnings in the past 12 months ($)
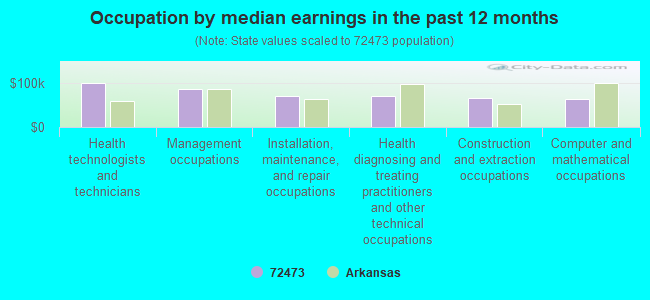
99,506Health technologists and technicians
85,144Management occupations
70,849Installation, maintenance, and repair occupations
70,335Health diagnosing and treating practitioners and other technical occupations
66,841Construction and extraction occupations
63,643Computer and mathematical occupations
Top industries in this zip code by the number of employees in 2005:
Finance and Insurance: Savings Institutions (5-9: 1)
Utilities: Electric Power Distribution (5-9: 1)
Fatal accident statistics in 2014:
Fatal accident count: 1
Vehicles involved in fatal accidents: 2
Fatal accidents caused by drunken drivers: 0
Fatalities: 1
Persons involved in fatal accidents: 2
Pedestrians involved in fatal accidents: 0
Fatal accident statistics in 2013:
Fatal accident count: 2
Vehicles involved in fatal accidents: 2
Fatal accidents caused by drunken drivers: 0
Fatalities: 2
Persons involved in fatal accidents: 4
Pedestrians involved in fatal accidents: 0
2003 - 2018 National Fire Incident Reporting System (NFIRS) incidents
Based on the data from the years 2003 - 2018 the average number of fires per year is 24. The highest number of reported fire incidents - 81 took place in 2010, and the least - 5 in 2017. The data has a rising trend.
When looking into fire subcategories, the most reports belonged to: Outside Fires (55.2%), and Structure Fires (27.8%).
Fire incident types reported to NFIRS in Zip Code 72473


 Nearest zip codes: 72471, 72431, 72524, 72112, 72572, 72421.
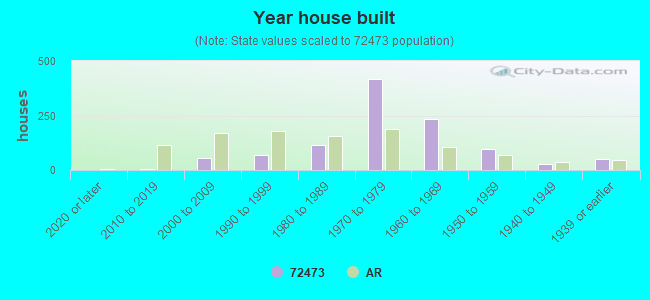


 Based on the data from the years 2003 - 2018 the average number of fires per year is 24. The highest number of reported fire incidents - 81 took place in 2010, and the least - 5 in 2017. The data has a rising trend.
 When looking into fire subcategories, the most reports belonged to: Outside Fires (55.2%), and Structure Fires (27.8%).