Averages for the 2020 tax year for zip code 72717, filed in 2021:
Average Adjusted Gross Income (AGI) in 2020: $43,442 (Individual Income Tax Returns)
Here:
$43,442
State:
$64,872
Salary/wage: $41,815 (reported on 78.8% of returns)
Here:
$41,815
State:
$50,644
(% of AGI for various income ranges: 1207.0% for AGIs below $25k, 3830.0% for AGIs $25k-50k, 5445.0% for AGIs $50k-75k, 5613.3% for AGIs $75k-100k)
Taxable interest for individuals: $488 (reported on 24.2% of returns)
This zip code:
$488
Arkansas:
$1,857
(% of AGI for various income ranges: 18.0% for AGIs below $25k, 21.4% for AGIs $25k-50k, 20.0% for AGIs $75k-100k)
Ordinary dividends: $667 (reported on 9.1% of returns)
Here:
$667
State:
$21,681
(% of AGI for various income ranges: 28.6% for AGIs $25k-50k)
Net capital gain/loss in AGI: +$3,267 (reported on 9.1% of returns)
Here:
+$3,267
State:
+$22,815
(% of AGI for various income ranges: 140.0% for AGIs $25k-50k)
Profit/loss from business: +$6,314 (reported on 21.2% of returns)
Here:
+$6,314
State:
+$9,743
(% of AGI for various income ranges: 178.0% for AGIs below $25k, 377.1% for AGIs $25k-50k)
Earned income credit: $2,825 (reported on 24.2% of returns)
Here:
$2,825
State:
$2,546
(% of AGI for various income ranges: 144.0% for AGIs below $25k, 117.1% for AGIs $25k-50k)
Percentage of individuals using paid preparers for their 2020 taxes: 90.9%
Here:
91%
State:
94%
(% for various income ranges: 92.3% for AGIs below $25k, 90.0% for AGIs $25k-50k, 100.0% for AGIs $50k-75k, 66.7% for AGIs $75k-100k, 100.0% for AGIs $100k-200k)
Averages for the 2012 tax year for zip code 72717, filed in 2013:
Average Adjusted Gross Income (AGI) in 2012: $40,470 (Individual Income Tax Returns)
Here:
$40,470
State:
$52,148
Salary/wage: $35,496 (reported on 76.7% of returns)
Here:
$35,496
State:
$41,669
(% of AGI for various income ranges: 71.7% for AGIs below $25k, 78.2% for AGIs $25k-50k, 108.0% for AGIs $50k-75k)
Taxable interest for individuals: $712 (reported on 26.7% of returns)
This zip code:
$712
Arkansas:
$1,648
(% of AGI for various income ranges: 1.5% for AGIs below $25k, 0.8% for AGIs $25k-50k, 0.2% for AGIs $50k-75k)
Ordinary dividends: $425 (reported on 13.3% of returns)
Here:
$425
State:
$20,675
Net capital gain/loss in AGI: +$5,050 (reported on 13.3% of returns)
Here:
+$5,050
State:
+$15,222
Profit/loss from business: +$4,280 (reported on 16.7% of returns)
Here:
+$4,280
State:
+$9,665
Total itemized deductions: $16,900 (21% of AGI, reported on 16.7% of returns)
Here:
$16,900
State:
$23,276
Here:
20.8% of AGI
State:
19.1% of AGI
Charity contributions: $3,833 (reported on 10.0% of returns)
Here:
$3,833
State:
$5,996
Taxes paid: $3,660 (reported on 16.7% of returns)
72717:
$3,660
State:
$7,941
Earned income credit: $2,438 (reported on 26.7% of returns)
Here:
$2,438
State:
$2,455
(% of AGI for various income ranges: 10.9% for AGIs below $25k)
Percentage of individuals using paid preparers for their 2012 taxes: 70.0%
Here:
70%
State:
61%
(% for various income ranges: 64.3% for AGIs below $25k, 71.4% for AGIs $25k-50k, 100.0% for AGIs $50k-75k)
Averages for the 2004 tax year for zip code 72717, filed in 2005:
Average Adjusted Gross Income (AGI) in 2004: $28,150 (Individual Income Tax Returns)
Here:
$28,150
State:
$39,270
Salary/wage: $28,431 (reported on 77.3% of returns)
Here:
$28,431
State:
$34,079
(% of AGI for various income ranges: 5614.3% for AGIs below $10k, 82.3% for AGIs $10k-25k, 86.9% for AGIs $25k-50k, 81.6% for AGIs $50k-75k, 41.2% for AGIs $75k-100k)
Taxable interest for individuals: $1,044 (reported on 33.3% of returns)
This zip code:
$1,044
Arkansas:
$1,904
(% of AGI for various income ranges: 114.3% for AGIs below $10k, 1.5% for AGIs $10k-25k, 1.8% for AGIs $25k-50k, 0.6% for AGIs $50k-75k, 0.5% for AGIs $75k-100k)
Taxable dividends: $831 (reported on 17.4% of returns)
Here:
$831
State:
$5,995
Net capital gain/loss: +$6,720 (reported on 14.7% of returns)
Here:
+$6,720
State:
+$10,430
(% of AGI for various income ranges: -114.3% for AGIs below $10k, 3.1% for AGIs $10k-25k, 0.6% for AGIs $25k-50k, 11.9% for AGIs $75k-100k)
Profit/loss from business: +$5,000 (reported on 16.8% of returns)
Here:
+$5,000
State:
+$7,823
Total itemized deductions: $15,317 (26% of AGI, reported on 12.1% of returns)
Here:
$15,317
State:
$18,389
Here:
26.2% of AGI
State:
21.0% of AGI
Charity contributions deductions: $1,923 (3% of AGI, reported on 7.7% of returns)
Here:
$1,923
State:
$4,725
Here:
3.1% of AGI
State:
5.1% of AGI
Total tax: $3,349 (reported on 69.3% of returns)
72717:
$3,349
State:
$6,047
(% of AGI for various income ranges: 357.1% for AGIs below $10k, 4.8% for AGIs $10k-25k, 5.7% for AGIs $25k-50k, 8.8% for AGIs $50k-75k, 13.0% for AGIs $75k-100k)
Earned income credit: $2,000 (reported on 23.9% of returns)
Here:
$2,000
State:
$1,909
Percentage of individuals using paid preparers for their 2004 taxes: 76.4%
Here:
76%
State:
67%
(% for various income ranges: 68.9% for AGIs below $10k, 78.8% for AGIs $10k-25k, 78.5% for AGIs $25k-50k, 75.7% for AGIs $50k-75k, 90.0% for AGIs $75k-100k)
Household received Food Stamps/SNAP in the past 12 months: 51 Household did not receive Food Stamps/SNAP in the past 12 months: 437
Women who did not have a birth in the past 12 months: 280 (196 now married, 84 unmarried)
Housing units in zip code 72717 with a mortgage: 36 Median monthly owner costs for units with a mortgage: $1,301 Median monthly owner costs for units without a mortgage: $355
Residents with income below the poverty level in 2022:
This zip code:
7.4%
Whole state:
16.8%
Residents with income below 50% of the poverty level in 2022:
This zip code:
4.3%
Whole state:
8.5%
Median number of rooms in houses and condos:
Here:
5.7
State:
6.1
Median number of rooms in apartments:
Here:
6.8
State:
4.3
Notable locations in this zip code not listed on our city pages
Churches in zip code 72717 include: Mount Pleasant Church (A), Hale Mountain Church (B), Fly Creek Church (C), Apostolic Church (D), Antioch Church (E), Vineyard Church (F). Display/hide their locations on the map
Cemeteries: Bethesda Cemetery (1), Goddard Cemetery (2), English Cemetery (3), Edmiston Cemetery (4), Kidd Cemetery (5), Russell Cemetery (6), Drake Cemetery (7). Display/hide their locations on the map
Size of family households: 147 2-persons, 190 3-persons, 23 4-persons, 15 6-persons
Size of nonfamily households: 65 1-person, 38 2-persons
169 married couples with children.
0 single-parent households ().
68.7% of residents of 72717 zip code speak English at home.
29.1% of residents speak Spanish at home (30% very well, 35% well, 36% not well).
1.0% of residents speak other language at home (100% not well).
Foreign born population: 368 (30.8%) (9.1% of them are naturalized citizens)
This zip code:
30.8%
Whole state:
5.1%
66%Honduras
35%Bolivia
28%Brazilian
19%American
8%German
3%English
2%Finnish
2%Scotch-Irish
2%Irish
Year of entry for the foreign-born population
3742010 or later
322000 to 2009
01990 to 1999
0Before 1990
Housing units lacking complete plumbing facilities: 6.4% Housing units lacking complete kitchen facilities: 6.1%
50.3%Electricity
30.3%Bottled, tank, or LP gas
19.8%Wood
Population in 1990: 781. Population change in the 1990s: +66 (+8.5%).
Place of birth for U.S.-born residents:
This state: 495
Northeast: 24
Midwest: 87
South: 156
West: 66
61% of the 72717 zip code residents lived in the same house 5 years ago. Out of people who lived in different houses, 76% lived in this county. Out of people who lived in different counties, 50% lived in Arkansas.
93% of the 72717 zip code residents lived in the same house 1 year ago. Out of people who lived in different houses, 39% moved from this county. Out of people who lived in different houses, 63% moved from different county within same state.
Private vs. public school enrollment:
Students in private schools in grades 1 to 8 (elementary and middle school): 19
Here:
100.0%
Arkansas:
10.5%
Students in private schools in grades 9 to 12 (high school):
Here:
0.0%
Arkansas:
8.7%
Students in private undergraduate colleges:
Here:
0.0%
Arkansas:
19.4%
Occupation by median earnings in the past 12 months ($)
64,736Management occupations
61,482Office and administrative support occupations
55,884Production occupations
49,459Transportation occupations
36,699Farming, fishing, and forestry occupations
Top industries in this zip code by the number of employees in 2005:
Management of Companies and Enterprises: Corporate, Subsidiary, and Regional Managing Offices (20-49 employees: 1 establishment)
Construction: Other Heavy and Civil Engineering Construction (10-19: 1)
Construction: New Single-Family Housing Construction (except Operative Builders) (5-9: 1, 1-4: 1)
Construction: Electrical Contractors (1-4: 1)
Finance and Insurance: Insurance Agencies and Brokerages (1-4: 1)
Home Mortgage Disclosure Act Aggregated Statistics For Year 2009 (Based on 2 partial tracts)
A) FHA, FSA/RHS & VA Home Purchase Loans
B) Conventional Home Purchase Loans
C) Refinancings
D) Home Improvement Loans
F) Non-occupant Loans on < 5 Family Dwellings (A B C & D)
G) Loans On Manufactured Home Dwelling (A B C & D)
Number
Average Value
Number
Average Value
Number
Average Value
Number
Average Value
Number
Average Value
Number
Average Value
LOANS ORIGINATED
4
$117,928
4
$105,428
27
$101,982
3
$33,077
2
$45,735
2
$41,860
APPLICATIONS APPROVED, NOT ACCEPTED
1
$41,090
0
$0
0
$0
0
$0
0
$0
0
$0
APPLICATIONS DENIED
0
$0
3
$59,690
9
$124,161
0
$0
2
$27,715
0
$0
APPLICATIONS WITHDRAWN
2
$48,450
0
$0
5
$128,064
1
$16,670
0
$0
0
$0
FILES CLOSED FOR INCOMPLETENESS
0
$0
1
$70,160
1
$86,430
0
$0
0
$0
0
$0
Aggregated Statistics For Year 2008 (Based on 2 partial tracts)
A) FHA, FSA/RHS & VA Home Purchase Loans
B) Conventional Home Purchase Loans
C) Refinancings
D) Home Improvement Loans
F) Non-occupant Loans on < 5 Family Dwellings (A B C & D)
G) Loans On Manufactured Home Dwelling (A B C & D)
Number
Average Value
Number
Average Value
Number
Average Value
Number
Average Value
Number
Average Value
Number
Average Value
LOANS ORIGINATED
3
$114,083
7
$97,454
25
$90,698
8
$31,638
2
$28,295
7
$46,401
APPLICATIONS APPROVED, NOT ACCEPTED
0
$0
1
$63,950
1
$174,030
1
$10,080
0
$0
1
$74,810
APPLICATIONS DENIED
2
$102,910
6
$94,510
13
$125,225
3
$31,007
2
$62,595
2
$78,875
APPLICATIONS WITHDRAWN
2
$93,220
1
$181,400
5
$99,690
0
$0
0
$0
0
$0
FILES CLOSED FOR INCOMPLETENESS
0
$0
0
$0
1
$73,260
0
$0
0
$0
0
$0
Aggregated Statistics For Year 2007 (Based on 2 partial tracts)
A) FHA, FSA/RHS & VA Home Purchase Loans
B) Conventional Home Purchase Loans
C) Refinancings
D) Home Improvement Loans
F) Non-occupant Loans on < 5 Family Dwellings (A B C & D)
G) Loans On Manufactured Home Dwelling (A B C & D)
Number
Average Value
Number
Average Value
Number
Average Value
Number
Average Value
Number
Average Value
Number
Average Value
LOANS ORIGINATED
1
$65,500
5
$80,854
29
$106,390
7
$41,916
3
$78,683
2
$82,170
APPLICATIONS APPROVED, NOT ACCEPTED
0
$0
0
$0
2
$206,785
0
$0
0
$0
0
$0
APPLICATIONS DENIED
1
$71,710
8
$84,061
14
$124,060
3
$19,250
0
$0
3
$73,387
APPLICATIONS WITHDRAWN
0
$0
2
$62,210
7
$131,673
0
$0
1
$53,100
0
$0
FILES CLOSED FOR INCOMPLETENESS
0
$0
0
$0
1
$100,780
0
$0
0
$0
0
$0
Aggregated Statistics For Year 2006 (Based on 2 partial tracts)
A) FHA, FSA/RHS & VA Home Purchase Loans
B) Conventional Home Purchase Loans
C) Refinancings
D) Home Improvement Loans
F) Non-occupant Loans on < 5 Family Dwellings (A B C & D)
G) Loans On Manufactured Home Dwelling (A B C & D)
Number
Average Value
Number
Average Value
Number
Average Value
Number
Average Value
Number
Average Value
Number
Average Value
LOANS ORIGINATED
2
$134,690
14
$90,283
32
$108,201
11
$33,157
4
$102,618
6
$58,270
APPLICATIONS APPROVED, NOT ACCEPTED
1
$76,740
3
$88,243
4
$160,272
1
$102,330
0
$0
1
$36,050
APPLICATIONS DENIED
0
$0
10
$83,683
13
$109,273
3
$45,090
1
$84,500
3
$60,983
APPLICATIONS WITHDRAWN
1
$60,850
5
$62,636
7
$86,877
1
$37,210
1
$27,520
1
$57,360
FILES CLOSED FOR INCOMPLETENESS
0
$0
2
$134,690
1
$74,420
0
$0
0
$0
0
$0
Aggregated Statistics For Year 2005 (Based on 2 partial tracts)
A) FHA, FSA/RHS & VA Home Purchase Loans
B) Conventional Home Purchase Loans
C) Refinancings
D) Home Improvement Loans
F) Non-occupant Loans on < 5 Family Dwellings (A B C & D)
G) Loans On Manufactured Home Dwelling (A B C & D)
Number
Average Value
Number
Average Value
Number
Average Value
Number
Average Value
Number
Average Value
Number
Average Value
LOANS ORIGINATED
2
$79,460
14
$91,446
36
$79,382
16
$39,148
4
$67,928
9
$66,882
APPLICATIONS APPROVED, NOT ACCEPTED
0
$0
1
$52,330
1
$82,950
0
$0
0
$0
0
$0
APPLICATIONS DENIED
2
$65,310
10
$69,380
14
$108,306
4
$24,225
0
$0
5
$54,264
APPLICATIONS WITHDRAWN
0
$0
2
$69,575
6
$107,623
2
$132,945
1
$41,090
1
$66,280
FILES CLOSED FOR INCOMPLETENESS
0
$0
1
$41,860
2
$127,520
0
$0
0
$0
0
$0
Aggregated Statistics For Year 2004 (Based on 2 partial tracts)
A) FHA, FSA/RHS & VA Home Purchase Loans
B) Conventional Home Purchase Loans
C) Refinancings
D) Home Improvement Loans
F) Non-occupant Loans on < 5 Family Dwellings (A B C & D)
G) Loans On Manufactured Home Dwelling (A B C & D)
Number
Average Value
Number
Average Value
Number
Average Value
Number
Average Value
Number
Average Value
Number
Average Value
LOANS ORIGINATED
3
$108,527
12
$81,202
36
$74,118
12
$21,706
5
$55,970
7
$49,946
APPLICATIONS APPROVED, NOT ACCEPTED
0
$0
2
$123,840
4
$101,648
0
$0
0
$0
1
$84,880
APPLICATIONS DENIED
1
$70,930
6
$72,223
13
$80,681
3
$32,687
0
$0
5
$58,916
APPLICATIONS WITHDRAWN
0
$0
2
$58,140
10
$86,512
1
$46,510
1
$58,920
1
$32,170
FILES CLOSED FOR INCOMPLETENESS
0
$0
0
$0
2
$93,220
0
$0
0
$0
0
$0
Aggregated Statistics For Year 2003 (Based on 2 partial tracts)
A) FHA, FSA/RHS & VA Home Purchase Loans
B) Conventional Home Purchase Loans
C) Refinancings
D) Home Improvement Loans
F) Non-occupant Loans on < 5 Family Dwellings (A B C & D)
Number
Average Value
Number
Average Value
Number
Average Value
Number
Average Value
Number
Average Value
LOANS ORIGINATED
5
$82,792
15
$63,670
44
$78,859
5
$28,604
3
$45,480
APPLICATIONS APPROVED, NOT ACCEPTED
0
$0
2
$47,870
2
$75,775
0
$0
0
$0
APPLICATIONS DENIED
0
$0
9
$62,059
21
$77,040
2
$6,010
0
$0
APPLICATIONS WITHDRAWN
0
$0
2
$44,185
7
$85,439
1
$3,880
1
$24,810
FILES CLOSED FOR INCOMPLETENESS
0
$0
0
$0
2
$55,620
0
$0
0
$0
Aggregated Statistics For Year 2002 (Based on 2 partial tracts)
A) FHA, FSA/RHS & VA Home Purchase Loans
B) Conventional Home Purchase Loans
C) Refinancings
D) Home Improvement Loans
F) Non-occupant Loans on < 5 Family Dwellings (A B C & D)
Number
Average Value
Number
Average Value
Number
Average Value
Number
Average Value
Number
Average Value
LOANS ORIGINATED
2
$116,475
12
$72,869
36
$72,740
8
$18,362
5
$53,412
APPLICATIONS APPROVED, NOT ACCEPTED
0
$0
2
$53,295
5
$62,868
0
$0
0
$0
APPLICATIONS DENIED
1
$106,980
7
$51,053
12
$81,622
2
$27,520
0
$0
APPLICATIONS WITHDRAWN
0
$0
2
$155,620
4
$75,970
0
$0
0
$0
FILES CLOSED FOR INCOMPLETENESS
0
$0
0
$0
3
$100,907
0
$0
0
$0
Aggregated Statistics For Year 2001 (Based on 2 partial tracts)
A) FHA, FSA/RHS & VA Home Purchase Loans
B) Conventional Home Purchase Loans
C) Refinancings
D) Home Improvement Loans
F) Non-occupant Loans on < 5 Family Dwellings (A B C & D)
Number
Average Value
Number
Average Value
Number
Average Value
Number
Average Value
Number
Average Value
LOANS ORIGINATED
2
$67,250
10
$51,745
26
$76,805
7
$24,584
5
$38,062
APPLICATIONS APPROVED, NOT ACCEPTED
0
$0
2
$39,340
0
$0
1
$12,400
0
$0
APPLICATIONS DENIED
1
$55,430
6
$35,142
14
$78,323
3
$21,317
0
$0
APPLICATIONS WITHDRAWN
0
$0
3
$49,483
5
$79,148
1
$34,110
1
$50,390
FILES CLOSED FOR INCOMPLETENESS
0
$0
0
$0
0
$0
0
$0
0
$0
Aggregated Statistics For Year 2000 (Based on 2 partial tracts)
A) FHA, FSA/RHS & VA Home Purchase Loans
B) Conventional Home Purchase Loans
C) Refinancings
D) Home Improvement Loans
F) Non-occupant Loans on < 5 Family Dwellings (A B C & D)
Number
Average Value
Number
Average Value
Number
Average Value
Number
Average Value
Number
Average Value
LOANS ORIGINATED
2
$63,180
12
$53,682
21
$55,205
7
$19,103
3
$47,417
APPLICATIONS APPROVED, NOT ACCEPTED
1
$24,030
3
$54,133
3
$39,407
2
$12,405
1
$31,780
APPLICATIONS DENIED
1
$49,230
13
$45,200
14
$49,530
4
$12,015
0
$0
APPLICATIONS WITHDRAWN
1
$94,570
2
$35,270
2
$76,550
0
$0
0
$0
FILES CLOSED FOR INCOMPLETENESS
0
$0
0
$0
2
$31,590
0
$0
0
$0
Aggregated Statistics For Year 1999 (Based on 1 partial tract)
A) FHA, FSA/RHS & VA Home Purchase Loans
B) Conventional Home Purchase Loans
C) Refinancings
D) Home Improvement Loans
F) Non-occupant Loans on < 5 Family Dwellings (A B C & D)
Detailed PMIC statistics for the following Tracts:0110.04
2002 - 2018 National Fire Incident Reporting System (NFIRS) incidents
Based on the data from the years 2002 - 2018 the average number of fires per year is 13. The highest number of reported fire incidents - 22 took place in 2007, and the least - 2 in 2002. The data has a rising trend.
When looking into fire subcategories, the most reports belonged to: Outside Fires (56.8%), and Structure Fires (33.8%).
Fire incident types reported to NFIRS in Zip Code 72717

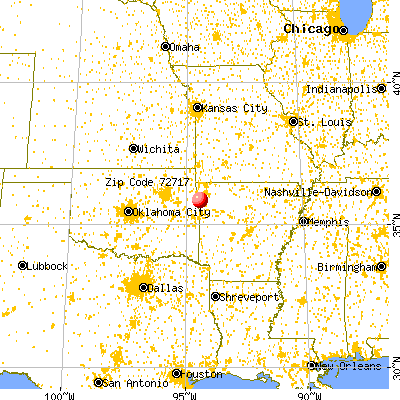


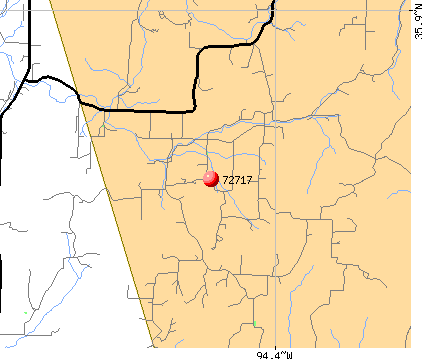 Nearest zip codes: 72749, 72729, 72753, 72744, 72948, 72934.


 Based on the data from the years 2002 - 2018 the average number of fires per year is 13. The highest number of reported fire incidents - 22 took place in 2007, and the least - 2 in 2002. The data has a rising trend.
 When looking into fire subcategories, the most reports belonged to: Outside Fires (56.8%), and Structure Fires (33.8%).