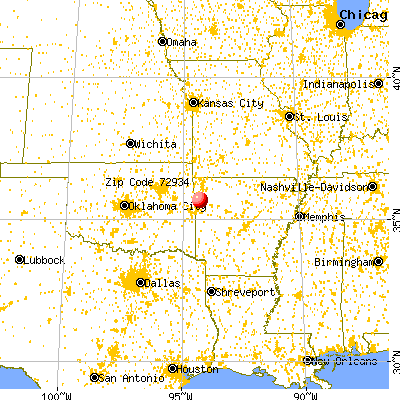
Averages for the 2020 tax year for zip code 72934, filed in 2021:
Average Adjusted Gross Income (AGI) in 2020: $41,932 (Individual Income Tax Returns)
Here:
$41,932
State:
$64,872
Salary/wage: $41,340 (reported on 80.6% of returns)
Here:
$41,340
State:
$50,644
(% of AGI for various income ranges: 1128.9% for AGIs below $25k, 3277.1% for AGIs $25k-50k, 6582.5% for AGIs $50k-75k, 4792.5% for AGIs $75k-100k)
Taxable interest for individuals: $420 (reported on 16.1% of returns)
This zip code:
$420
Arkansas:
$1,857
(% of AGI for various income ranges: 7.8% for AGIs below $25k, 35.0% for AGIs $50k-75k)
Ordinary dividends: $367 (reported on 9.7% of returns)
Here:
$367
State:
$21,681
(% of AGI for various income ranges: 27.5% for AGIs $50k-75k)
Net capital gain/loss in AGI: +$1,533 (reported on 9.7% of returns)
Here:
+$1,533
State:
+$22,815
(% of AGI for various income ranges: 65.7% for AGIs $25k-50k)
Profit/loss from business: +$6,229 (reported on 22.6% of returns)
Here:
+$6,229
State:
+$9,743
(% of AGI for various income ranges: 251.1% for AGIs below $25k, 525.0% for AGIs $50k-75k)
Earned income credit: $2,750 (reported on 25.8% of returns)
Here:
$2,750
State:
$2,546
(% of AGI for various income ranges: 151.1% for AGIs below $25k, 120.0% for AGIs $25k-50k)
Percentage of individuals using paid preparers for their 2020 taxes: 93.5%
Here:
94%
State:
94%
(% for various income ranges: 91.7% for AGIs below $25k, 100.0% for AGIs $25k-50k, 83.3% for AGIs $50k-75k, 100.0% for AGIs $75k-100k, 100.0% for AGIs $100k-200k)
Averages for the 2012 tax year for zip code 72934, filed in 2013:
Average Adjusted Gross Income (AGI) in 2012: $30,303 (Individual Income Tax Returns)
Here:
$30,303
State:
$52,148
Salary/wage: $32,495 (reported on 75.9% of returns)
Here:
$32,495
State:
$41,669
(% of AGI for various income ranges: 73.3% for AGIs below $25k, 83.1% for AGIs $25k-50k, 81.4% for AGIs $50k-75k, 86.6% for AGIs $75k-100k)
Taxable interest for individuals: $350 (reported on 13.8% of returns)
This zip code:
$350
Arkansas:
$1,648
Ordinary dividends: $367 (reported on 10.3% of returns)
Here:
$367
State:
$20,675
Net capital gain/loss in AGI: +$1,200 (reported on 6.9% of returns)
Here:
+$1,200
State:
+$15,222
Profit/loss from business: +$6,600 (reported on 20.7% of returns)
Here:
+$6,600
State:
+$9,665
Total itemized deductions: $18,300 (25% of AGI, reported on 10.3% of returns)
Here:
$18,300
State:
$23,276
Here:
25.1% of AGI
State:
19.1% of AGI
Taxes paid: $4,867 (reported on 10.3% of returns)
72934:
$4,867
State:
$7,941
Earned income credit: $2,811 (reported on 31.0% of returns)
Here:
$2,811
State:
$2,455
(% of AGI for various income ranges: 10.2% for AGIs below $25k, 2.2% for AGIs $25k-50k)
Percentage of individuals using paid preparers for their 2012 taxes: 65.5%
Here:
66%
State:
61%
(% for various income ranges: 62.5% for AGIs below $25k, 57.1% for AGIs $25k-50k, 125.0% for AGIs $50k-75k)
Averages for the 2004 tax year for zip code 72934, filed in 2005:
Average Adjusted Gross Income (AGI) in 2004: $26,653 (Individual Income Tax Returns)
Here:
$26,653
State:
$39,270
Salary/wage: $27,122 (reported on 86.5% of returns)
Here:
$27,122
State:
$34,079
(% of AGI for various income ranges: 72.2% for AGIs below $10k, 83.2% for AGIs $10k-25k, 92.8% for AGIs $25k-50k, 97.6% for AGIs $50k-75k, 71.2% for AGIs $75k-100k)
Taxable interest for individuals: $979 (reported on 15.8% of returns)
This zip code:
$979
Arkansas:
$1,904
Taxable dividends: $48 (reported on 6.9% of returns)
Here:
$48
State:
$5,995
Net capital gain/loss: +$1,263 (reported on 6.3% of returns)
Here:
+$1,263
State:
+$10,430
Profit/loss from business: +$5,774 (reported on 17.5% of returns)
Here:
+$5,774
State:
+$7,823
Total itemized deductions: $14,000 (29% of AGI, reported on 8.6% of returns)
Here:
$14,000
State:
$18,389
Here:
29.0% of AGI
State:
21.0% of AGI
Charity contributions deductions: $1,143 (2% of AGI, reported on 4.6% of returns)
Here:
$1,143
State:
$4,725
Here:
2.1% of AGI
State:
5.1% of AGI
Total tax: $2,750 (reported on 64.7% of returns)
72934:
$2,750
State:
$6,047
(% of AGI for various income ranges: 4.3% for AGIs below $10k, 4.1% for AGIs $10k-25k, 5.1% for AGIs $25k-50k, 8.3% for AGIs $50k-75k, 14.1% for AGIs $75k-100k)
Earned income credit: $1,960 (reported on 32.7% of returns)
Here:
$1,960
State:
$1,909
Percentage of individuals using paid preparers for their 2004 taxes: 71.6%
Here:
72%
State:
67%
(% for various income ranges: 68.9% for AGIs below $10k, 72.0% for AGIs $10k-25k, 75.6% for AGIs $25k-50k, 93.1% for AGIs $50k-75k)
Churches in zip code 72934 include: Freedom Church (A), Eightyeight Church (B), Number 12 Church (C), Shamrock Church (D). Display/hide their locations on the map
Cemeteries: Oak Grove Cemetery (1), Kimes Cemetery (2), Kimbler Cemetery (3), Bryant Cemetery (4), Chester Cemetery (5). Display/hide their locations on the map
Streams, rivers, and creeks: Elmo Creek (A), Ben Doodle Branch (B), Blackburn Creek (C), Mill Branch (D), McCaslin Branch (E), Locust Creek (F), Wilson Branch (G), Hart Creek (H), Farm Branch (I). Display/hide their locations on the map
Size of family households: 257 2-persons, 98 3-persons, 4 4-persons, 1 5-persons
Size of nonfamily households: 82 1-person
29 married couples with children.
54 single-parent households (54 men).
All residents speak English at home
Foreign born population: 0 (0.0%)
:
0.0%
Whole state:
5.1%
50%American
8%Polish
6%Czech
4%European
1%Irish
0%English
0%French Canadian
Year of entry for the foreign-born population
22010 or later
02000 to 2009
01990 to 1999
12Before 1990
Housing units lacking complete plumbing facilities: 1.4% Housing units lacking complete kitchen facilities: 0.8%
41.6%Wood
28.4%Electricity
17.4%Bottled, tank, or LP gas
12.9%Other fuel
Population in 1990: 1,004.
Place of birth for U.S.-born residents:
This state: 881
South: 78
West: 60
68% of the 72934 zip code residents lived in the same house 5 years ago. Out of people who lived in different houses, 58% lived in this county. Out of people who lived in different counties, 50% lived in Arkansas.
100% of the 72934 zip code residents lived in the same house 1 year ago.
Private vs. public school enrollment:
Students in private schools in grades 1 to 8 (elementary and middle school):
Here:
0.0%
Arkansas:
10.5%
Students in private schools in grades 9 to 12 (high school): 56
Here:
91.9%
Arkansas:
8.7%
Students in private undergraduate colleges:
Here:
0.0%
Arkansas:
19.4%
Top industries in this zip code by the number of employees in 2005:
Arts, Entertainment, and Recreation: Promoters of Performing Arts, Sports, and Similar Events without Facilities (1-4 employees: 1 establishment)
Information: Internet Service Providers (1-4: 1)
Other Services (except Public Administration): Other Automotive Mechanical and Electrical Repair and Maintenance (1-4: 1)
Construction: Framing Contractors (1-4: 1)
Construction: Residential Remodelers (1-4: 1)
Fatal accident statistics in 2011:
Fatal accident count: 1
Vehicles involved in fatal accidents: 1
Fatal accidents caused by drunken drivers: 0
Fatalities: 1
Persons involved in fatal accidents: 1
Pedestrians involved in fatal accidents: 0
Home Mortgage Disclosure Act Aggregated Statistics For Year 2009 (Based on 4 partial tracts)
A) FHA, FSA/RHS & VA Home Purchase Loans
B) Conventional Home Purchase Loans
C) Refinancings
D) Home Improvement Loans
F) Non-occupant Loans on < 5 Family Dwellings (A B C & D)
G) Loans On Manufactured Home Dwelling (A B C & D)
Number
Average Value
Number
Average Value
Number
Average Value
Number
Average Value
Number
Average Value
Number
Average Value
LOANS ORIGINATED
19
$109,870
18
$63,429
59
$102,096
10
$31,668
10
$56,966
14
$36,250
APPLICATIONS APPROVED, NOT ACCEPTED
0
$0
1
$138,800
1
$146,960
1
$5,680
0
$0
0
$0
APPLICATIONS DENIED
4
$102,870
11
$59,406
18
$119,218
7
$19,637
1
$30,270
8
$52,940
APPLICATIONS WITHDRAWN
1
$50,570
2
$51,810
11
$124,463
1
$74,820
1
$41,030
0
$0
FILES CLOSED FOR INCOMPLETENESS
2
$75,245
1
$66,370
2
$101,450
0
$0
0
$0
0
$0
Aggregated Statistics For Year 2008 (Based on 4 partial tracts)
A) FHA, FSA/RHS & VA Home Purchase Loans
B) Conventional Home Purchase Loans
C) Refinancings
D) Home Improvement Loans
F) Non-occupant Loans on < 5 Family Dwellings (A B C & D)
G) Loans On Manufactured Home Dwelling (A B C & D)
Number
Average Value
Number
Average Value
Number
Average Value
Number
Average Value
Number
Average Value
Number
Average Value
LOANS ORIGINATED
10
$128,504
24
$82,966
48
$90,382
14
$42,227
11
$42,392
16
$42,409
APPLICATIONS APPROVED, NOT ACCEPTED
1
$55,040
3
$64,477
3
$119,920
1
$18,690
1
$31,480
2
$53,800
APPLICATIONS DENIED
2
$113,355
11
$60,857
26
$127,723
5
$39,418
4
$49,025
10
$45,020
APPLICATIONS WITHDRAWN
1
$121,960
4
$74,725
11
$145,257
1
$24,760
2
$82,115
1
$44,570
FILES CLOSED FOR INCOMPLETENESS
1
$131,180
0
$0
6
$104,075
0
$0
0
$0
0
$0
Aggregated Statistics For Year 2007 (Based on 4 partial tracts)
A) FHA, FSA/RHS & VA Home Purchase Loans
B) Conventional Home Purchase Loans
C) Refinancings
D) Home Improvement Loans
F) Non-occupant Loans on < 5 Family Dwellings (A B C & D)
G) Loans On Manufactured Home Dwelling (A B C & D)
Number
Average Value
Number
Average Value
Number
Average Value
Number
Average Value
Number
Average Value
Number
Average Value
LOANS ORIGINATED
9
$99,936
35
$95,717
59
$84,482
22
$37,248
15
$79,186
18
$40,873
APPLICATIONS APPROVED, NOT ACCEPTED
0
$0
5
$81,046
6
$102,350
1
$89,340
0
$0
4
$63,785
APPLICATIONS DENIED
1
$45,510
20
$76,934
28
$111,664
8
$30,722
2
$89,325
11
$54,725
APPLICATIONS WITHDRAWN
1
$41,280
5
$72,918
14
$105,482
1
$60,840
1
$58,420
1
$50,570
FILES CLOSED FOR INCOMPLETENESS
0
$0
1
$129,520
4
$100,725
0
$0
1
$62,950
0
$0
Aggregated Statistics For Year 2006 (Based on 4 partial tracts)
A) FHA, FSA/RHS & VA Home Purchase Loans
B) Conventional Home Purchase Loans
C) Refinancings
D) Home Improvement Loans
F) Non-occupant Loans on < 5 Family Dwellings (A B C & D)
G) Loans On Manufactured Home Dwelling (A B C & D)
Number
Average Value
Number
Average Value
Number
Average Value
Number
Average Value
Number
Average Value
Number
Average Value
LOANS ORIGINATED
9
$80,067
39
$96,129
58
$82,895
20
$38,628
11
$70,768
17
$53,385
APPLICATIONS APPROVED, NOT ACCEPTED
0
$0
4
$62,925
8
$84,359
1
$51,510
0
$0
3
$53,873
APPLICATIONS DENIED
3
$91,243
17
$75,084
22
$87,880
11
$15,079
2
$126,225
9
$46,127
APPLICATIONS WITHDRAWN
1
$73,830
4
$91,515
25
$98,542
1
$27,350
2
$95,355
0
$0
FILES CLOSED FOR INCOMPLETENESS
0
$0
1
$36,120
6
$93,125
0
$0
1
$44,380
0
$0
Aggregated Statistics For Year 2005 (Based on 4 partial tracts)
A) FHA, FSA/RHS & VA Home Purchase Loans
B) Conventional Home Purchase Loans
C) Refinancings
D) Home Improvement Loans
F) Non-occupant Loans on < 5 Family Dwellings (A B C & D)
G) Loans On Manufactured Home Dwelling (A B C & D)
Number
Average Value
Number
Average Value
Number
Average Value
Number
Average Value
Number
Average Value
Number
Average Value
LOANS ORIGINATED
6
$82,627
39
$75,004
68
$79,767
15
$34,591
15
$61,269
17
$45,535
APPLICATIONS APPROVED, NOT ACCEPTED
1
$73,710
7
$71,267
11
$93,234
1
$84,470
1
$104,200
7
$60,146
APPLICATIONS DENIED
2
$61,155
19
$71,358
29
$80,940
9
$41,489
1
$66,020
14
$52,594
APPLICATIONS WITHDRAWN
1
$20,120
5
$67,800
18
$97,654
2
$209,210
1
$30,440
2
$39,180
FILES CLOSED FOR INCOMPLETENESS
1
$121,280
3
$56,513
7
$95,809
0
$0
1
$67,080
0
$0
Aggregated Statistics For Year 2004 (Based on 4 partial tracts)
A) FHA, FSA/RHS & VA Home Purchase Loans
B) Conventional Home Purchase Loans
C) Refinancings
D) Home Improvement Loans
F) Non-occupant Loans on < 5 Family Dwellings (A B C & D)
G) Loans On Manufactured Home Dwelling (A B C & D)
Number
Average Value
Number
Average Value
Number
Average Value
Number
Average Value
Number
Average Value
Number
Average Value
LOANS ORIGINATED
7
$90,206
36
$71,392
77
$69,646
13
$31,578
12
$55,618
14
$43,998
APPLICATIONS APPROVED, NOT ACCEPTED
1
$49,750
6
$53,950
13
$89,200
1
$20,940
1
$51,600
5
$40,000
APPLICATIONS DENIED
4
$74,425
22
$59,789
37
$73,043
8
$10,961
2
$66,875
14
$35,233
APPLICATIONS WITHDRAWN
2
$90,880
7
$90,001
18
$100,928
1
$15,480
1
$134,670
1
$51,880
FILES CLOSED FOR INCOMPLETENESS
0
$0
1
$46,580
3
$80,883
0
$0
0
$0
0
$0
Aggregated Statistics For Year 2003 (Based on 4 partial tracts)
A) FHA, FSA/RHS & VA Home Purchase Loans
B) Conventional Home Purchase Loans
C) Refinancings
D) Home Improvement Loans
F) Non-occupant Loans on < 5 Family Dwellings (A B C & D)
Number
Average Value
Number
Average Value
Number
Average Value
Number
Average Value
Number
Average Value
LOANS ORIGINATED
12
$70,587
30
$62,742
96
$75,200
15
$15,629
16
$41,861
APPLICATIONS APPROVED, NOT ACCEPTED
1
$47,850
5
$53,772
14
$68,137
0
$0
0
$0
APPLICATIONS DENIED
4
$51,385
27
$47,315
45
$71,369
11
$13,834
1
$73,930
APPLICATIONS WITHDRAWN
2
$78,420
2
$63,650
26
$87,493
2
$16,550
1
$8,770
FILES CLOSED FOR INCOMPLETENESS
1
$35,600
1
$63,880
5
$86,884
0
$0
0
$0
Aggregated Statistics For Year 2002 (Based on 4 partial tracts)
A) FHA, FSA/RHS & VA Home Purchase Loans
B) Conventional Home Purchase Loans
C) Refinancings
D) Home Improvement Loans
F) Non-occupant Loans on < 5 Family Dwellings (A B C & D)
Number
Average Value
Number
Average Value
Number
Average Value
Number
Average Value
Number
Average Value
LOANS ORIGINATED
7
$68,919
33
$65,117
86
$67,587
17
$22,100
13
$41,049
APPLICATIONS APPROVED, NOT ACCEPTED
1
$102,310
9
$41,134
16
$81,556
5
$27,728
0
$0
APPLICATIONS DENIED
2
$50,815
21
$43,717
49
$69,090
10
$14,345
1
$14,450
APPLICATIONS WITHDRAWN
3
$61,060
2
$63,215
16
$76,790
1
$14,080
0
$0
FILES CLOSED FOR INCOMPLETENESS
1
$45,920
0
$0
9
$69,190
0
$0
0
$0
Aggregated Statistics For Year 2001 (Based on 4 partial tracts)
A) FHA, FSA/RHS & VA Home Purchase Loans
B) Conventional Home Purchase Loans
C) Refinancings
D) Home Improvement Loans
F) Non-occupant Loans on < 5 Family Dwellings (A B C & D)
Number
Average Value
Number
Average Value
Number
Average Value
Number
Average Value
Number
Average Value
LOANS ORIGINATED
11
$72,508
27
$74,033
67
$57,492
20
$16,911
10
$52,349
APPLICATIONS APPROVED, NOT ACCEPTED
0
$0
6
$43,288
9
$64,954
1
$30,420
0
$0
APPLICATIONS DENIED
1
$37,370
32
$39,351
41
$57,298
13
$10,792
1
$47,590
APPLICATIONS WITHDRAWN
1
$38,240
2
$81,740
18
$57,277
2
$22,020
1
$73,240
FILES CLOSED FOR INCOMPLETENESS
0
$0
0
$0
5
$65,400
0
$0
0
$0
Aggregated Statistics For Year 2000 (Based on 4 partial tracts)
A) FHA, FSA/RHS & VA Home Purchase Loans
B) Conventional Home Purchase Loans
C) Refinancings
D) Home Improvement Loans
F) Non-occupant Loans on < 5 Family Dwellings (A B C & D)
Number
Average Value
Number
Average Value
Number
Average Value
Number
Average Value
Number
Average Value
LOANS ORIGINATED
5
$61,340
44
$47,873
36
$59,594
16
$12,537
10
$62,081
APPLICATIONS APPROVED, NOT ACCEPTED
2
$55,020
14
$46,651
7
$52,780
4
$29,455
1
$22,450
APPLICATIONS DENIED
2
$69,935
50
$36,643
40
$57,894
13
$12,758
4
$42,740
APPLICATIONS WITHDRAWN
2
$51,255
4
$69,048
17
$48,146
2
$13,320
0
$0
FILES CLOSED FOR INCOMPLETENESS
0
$0
0
$0
2
$112,070
1
$1,030
0
$0
Aggregated Statistics For Year 1999 (Based on 2 partial tracts)
A) FHA, FSA/RHS & VA Home Purchase Loans
B) Conventional Home Purchase Loans
C) Refinancings
D) Home Improvement Loans
F) Non-occupant Loans on < 5 Family Dwellings (A B C & D)
Detailed PMIC statistics for the following Tracts:0201.00
, 0202.01
2002 - 2018 National Fire Incident Reporting System (NFIRS) incidents
Based on the data from the years 2002 - 2018 the average number of fires per year is 9. The highest number of fire incidents - 19 took place in 2012, and the least - 4 in 2004. The data has an increasing trend.
When looking into fire subcategories, the most incidents belonged to: Outside Fires (55.7%), and Structure Fires (29.1%).
Fire incident types reported to NFIRS in Zip Code 72934


 Nearest zip codes: 72948, 72952, 72932, 72946, 72955, 72729.


 Based on the data from the years 2002 - 2018 the average number of fires per year is 9. The highest number of fire incidents - 19 took place in 2012, and the least - 4 in 2004. The data has an increasing trend.
 When looking into fire subcategories, the most incidents belonged to: Outside Fires (55.7%), and Structure Fires (29.1%).