Estimated zip code population in 2022: 2,295 Zip code population in 2010: 2,945 Zip code population in 2000: 2,638
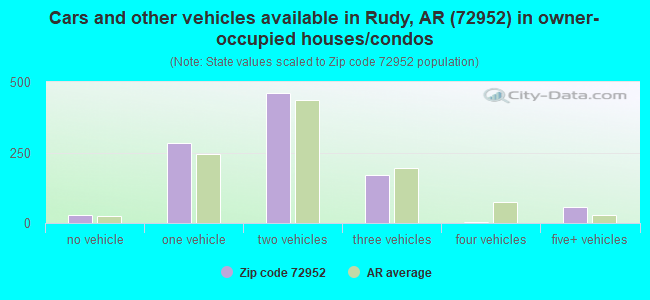
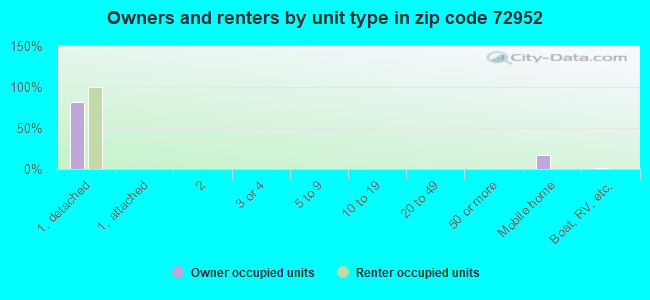
Houses and condos: 1,049 Renter-occupied apartments: 7
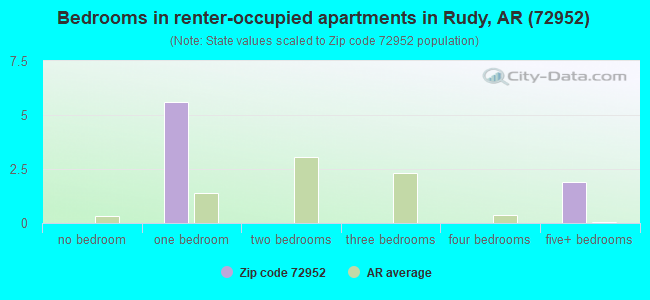
% of renters here:
1%
State:
34%
March 2022 cost of living index in zip code 72952: 75.7 (low, U.S. average is 100)
Land area: 51.1 sq. mi. Water area: 0.0 sq. mi.
Population density: 45 people per square mile
(very low).
OSM Map
General Map
Google Map
MSN Map
OSM Map
General Map
Google Map
MSN Map
OSM Map
General Map
Google Map
MSN Map
OSM Map
General Map
Google Map
MSN Map
Please wait while loading the map...
Real estate property taxes paid for housing units in 2022:
This zip code:
0.4% ($558)
Arkansas:
0.5% ($977)
Median real estate property taxes paid for housing units with mortgages in 2022: $474 (0.2%) Median real estate property taxes paid for housing units with no mortgage in 2022: $801 (0.5%)
Business Search- 14 Million verified businesses
Males: 1,068
(46.5%)
Females: 1,227
(53.5%)
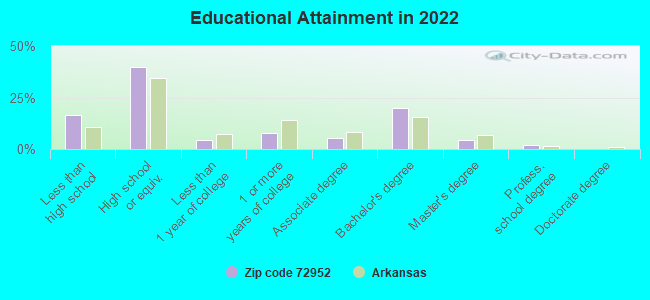
For population 25 years and over in 72952:
High school or higher: 82.3%
Bachelor's degree or higher: 25.8%
Graduate or professional degree: 6.3%
Unemployed: 2.6%
Mean travel time to work (commute): 28.2 minutes
For population 15 years and over in 72952:
Never married: 18.0%
Now married: 56.1%
Separated: 1.0%
Widowed: 10.0%
Divorced: 14.9%
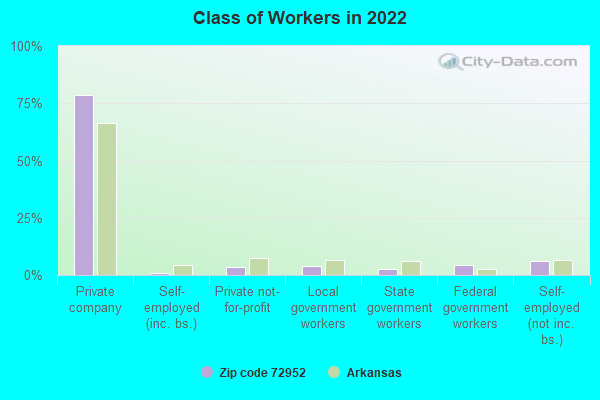
Zip code 72952 compared to state average:
Unemployed percentage below state average.
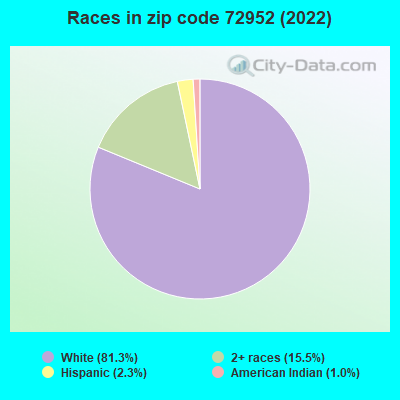
Black race population percentage significantly below state average.
Hispanic race population percentage significantly below state average.
Median age above state average.
Foreign-born population percentage above state average.
Renting percentage significantly below state average.
Number of college students significantly below state average.
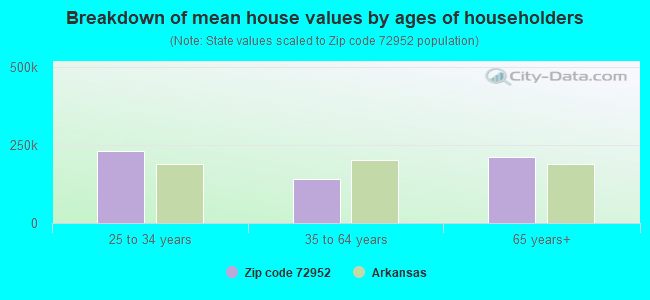
Estimated median house/condo value in 2022: $148,689
72952:
$148,689
Arkansas:
$179,800
According to our research of Arkansas and other state lists, there were 7 registered sex offenders living in 72952 zip code as of May 28, 2024. The ratio of all residents to sex offenders in zip code 72952 is 426 to 1. The ratio of registered sex offenders to all residents in this zip code is near the state average.
Median resident age:
This zip code:
46.1 years
Arkansas median age:
38.9 years
Average household size:
This zip code:
2.3 people
Arkansas:
2.4 people
Averages for the 2020 tax year for zip code 72952, filed in 2021:
Average Adjusted Gross Income (AGI) in 2020: $53,159 (Individual Income Tax Returns)
Here:
$53,159
State:
$64,872
Salary/wage: $47,635 (reported on 78.8% of returns)
Here:
$47,635
State:
$50,644
(% of AGI for various income ranges: 1176.8% for AGIs below $25k, 3670.5% for AGIs $25k-50k, 6343.6% for AGIs $50k-75k, 9458.6% for AGIs $75k-100k, 17050.0% for AGIs $100k-200k)
Taxable interest for individuals: $722 (reported on 27.3% of returns)
This zip code:
$722
Arkansas:
$1,857
(% of AGI for various income ranges: 14.0% for AGIs below $25k, 8.4% for AGIs $25k-50k, 12.7% for AGIs $50k-75k, 5.7% for AGIs $75k-100k, 157.5% for AGIs $100k-200k)
Ordinary dividends: $1,582 (reported on 11.1% of returns)
Here:
$1,582
State:
$21,681
(% of AGI for various income ranges: 30.4% for AGIs below $25k, 29.1% for AGIs $50k-75k, 82.5% for AGIs $100k-200k)
Net capital gain/loss in AGI: +$6,582 (reported on 11.1% of returns)
Here:
+$6,582
State:
+$22,815
(% of AGI for various income ranges: 23.6% for AGIs below $25k, 61.8% for AGIs $50k-75k, 746.2% for AGIs $100k-200k)
Profit/loss from business: +$5,880 (reported on 15.2% of returns)
Here:
+$5,880
State:
+$9,743
(% of AGI for various income ranges: 130.8% for AGIs below $25k, 101.6% for AGIs $25k-50k, 125.5% for AGIs $50k-75k, 320.0% for AGIs $75k-100k)
Taxable individual retirement arrangement distribution: $11,880 (reported on 10.1% of returns)
72952:
$11,880
Arkansas:
$18,502
(% of AGI for various income ranges: 70.4% for AGIs below $25k, 253.2% for AGIs $25k-50k, 758.6% for AGIs $75k-100k)
Total itemized deductions: $40,325 (reported on 4.0% of returns)
Here:
$40,325
State:
$52,840
(% of AGI for various income ranges: 2016.3% for AGIs $100k-200k)
Charity contributions: $10,250 (reported on 4.0% of returns)
Here:
$10,250
State:
$35,735
(% of AGI for various income ranges: 512.5% for AGIs $100k-200k)
Taxes paid: $7,575 (reported on 4.0% of returns)
72952:
$7,575
State:
$7,196
(% of AGI for various income ranges: 378.8% for AGIs $100k-200k)
Earned income credit: $2,300 (reported on 19.2% of returns)
Here:
$2,300
State:
$2,546
(% of AGI for various income ranges: 113.6% for AGIs below $25k, 80.5% for AGIs $25k-50k)
Percentage of individuals using paid preparers for their 2020 taxes: 94.9%
Here:
95%
State:
94%
(% for various income ranges: 97.1% for AGIs below $25k, 92.0% for AGIs $25k-50k, 100.0% for AGIs $50k-75k, 90.0% for AGIs $75k-100k, 93.3% for AGIs $100k-200k)
Averages for the 2012 tax year for zip code 72952, filed in 2013:
Average Adjusted Gross Income (AGI) in 2012: $43,504 (Individual Income Tax Returns)
Here:
$43,504
State:
$52,148
Salary/wage: $38,618 (reported on 86.7% of returns)
Here:
$38,618
State:
$41,669
(% of AGI for various income ranges: 75.9% for AGIs below $25k, 80.2% for AGIs $25k-50k, 77.8% for AGIs $50k-75k, 83.8% for AGIs $75k-100k, 70.6% for AGIs $100k-200k)
Taxable interest for individuals: $620 (reported on 25.5% of returns)
This zip code:
$620
Arkansas:
$1,648
(% of AGI for various income ranges: 0.9% for AGIs below $25k, 0.4% for AGIs $25k-50k, 0.4% for AGIs $50k-75k, 0.2% for AGIs $75k-100k, 0.2% for AGIs $100k-200k)
Ordinary dividends: $733 (reported on 12.2% of returns)
Here:
$733
State:
$20,675
(% of AGI for various income ranges: 0.5% for AGIs below $25k, 0.3% for AGIs $25k-50k, 0.2% for AGIs $50k-75k, 0.2% for AGIs $100k-200k)
Net capital gain/loss in AGI: +$1,570 (reported on 10.2% of returns)
Here:
+$1,570
State:
+$15,222
(% of AGI for various income ranges: 0.4% for AGIs $25k-50k, 0.1% for AGIs $50k-75k, 1.6% for AGIs $75k-100k)
Profit/loss from business: +$6,824 (reported on 17.3% of returns)
Here:
+$6,824
State:
+$9,665
(% of AGI for various income ranges: 10.5% for AGIs below $25k, 2.6% for AGIs $25k-50k, 3.3% for AGIs $50k-75k, 1.0% for AGIs $75k-100k)
Taxable individual retirement arrangement distribution: $11,686 (reported on 7.1% of returns)
72952:
$11,686
Arkansas:
$13,644
Total itemized deductions: $20,520 (24% of AGI, reported on 20.4% of returns)
Here:
$20,520
State:
$23,276
Here:
24.0% of AGI
State:
19.1% of AGI
(% of AGI for various income ranges: 6.4% for AGIs $25k-50k, 8.4% for AGIs $50k-75k, 11.3% for AGIs $75k-100k, 16.2% for AGIs $100k-200k)
Charity contributions: $6,240 (reported on 15.3% of returns)
Here:
$6,240
State:
$5,996
(% of AGI for various income ranges: 1.2% for AGIs $25k-50k, 1.4% for AGIs $50k-75k, 3.1% for AGIs $75k-100k, 4.0% for AGIs $100k-200k)
Taxes paid: $5,780 (reported on 20.4% of returns)
72952:
$5,780
State:
$7,941
(% of AGI for various income ranges: 1.1% for AGIs $25k-50k, 2.1% for AGIs $50k-75k, 3.0% for AGIs $75k-100k, 5.4% for AGIs $100k-200k)
Earned income credit: $2,432 (reported on 25.5% of returns)
Here:
$2,432
State:
$2,455
(% of AGI for various income ranges: 9.0% for AGIs below $25k, 1.7% for AGIs $25k-50k)
Percentage of individuals using paid preparers for their 2012 taxes: 67.3%
Here:
67%
State:
61%
(% for various income ranges: 63.4% for AGIs below $25k, 76.0% for AGIs $25k-50k, 62.5% for AGIs $50k-75k, 75.0% for AGIs $75k-100k, 62.5% for AGIs $100k-200k)
Averages for the 2004 tax year for zip code 72952, filed in 2005:
Average Adjusted Gross Income (AGI) in 2004: $33,518 (Individual Income Tax Returns)
Here:
$33,518
State:
$39,270
Salary/wage: $31,461 (reported on 87.2% of returns)
Here:
$31,461
State:
$34,079
(% of AGI for various income ranges: 117.4% for AGIs below $10k, 81.0% for AGIs $10k-25k, 87.4% for AGIs $25k-50k, 86.3% for AGIs $50k-75k, 89.0% for AGIs $75k-100k, 59.3% for AGIs over 100k)
Taxable interest for individuals: $815 (reported on 28.5% of returns)
This zip code:
$815
Arkansas:
$1,904
(% of AGI for various income ranges: 4.1% for AGIs below $10k, 1.8% for AGIs $10k-25k, 0.6% for AGIs $25k-50k, 0.3% for AGIs $50k-75k, 0.2% for AGIs $75k-100k, 0.3% for AGIs over 100k)
Taxable dividends: $504 (reported on 13.0% of returns)
Here:
$504
State:
$5,995
(% of AGI for various income ranges: 0.9% for AGIs below $10k, 0.2% for AGIs $10k-25k, 0.1% for AGIs $25k-50k, 0.2% for AGIs $50k-75k, 0.4% for AGIs over 100k)
Net capital gain/loss: +$3,297 (reported on 10.7% of returns)
Here:
+$3,297
State:
+$10,430
(% of AGI for various income ranges: 0.4% for AGIs below $10k, -0.2% for AGIs $10k-25k, 0.1% for AGIs $25k-50k, -0.2% for AGIs $50k-75k, 5.6% for AGIs over 100k)
Profit/loss from business: +$4,426 (reported on 14.2% of returns)
Here:
+$4,426
State:
+$7,823
(% of AGI for various income ranges: -18.5% for AGIs below $10k, 10.8% for AGIs $10k-25k, 2.5% for AGIs $25k-50k, 0.3% for AGIs $50k-75k)
IRA payment deduction: $2,923 (reported on 2.5% of returns)
72952:
$2,923
Arkansas:
$3,204
Total itemized deductions: $15,713 (22% of AGI, reported on 20.1% of returns)
Here:
$15,713
State:
$18,389
Here:
21.9% of AGI
State:
21.0% of AGI
(% of AGI for various income ranges: 5.3% for AGIs $10k-25k, 6.1% for AGIs $25k-50k, 11.1% for AGIs $50k-75k, 12.7% for AGIs $75k-100k, 15.3% for AGIs over 100k)
Charity contributions deductions: $3,795 (5% of AGI, reported on 17.8% of returns)
Here:
$3,795
State:
$4,725
Here:
5.1% of AGI
State:
5.1% of AGI
(% of AGI for various income ranges: 0.9% for AGIs $10k-25k, 1.1% for AGIs $25k-50k, 2.5% for AGIs $50k-75k, 3.3% for AGIs $75k-100k, 3.3% for AGIs over 100k)
Total tax: $3,919 (reported on 70.7% of returns)
72952:
$3,919
State:
$6,047
(% of AGI for various income ranges: 4.3% for AGIs below $10k, 3.7% for AGIs $10k-25k, 5.6% for AGIs $25k-50k, 7.9% for AGIs $50k-75k, 10.2% for AGIs $75k-100k, 16.1% for AGIs over 100k)
Earned income credit: $1,886 (reported on 21.9% of returns)
Here:
$1,886
State:
$1,909
Percentage of individuals using paid preparers for their 2004 taxes: 70.5%
Here:
71%
State:
67%
(% for various income ranges: 59.0% for AGIs below $10k, 77.1% for AGIs $10k-25k, 75.7% for AGIs $25k-50k, 68.2% for AGIs $50k-75k, 65.1% for AGIs $75k-100k, 66.7% for AGIs over 100k)
Household received Food Stamps/SNAP in the past 12 months: 24 Household did not receive Food Stamps/SNAP in the past 12 months: 986
Women who had a birth in the past 12 months: 10 (10 now married, 0 unmarried) Women who did not have a birth in the past 12 months: 576 (421 now married, 158 unmarried)
Housing units in zip code 72952 with a mortgage: 450 Residents with income below the poverty level in 2022:
This zip code:
14.8%
Whole state:
16.8%
Residents with income below 50% of the poverty level in 2022:
This zip code:
11.8%
Whole state:
8.5%
Median number of rooms in houses and condos:
Here:
5.5
State:
6.1
Notable locations in this zip code not listed on our city pages
Notable locations in zip code 72952: Rural District 4 Station 88 (A), Bond Special Dean Springs and Rudy District 1 Rudy Fire Station (B). Display/hide their locations on the map
Churches in zip code 72952 include: Oliver Springs Church (A), Kenner Chapel (B), Eightyone Church (C), Pentecostal Church (D), Rudy Church (E). Display/hide their locations on the map
Cemeteries: Oliver Springs Cemetery (1), Oliver Cemetery (2), Mount McCurry Cemetery (3), Morrison Cemetery (4), Johnson Cemetery (5), Winfrey Cemetery (6). Display/hide their locations on the map
Size of family households: 202 2-persons, 188 3-persons, 129 4-persons, 16 5-persons, 9 6-persons, 1 7-or-more-persons
Size of nonfamily households: 441 1-person, 5 2-persons, 11 3-persons
302 married couples with children.
25 single-parent households (25 men).
99.5% of residents of 72952 zip code speak English at home.
Foreign born population: 180 (7.9%) (100.0% of them are naturalized citizens)
This zip code:
7.9%
Whole state:
5.1%
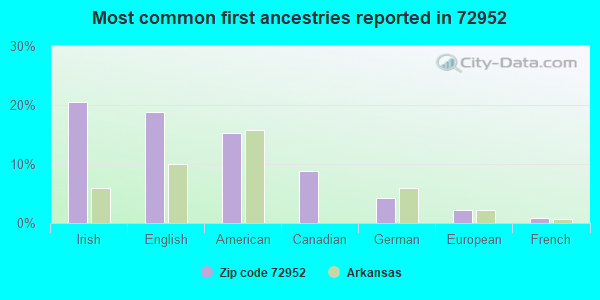
20%Irish
19%English
15%American
9%Canadian
4%German
2%European
1%French
Year of entry for the foreign-born population
02010 or later
1732000 to 2009
01990 to 1999
0Before 1990
Facilities with environmental interests located in this zip code:
BAY VIEW FINANCIAL PROPERTIES (10134 OLD 81 LOOP in RUDY, AR)
Conditionally Exempt Small Quantity Generators, less than 100 kg/month of hazardous waste (Resource Conservation and Recovery Act (tracking hazardous waste)) Organizations: CRAWFORD COUNTY SHERIFFS OFFICE (CONTACT/OWNER)
Housing units lacking complete plumbing facilities: 7.5% Housing units lacking complete kitchen facilities: 7.4%
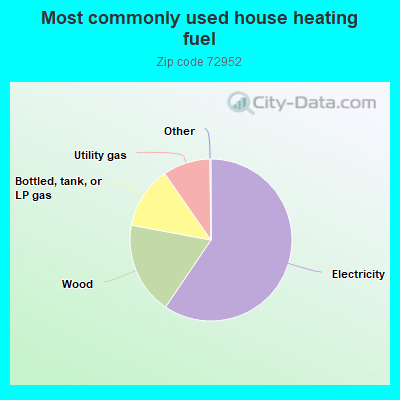
59.6%Electricity
18.5%Wood
12.4%Bottled, tank, or LP gas
9.5%Utility gas
Population in 1990: 1,753. Population change in the 1990s: +885 (+50.5%).
Place of birth for U.S.-born residents:
This state: 1,565
Northeast: 5
Midwest: 102
South: 268
West: 172
58% of the 72952 zip code residents lived in the same house 5 years ago. Out of people who lived in different houses, 64% lived in this county. Out of people who lived in different counties, 50% lived in Arkansas.
98% of the 72952 zip code residents lived in the same house 1 year ago. Out of people who lived in different houses, 3% moved from this county. Out of people who lived in different houses, 124% moved from different county within same state.
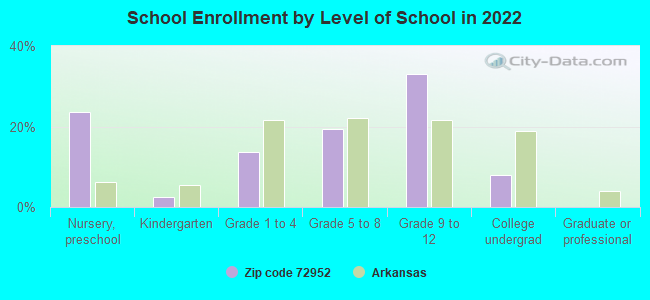
Private vs. public school enrollment:
Students in private schools in grades 1 to 8 (elementary and middle school): 42
Here:
33.0%
Arkansas:
10.5%
Students in private schools in grades 9 to 12 (high school):
Here:
0.0%
Arkansas:
8.7%
Students in private undergraduate colleges:
Here:
0.0%
Arkansas:
19.4%
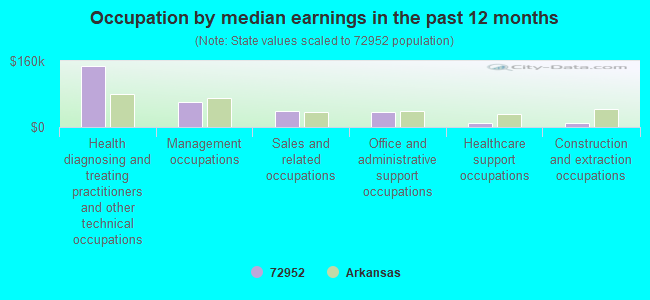
Occupation by median earnings in the past 12 months ($)
148,749Health diagnosing and treating practitioners and other technical occupations
60,930Management occupations
37,740Sales and related occupations
35,208Office and administrative support occupations
10,265Healthcare support occupations
9,414Construction and extraction occupations
Top industries in this zip code by the number of employees in 2005:
Construction: Other Foundation, Structure, and Building Exterior Contractors (5-9 employees: 1 establishment)
Construction: Plumbing, Heating, and Air-Conditioning Contractors (5-9: 1)
Construction: Residential Remodelers (1-4: 2)
Health Care and Social Assistance: Child Day Care Services (1-4: 1)
Professional, Scientific, and Technical Services: Other Computer Related Services (1-4: 1)
Professional, Scientific, and Technical Services: Commercial Photography (1-4: 1)
Fatal accident statistics in 2014:
Fatal accident count: 2
Vehicles involved in fatal accidents: 2
Fatal accidents caused by drunken drivers: 2
Fatalities: 2
Persons involved in fatal accidents: 3
Pedestrians involved in fatal accidents: 0
Fatal accident statistics in 2012:
Fatal accident count: 1
Vehicles involved in fatal accidents: 1
Fatal accidents caused by drunken drivers: 0
Fatalities: 1
Persons involved in fatal accidents: 2
Pedestrians involved in fatal accidents: 0
Home Mortgage Disclosure Act Aggregated Statistics For Year 2009 (Based on 4 partial tracts)
A) FHA, FSA/RHS & VA Home Purchase Loans
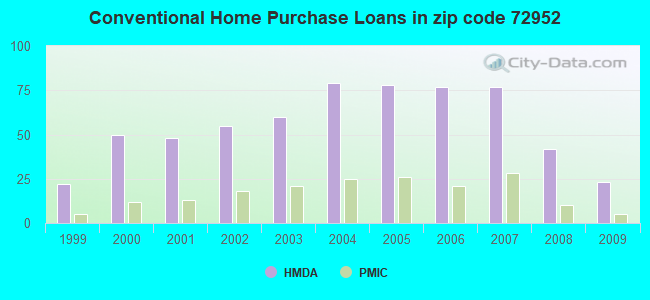
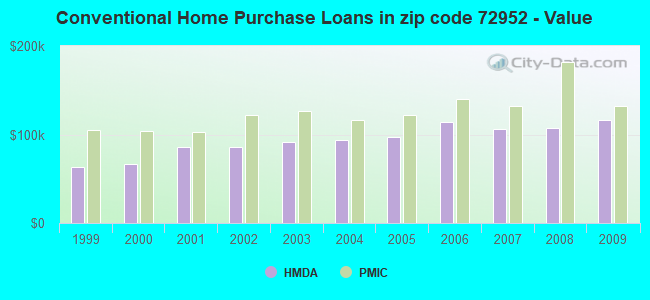
B) Conventional Home Purchase Loans
C) Refinancings
D) Home Improvement Loans
F) Non-occupant Loans on < 5 Family Dwellings (A B C & D)
G) Loans On Manufactured Home Dwelling (A B C & D)
Number
Average Value
Number
Average Value
Number
Average Value
Number
Average Value
Number
Average Value
Number
Average Value
LOANS ORIGINATED
45
$119,806
23
$116,190
111
$119,174
21
$35,949
13
$81,171
12
$36,681
APPLICATIONS APPROVED, NOT ACCEPTED
1
$129,490
1
$183,420
3
$139,900
1
$17,890
0
$0
0
$0
APPLICATIONS DENIED
5
$103,832
8
$67,972
30
$123,872
7
$13,837
1
$65,570
5
$53,228
APPLICATIONS WITHDRAWN
3
$112,077
2
$131,525
20
$133,001
1
$51,400
2
$95,975
1
$35,320
FILES CLOSED FOR INCOMPLETENESS
1
$135,000
0
$0
4
$108,755
0
$0
1
$91,560
0
$0
Aggregated Statistics For Year 2008 (Based on 4 partial tracts)
A) FHA, FSA/RHS & VA Home Purchase Loans
B) Conventional Home Purchase Loans
C) Refinancings
D) Home Improvement Loans
F) Non-occupant Loans on < 5 Family Dwellings (A B C & D)
G) Loans On Manufactured Home Dwelling (A B C & D)
Number
Average Value
Number
Average Value
Number
Average Value
Number
Average Value
Number
Average Value
Number
Average Value
LOANS ORIGINATED
36
$119,429
42
$107,759
75
$121,076
22
$30,516
19
$106,078
14
$42,047
APPLICATIONS APPROVED, NOT ACCEPTED
1
$69,740
3
$58,937
5
$135,610
1
$14,150
2
$71,680
1
$45,510
APPLICATIONS DENIED
4
$130,340
13
$65,025
27
$129,691
6
$30,875
3
$69,580
10
$36,996
APPLICATIONS WITHDRAWN
4
$125,050
6
$113,115
12
$141,250
2
$23,870
1
$113,130
0
$0
FILES CLOSED FOR INCOMPLETENESS
2
$102,050
0
$0
6
$130,682
0
$0
0
$0
0
$0
Aggregated Statistics For Year 2007 (Based on 4 partial tracts)
A) FHA, FSA/RHS & VA Home Purchase Loans
B) Conventional Home Purchase Loans
C) Refinancings
D) Home Improvement Loans
E) Loans on Dwellings For 5+ Families
F) Non-occupant Loans on < 5 Family Dwellings (A B C & D)
G) Loans On Manufactured Home Dwelling (A B C & D)
Number
Average Value
Number
Average Value
Number
Average Value
Number
Average Value
Number
Average Value
Number
Average Value
Number
Average Value
LOANS ORIGINATED
29
$115,220
77
$106,398
83
$101,572
26
$34,314
1
$2,212,810
21
$95,769
17
$33,026
APPLICATIONS APPROVED, NOT ACCEPTED
0
$0
7
$91,166
6
$109,292
3
$22,100
0
$0
3
$109,327
4
$59,258
APPLICATIONS DENIED
1
$88,940
22
$79,349
41
$102,561
11
$19,469
0
$0
3
$106,710
9
$51,461
APPLICATIONS WITHDRAWN
1
$140,250
5
$82,156
16
$112,064
4
$27,305
0
$0
1
$47,960
1
$31,200
FILES CLOSED FOR INCOMPLETENESS
0
$0
2
$104,540
3
$122,087
1
$35,640
0
$0
0
$0
0
$0
Aggregated Statistics For Year 2006 (Based on 4 partial tracts)
A) FHA, FSA/RHS & VA Home Purchase Loans
B) Conventional Home Purchase Loans
C) Refinancings
D) Home Improvement Loans
F) Non-occupant Loans on < 5 Family Dwellings (A B C & D)
G) Loans On Manufactured Home Dwelling (A B C & D)
Number
Average Value
Number
Average Value
Number
Average Value
Number
Average Value
Number
Average Value
Number
Average Value
LOANS ORIGINATED
24
$107,822
77
$114,382
77
$97,164
26
$39,090
19
$82,381
13
$48,707
APPLICATIONS APPROVED, NOT ACCEPTED
0
$0
9
$80,392
9
$107,546
2
$18,745
2
$65,725
5
$44,578
APPLICATIONS DENIED
3
$81,823
24
$76,057
39
$101,154
14
$21,474
3
$82,157
12
$47,652
APPLICATIONS WITHDRAWN
2
$101,445
9
$117,513
36
$114,101
5
$22,342
2
$106,035
1
$44,470
FILES CLOSED FOR INCOMPLETENESS
0
$0
3
$86,780
9
$114,600
0
$0
0
$0
0
$0
Aggregated Statistics For Year 2005 (Based on 4 partial tracts)
A) FHA, FSA/RHS & VA Home Purchase Loans
B) Conventional Home Purchase Loans
C) Refinancings
D) Home Improvement Loans
F) Non-occupant Loans on < 5 Family Dwellings (A B C & D)
G) Loans On Manufactured Home Dwelling (A B C & D)
Number
Average Value
Number
Average Value
Number
Average Value
Number
Average Value
Number
Average Value
Number
Average Value
LOANS ORIGINATED
24
$94,533
78
$97,289
94
$88,918
32
$33,704
17
$57,339
17
$43,634
APPLICATIONS APPROVED, NOT ACCEPTED
2
$59,065
8
$83,809
12
$92,401
2
$43,990
1
$69,410
5
$59,106
APPLICATIONS DENIED
2
$66,860
18
$77,046
46
$86,825
13
$34,258
2
$51,995
11
$51,580
APPLICATIONS WITHDRAWN
1
$102,340
10
$111,595
27
$104,547
4
$92,838
1
$83,200
1
$34,390
FILES CLOSED FOR INCOMPLETENESS
1
$115,810
3
$67,050
11
$106,845
0
$0
1
$67,880
0
$0
Aggregated Statistics For Year 2004 (Based on 4 partial tracts)
A) FHA, FSA/RHS & VA Home Purchase Loans
B) Conventional Home Purchase Loans
C) Refinancings
D) Home Improvement Loans
F) Non-occupant Loans on < 5 Family Dwellings (A B C & D)
G) Loans On Manufactured Home Dwelling (A B C & D)
Number
Average Value
Number
Average Value
Number
Average Value
Number
Average Value
Number
Average Value
Number
Average Value
LOANS ORIGINATED
30
$91,145
79
$93,664
97
$86,732
25
$33,087
18
$60,779
13
$39,738
APPLICATIONS APPROVED, NOT ACCEPTED
2
$68,865
7
$57,570
16
$94,762
1
$40,750
0
$0
6
$46,068
APPLICATIONS DENIED
6
$92,597
29
$67,993
56
$84,832
11
$18,951
3
$75,500
15
$45,413
APPLICATIONS WITHDRAWN
2
$71,340
7
$105,250
29
$92,450
3
$39,153
2
$75,535
1
$40,550
FILES CLOSED FOR INCOMPLETENESS
1
$95,810
1
$123,920
4
$91,962
0
$0
0
$0
0
$0
Aggregated Statistics For Year 2003 (Based on 4 partial tracts)
A) FHA, FSA/RHS & VA Home Purchase Loans
B) Conventional Home Purchase Loans
C) Refinancings
D) Home Improvement Loans
F) Non-occupant Loans on < 5 Family Dwellings (A B C & D)
Number
Average Value
Number
Average Value
Number
Average Value
Number
Average Value
Number
Average Value
LOANS ORIGINATED
30
$90,644
60
$91,748
164
$91,082
21
$25,392
23
$71,672
APPLICATIONS APPROVED, NOT ACCEPTED
1
$46,120
6
$76,498
18
$81,357
1
$46,110
0
$0
APPLICATIONS DENIED
5
$58,800
17
$48,572
66
$87,777
11
$15,385
1
$101,680
APPLICATIONS WITHDRAWN
3
$77,233
4
$56,875
36
$98,413
1
$17,510
1
$37,790
FILES CLOSED FOR INCOMPLETENESS
0
$0
1
$122,140
7
$84,724
1
$41,530
0
$0
Aggregated Statistics For Year 2002 (Based on 4 partial tracts)
A) FHA, FSA/RHS & VA Home Purchase Loans
B) Conventional Home Purchase Loans
C) Refinancings
D) Home Improvement Loans
F) Non-occupant Loans on < 5 Family Dwellings (A B C & D)
Number
Average Value
Number
Average Value
Number
Average Value
Number
Average Value
Number
Average Value
LOANS ORIGINATED
20
$83,641
55
$86,286
101
$80,933
23
$16,735
17
$67,032
APPLICATIONS APPROVED, NOT ACCEPTED
1
$74,780
7
$56,964
21
$83,061
5
$24,170
1
$18,970
APPLICATIONS DENIED
3
$59,987
21
$48,747
41
$76,336
12
$19,541
0
$0
APPLICATIONS WITHDRAWN
3
$78,770
4
$117,780
19
$77,034
1
$18,420
0
$0
FILES CLOSED FOR INCOMPLETENESS
0
$0
0
$0
9
$98,459
0
$0
0
$0
Aggregated Statistics For Year 2001 (Based on 4 partial tracts)
A) FHA, FSA/RHS & VA Home Purchase Loans
B) Conventional Home Purchase Loans
C) Refinancings
D) Home Improvement Loans
F) Non-occupant Loans on < 5 Family Dwellings (A B C & D)
Number
Average Value
Number
Average Value
Number
Average Value
Number
Average Value
Number
Average Value
LOANS ORIGINATED
27
$79,778
48
$85,568
94
$73,941
24
$16,635
14
$54,938
APPLICATIONS APPROVED, NOT ACCEPTED
1
$85,670
8
$61,185
13
$68,772
2
$48,560
1
$23,540
APPLICATIONS DENIED
3
$96,447
32
$47,588
54
$59,920
15
$19,719
3
$82,970
APPLICATIONS WITHDRAWN
1
$60,820
3
$84,297
27
$66,149
2
$16,590
1
$42,260
FILES CLOSED FOR INCOMPLETENESS
0
$0
0
$0
6
$74,545
0
$0
1
$41,200
Aggregated Statistics For Year 2000 (Based on 4 partial tracts)
A) FHA, FSA/RHS & VA Home Purchase Loans
B) Conventional Home Purchase Loans
C) Refinancings
D) Home Improvement Loans
F) Non-occupant Loans on < 5 Family Dwellings (A B C & D)
Number
Average Value
Number
Average Value
Number
Average Value
Number
Average Value
Number
Average Value
LOANS ORIGINATED
19
$73,913
50
$66,860
37
$66,045
15
$15,563
10
$70,029
APPLICATIONS APPROVED, NOT ACCEPTED
1
$83,110
13
$50,768
5
$81,130
4
$28,558
0
$0
APPLICATIONS DENIED
4
$66,798
33
$40,592
53
$58,448
15
$12,383
3
$41,560
APPLICATIONS WITHDRAWN
3
$79,117
6
$76,403
22
$57,340
4
$27,142
0
$0
FILES CLOSED FOR INCOMPLETENESS
1
$64,420
1
$79,130
2
$181,915
0
$0
0
$0
Aggregated Statistics For Year 1999 (Based on 2 partial tracts)
A) FHA, FSA/RHS & VA Home Purchase Loans
B) Conventional Home Purchase Loans
C) Refinancings
D) Home Improvement Loans
F) Non-occupant Loans on < 5 Family Dwellings (A B C & D)
Detailed PMIC statistics for the following Tracts:0202.01
, 0202.02
2002 - 2018 National Fire Incident Reporting System (NFIRS) incidents
Based on the data from the years 2002 - 2018 the average number of fire incidents per year is 18. The highest number of fire incidents - 29 took place in 2011, and the least - 9 in 2002. The data has a growing trend.
When looking into fire subcategories, the most incidents belonged to: Outside Fires (51.3%), and Structure Fires (34.2%).
Fire incident types reported to NFIRS in Zip Code 72952

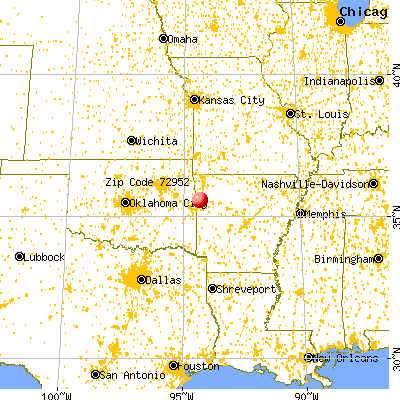


 Nearest zip codes: 72932, 72956, 72934, 72921, 72955, 72948.


 Based on the data from the years 2002 - 2018 the average number of fire incidents per year is 18. The highest number of fire incidents - 29 took place in 2011, and the least - 9 in 2002. The data has a growing trend.
 When looking into fire subcategories, the most incidents belonged to: Outside Fires (51.3%), and Structure Fires (34.2%).