Estimated zip code population in 2022: 2,639 Zip code population in 2010: 1,850 Zip code population in 2000: 1,367
Houses and condos: 851 Renter-occupied apartments: 100
% of renters here:
13%
State:
35%
March 2022 cost of living index in zip code 73016: 81.2 (low, U.S. average is 100)
Land area: 63.6 sq. mi. Water area: 0.7 sq. mi.
Population density: 42 people per square mile
(very low).
OSM Map
General Map
Google Map
MSN Map
OSM Map
General Map
Google Map
MSN Map
OSM Map
General Map
Google Map
MSN Map
OSM Map
General Map
Google Map
MSN Map
Please wait while loading the map...
Real estate property taxes paid for housing units in 2022:
This zip code:
0.6% ($1,634)
Oklahoma:
0.8% ($1,501)
Median real estate property taxes paid for housing units with mortgages in 2022: $1,956 (0.6%) Median real estate property taxes paid for housing units with no mortgage in 2022: $1,322 (0.7%)
Business Search- 14 Million verified businesses
Males: 1,207
(45.7%)
Females: 1,432
(54.3%)
For population 25 years and over in 73016:
High school or higher: 97.7%
Bachelor's degree or higher: 39.6%
Graduate or professional degree: 12.0%
Unemployed: 1.9%
Mean travel time to work (commute): 34.8 minutes
For population 15 years and over in 73016:
Never married: 21.3%
Now married: 65.1%
Separated: 0.6%
Widowed: 3.5%
Divorced: 9.5%
Zip code 73016 compared to state average:
Median household income above state average.
Unemployed percentage below state average.
Black race population percentage significantly below state average.
Foreign-born population percentage below state average.
Renting percentage significantly below state average.
Estimated median house/condo value in 2022: $274,789
73016:
$274,789
Oklahoma:
$191,700
According to our research of Oklahoma and other state lists, there were 4 registered sex offenders living in 73016 zip code as of May 28, 2024. The ratio of all residents to sex offenders in zip code 73016 is 444 to 1. The ratio of registered sex offenders to all residents in this zip code is near the state average.
Median resident age:
This zip code:
34.1 years
Oklahoma median age:
37.1 years
Average household size:
This zip code:
3.3 people
Oklahoma:
2.5 people
Averages for the 2020 tax year for zip code 73016, filed in 2021:
Average Adjusted Gross Income (AGI) in 2020: $77,363 (Individual Income Tax Returns)
Here:
$77,363
State:
$63,060
Salary/wage: $70,734 (reported on 81.3% of returns)
Here:
$70,734
State:
$52,427
(% of AGI for various income ranges: 1092.4% for AGIs below $25k, 3493.3% for AGIs $25k-50k, 6473.8% for AGIs $50k-75k, 10965.0% for AGIs $75k-100k, 15778.5% for AGIs $100k-200k)
Taxable interest for individuals: $613 (reported on 33.0% of returns)
This zip code:
$613
Oklahoma:
$1,603
(% of AGI for various income ranges: 8.2% for AGIs below $25k, 22.0% for AGIs $25k-50k, 13.8% for AGIs $50k-75k, 28.7% for AGIs $75k-100k, 51.5% for AGIs $100k-200k)
Ordinary dividends: $2,407 (reported on 15.4% of returns)
Here:
$2,407
State:
$7,001
(% of AGI for various income ranges: 32.7% for AGIs $25k-50k, 61.3% for AGIs $75k-100k, 183.8% for AGIs $100k-200k)
Net capital gain/loss in AGI: +$9,153 (reported on 16.5% of returns)
Here:
+$9,153
State:
+$19,855
(% of AGI for various income ranges: 28.2% for AGIs below $25k, 128.8% for AGIs $50k-75k, 111.2% for AGIs $75k-100k, 437.7% for AGIs $100k-200k)
Profit/loss from business: +$10,362 (reported on 23.1% of returns)
Here:
+$10,362
State:
+$9,904
(% of AGI for various income ranges: 237.1% for AGIs below $25k, 311.3% for AGIs $25k-50k, 192.5% for AGIs $50k-75k, 361.2% for AGIs $75k-100k, 663.8% for AGIs $100k-200k)
Taxable individual retirement arrangement distribution: $21,229 (reported on 7.7% of returns)
73016:
$21,229
Oklahoma:
$20,476
(% of AGI for various income ranges: 123.5% for AGIs below $25k, 710.0% for AGIs $50k-75k, 544.6% for AGIs $100k-200k)
Total itemized deductions: $44,650 (reported on 6.6% of returns)
Here:
$44,650
State:
$39,736
(% of AGI for various income ranges: 356.0% for AGIs $25k-50k, 1650.0% for AGIs $100k-200k)
Charity contributions: $11,620 (reported on 5.5% of returns)
Here:
$11,620
State:
$17,288
(% of AGI for various income ranges: 446.9% for AGIs $100k-200k)
Taxes paid: $8,200 (reported on 6.6% of returns)
73016:
$8,200
State:
$7,046
(% of AGI for various income ranges: 59.4% for AGIs below $25k, 300.8% for AGIs $100k-200k)
Earned income credit: $2,167 (reported on 13.2% of returns)
Here:
$2,167
State:
$2,435
(% of AGI for various income ranges: 85.3% for AGIs below $25k, 76.7% for AGIs $25k-50k)
Percentage of individuals using paid preparers for their 2020 taxes: 92.3%
Here:
92%
State:
94%
(% for various income ranges: 91.7% for AGIs below $25k, 90.0% for AGIs $25k-50k, 90.9% for AGIs $50k-75k, 91.7% for AGIs $75k-100k, 94.7% for AGIs $100k-200k, 100.0% for AGIs over 200k)
Averages for the 2012 tax year for zip code 73016, filed in 2013:
Average Adjusted Gross Income (AGI) in 2012: $62,088 (Individual Income Tax Returns)
Here:
$62,088
State:
$58,581
Salary/wage: $52,869 (reported on 86.7% of returns)
Here:
$52,869
State:
$45,973
(% of AGI for various income ranges: 81.3% for AGIs below $25k, 77.2% for AGIs $25k-50k, 79.4% for AGIs $50k-75k, 84.8% for AGIs $75k-100k, 78.0% for AGIs $100k-200k, 54.5% for AGIs over 200k)
Taxable interest for individuals: $460 (reported on 33.3% of returns)
This zip code:
$460
Oklahoma:
$1,625
(% of AGI for various income ranges: 0.6% for AGIs below $25k, 0.2% for AGIs $25k-50k, 0.2% for AGIs $50k-75k, 0.2% for AGIs $75k-100k, 0.2% for AGIs $100k-200k, 0.3% for AGIs over 200k)
Ordinary dividends: $1,529 (reported on 11.7% of returns)
Here:
$1,529
State:
$6,374
(% of AGI for various income ranges: 0.3% for AGIs below $25k, 0.3% for AGIs $50k-75k, 0.8% for AGIs $100k-200k)
Net capital gain/loss in AGI: +$17,112 (reported on 13.3% of returns)
Here:
+$17,112
State:
+$24,023
(% of AGI for various income ranges: 0.8% for AGIs below $25k, 1.7% for AGIs $50k-75k, 12.6% for AGIs $100k-200k)
Profit/loss from business: +$6,645 (reported on 18.3% of returns)
Here:
+$6,645
State:
+$11,913
(% of AGI for various income ranges: 5.5% for AGIs below $25k, 6.9% for AGIs $25k-50k, 2.8% for AGIs $50k-75k, 0.7% for AGIs $100k-200k)
Taxable individual retirement arrangement distribution: $7,600 (reported on 6.7% of returns)
73016:
$7,600
Oklahoma:
$15,242
Total itemized deductions: $20,911 (18% of AGI, reported on 30.0% of returns)
Here:
$20,911
State:
$24,882
Here:
17.7% of AGI
State:
18.8% of AGI
(% of AGI for various income ranges: 12.2% for AGIs $25k-50k, 11.9% for AGIs $50k-75k, 11.2% for AGIs $75k-100k, 11.7% for AGIs $100k-200k, 8.5% for AGIs over 200k)
Charity contributions: $4,443 (reported on 23.3% of returns)
Here:
$4,443
State:
$6,591
(% of AGI for various income ranges: 2.1% for AGIs below $25k, 1.8% for AGIs $50k-75k, 1.8% for AGIs $75k-100k, 3.7% for AGIs $100k-200k)
Taxes paid: $6,306 (reported on 30.0% of returns)
73016:
$6,306
State:
$7,196
(% of AGI for various income ranges: 2.0% for AGIs $25k-50k, 2.5% for AGIs $50k-75k, 2.7% for AGIs $75k-100k, 3.9% for AGIs $100k-200k, 4.2% for AGIs over 200k)
Earned income credit: $2,520 (reported on 16.7% of returns)
Here:
$2,520
State:
$2,354
(% of AGI for various income ranges: 5.9% for AGIs below $25k, 1.6% for AGIs $25k-50k)
Percentage of individuals using paid preparers for their 2012 taxes: 61.7%
Here:
62%
State:
56%
(% for various income ranges: 57.1% for AGIs below $25k, 57.1% for AGIs $25k-50k, 66.7% for AGIs $50k-75k, 66.7% for AGIs $75k-100k, 62.5% for AGIs $100k-200k, 100.0% for AGIs over 200k)
Averages for the 2004 tax year for zip code 73016, filed in 2005:
Average Adjusted Gross Income (AGI) in 2004: $41,534 (Individual Income Tax Returns)
Here:
$41,534
State:
$41,245
Salary/wage: $39,031 (reported on 82.3% of returns)
Here:
$39,031
State:
$35,318
(% of AGI for various income ranges: 91.0% for AGIs below $10k, 78.3% for AGIs $10k-25k, 84.4% for AGIs $25k-50k, 88.8% for AGIs $50k-75k, 78.2% for AGIs $75k-100k, 59.0% for AGIs over 100k)
Taxable interest for individuals: $1,350 (reported on 43.2% of returns)
This zip code:
$1,350
Oklahoma:
$1,745
(% of AGI for various income ranges: 6.8% for AGIs below $10k, 2.1% for AGIs $10k-25k, 0.8% for AGIs $25k-50k, 0.6% for AGIs $50k-75k, 2.2% for AGIs $75k-100k, 1.5% for AGIs over 100k)
Taxable dividends: $757 (reported on 16.4% of returns)
Here:
$757
State:
$2,920
(% of AGI for various income ranges: 0.3% for AGIs $10k-25k, 0.4% for AGIs $25k-50k, 0.3% for AGIs $50k-75k, 0.2% for AGIs $75k-100k, 0.3% for AGIs over 100k)
Net capital gain/loss: +$6,946 (reported on 18.5% of returns)
Here:
+$6,946
State:
+$10,653
(% of AGI for various income ranges: 0.4% for AGIs below $10k, -0.2% for AGIs $10k-25k, 0.8% for AGIs $25k-50k, 0.2% for AGIs $50k-75k, 3.5% for AGIs $75k-100k, 9.0% for AGIs over 100k)
Profit/loss from business: +$7,057 (reported on 22.5% of returns)
Here:
+$7,057
State:
+$8,532
(% of AGI for various income ranges: 31.1% for AGIs below $10k, 8.5% for AGIs $10k-25k, 9.3% for AGIs $25k-50k, 1.4% for AGIs $50k-75k, 0.8% for AGIs $75k-100k, -0.1% for AGIs over 100k)
IRA payment deduction: $2,600 (reported on 1.4% of returns)
73016:
$2,600
Oklahoma:
$3,127
Total itemized deductions: $17,560 (24% of AGI, reported on 35.7% of returns)
Here:
$17,560
State:
$17,093
Here:
23.9% of AGI
State:
20.5% of AGI
(% of AGI for various income ranges: 12.5% for AGIs $10k-25k, 13.3% for AGIs $25k-50k, 16.3% for AGIs $50k-75k, 17.4% for AGIs $75k-100k, 15.8% for AGIs over 100k)
Charity contributions deductions: $3,819 (5% of AGI, reported on 30.0% of returns)
Here:
$3,819
State:
$4,240
Here:
4.9% of AGI
State:
4.8% of AGI
(% of AGI for various income ranges: 0.5% for AGIs $10k-25k, 1.5% for AGIs $25k-50k, 2.6% for AGIs $50k-75k, 2.8% for AGIs $75k-100k, 5.0% for AGIs over 100k)
Total tax: $4,504 (reported on 75.9% of returns)
73016:
$4,504
State:
$6,542
(% of AGI for various income ranges: 6.1% for AGIs below $10k, 4.6% for AGIs $10k-25k, 6.1% for AGIs $25k-50k, 7.5% for AGIs $50k-75k, 10.1% for AGIs $75k-100k, 10.9% for AGIs over 100k)
Earned income credit: $1,677 (reported on 18.1% of returns)
Here:
$1,677
State:
$1,830
Percentage of individuals using paid preparers for their 2004 taxes: 71.5%
Here:
71%
State:
63%
(% for various income ranges: 65.0% for AGIs below $10k, 75.9% for AGIs $10k-25k, 71.0% for AGIs $25k-50k, 65.4% for AGIs $50k-75k, 77.4% for AGIs $75k-100k, 83.3% for AGIs over 100k)
Likely homosexual households (counted as self-reported same-sex unmarried-partner households)
Lesbian couples: 0.0% of all households
Gay men: 0.3% of all households
Household received Food Stamps/SNAP in the past 12 months: 26 Household did not receive Food Stamps/SNAP in the past 12 months: 762
Women who had a birth in the past 12 months: 66 (68 now married, 0 unmarried) Women who did not have a birth in the past 12 months: 494 (259 now married, 235 unmarried)
Housing units in zip code 73016 with a mortgage: 459 (42 second mortgage, 42 both second mortgage and home equity loan) Median monthly owner costs for units with a mortgage: $1,697 Median monthly owner costs for units without a mortgage: $571
Residents with income below the poverty level in 2022:
This zip code:
2.8%
Whole state:
15.7%
Residents with income below 50% of the poverty level in 2022:
This zip code:
1.2%
Whole state:
8.3%
Median number of rooms in houses and condos:
Here:
6.3
State:
6.1
Median number of rooms in apartments:
Here:
6.1
State:
4.5
Notable locations in this zip code not listed on our city pages
Reservoirs: Cottonwood Creek Site 11 Reservoir (A), Oknoname 07305 Reservoir (B), Oknoname 18 Reservoir (C), Cottonwood Creek Site 20 Reservoir (D), Cottonwood Creek Site 19 Reservoir (E), Cottonwood Creek Site 18 Reservoir (F), Cottonwood Creek Site 15 Reservoir (G), Cottonwood Creek Site 12 Reservoir (H). Display/hide their locations on the map
Size of family households: 225 2-persons, 135 3-persons, 146 4-persons, 96 5-persons, 24 6-persons, 28 7-or-more-persons
Size of nonfamily households: 94 1-person, 49 2-persons
555 married couples with children.
58 single-parent households (22 men, 36 women).
94.3% of residents of 73016 zip code speak English at home.
4.2% of residents speak Spanish at home (16% very well, 53% well, 27% not well, 4% not at all).
0.3% of residents speak other Indo-European language at home (100% very well).
1.3% of residents speak other language at home (100% very well).
Foreign born population: 88 (3.3%) (12.4% of them are naturalized citizens)
This zip code:
3.3%
Whole state:
6.0%
85%Guatemala
18%Honduras
23%German
23%English
15%American
11%European
8%Irish
5%French
2%Scottish
Year of entry for the foreign-born population
822010 or later
42000 to 2009
41990 to 1999
13Before 1990
Facilities with environmental interests located in this zip code:
CASHION ES (THIRD AND GUTHRIE in CASHION, OK)
(National Center for Education Statistics) - STATE ID-37-I089-105
CASHION HS (3RD & GUTHRIE in CASHION, OK)
(National Center for Education Statistics) - STATE ID-37-I089-705
DUKE ENERGY SERVICES-CASHION (3 MI. WEST OF CASHION in CASHION, OK)
National Pollutant Discharge Elimination System NON-MAJOR (Tracking pollutant discharge elimination systems) - permit Business SIC classification: SANITARY SERVICES Alternative names: DUKE ENERGY FIELD SERVICES -
CASHION SCHOOLS (3RD & GUTHRIE in CASHION, OK)
COMPLIANCE ACTIVITY (Tracking inspections of insecticide, fungicide, and rodenticide, and toxic substances) Alternative names: CASHION PUBLIC SCHOOLS
DUKE ENERGY FIELD S/SOUTH CASHION COMPRE (4 MI W OF HWY 74/74F in CASHION, OK)
AIR SYNTHETIC MINOR (AIRS/AFS) CRITERIA AND HAZARDOUS AIR POLLUTANT INVENTORY (Inventory of air pollution sources) Business SIC classification: NATURAL GAS TRANSMISSION Business NAICS classification: PIPELINE TRANSPORTATION OF NATURAL GAS. Alternative names: CONOCO INC./SOUTH CASHION
CONOCO INC. (WEST OF CITY, CASHION, OK 73016 in CASHION, OK)
CRITERIA AND HAZARDOUS AIR POLLUTANT INVENTORY (Inventory of air pollution sources) Business SIC classification: CRUDE PETROLEUM AND NATURAL GAS; NATURAL GAS TRANSMISSION Business NAICS classification: PIPELINE TRANSPORTATION OF NATURAL GAS.
DCP MIDSTREAM LP/WASWO (2 MI NE in CASHION, OK)
AIR SYNTHETIC MINOR (AIRS/AFS) Business SIC classification: NATURAL GAS TRANSMISSION Alternative names: DUKE ENERGY FIELD S/WASWO
Housing units lacking complete kitchen facilities: 0.7%
43.3%Electricity
37.4%Utility gas
17.3%Bottled, tank, or LP gas
1.8%Wood
Population in 1990: 408. Population change in the 1990s: +959 (+235.0%).
Place of birth for U.S.-born residents:
This state: 1,842
Northeast: 11
Midwest: 240
South: 247
West: 195
60% of the 73016 zip code residents lived in the same house 5 years ago. Out of people who lived in different houses, 31% lived in this county. Out of people who lived in different counties, 50% lived in Oklahoma.
92% of the 73016 zip code residents lived in the same house 1 year ago. Out of people who lived in different houses, 2% moved from this county. Out of people who lived in different houses, 60% moved from different county within same state. Out of people who lived in different houses, 44% moved from different state. Out of people who lived in different houses, 8% moved from abroad.
Private vs. public school enrollment:
Students in private schools in grades 1 to 8 (elementary and middle school): 12
Here:
3.6%
Oklahoma:
11.7%
Students in private schools in grades 9 to 12 (high school): 14
Here:
8.8%
Oklahoma:
11.7%
Students in private undergraduate colleges: 65
Here:
32.8%
Oklahoma:
19.3%
Occupation by median earnings in the past 12 months ($)
107,556Life, physical, and social science occupations
67,284Management occupations
65,910Production occupations
59,758Health diagnosing and treating practitioners and other technical occupations
57,368Business and financial operations occupations
54,859Transportation occupations
Companies with federal contracts located in this zip code:
MARK A MORRIS (RT 1 BOX 108A in CASHION, OK; small business) : $4,596,411 in 150 contractsfrom 2002 to 2006
Contracts for Airframe Structural Components, Miscellaneous Aircraft Accessories and Components, Packing and Gasket Materials, Switches, and moreby Defense Logistics Agency, Air Force Signed by year:2000: $0; 2001: $0; 2002: $589,845; 2003: $728,436; 2004: $450,985; 2005: $1,075,949; 2006: $1,751,196.
Biggest contracts:
$97,715 with Defense Logistics Agency for Airframe Structural Components. Signed on 2004-08-09. Completion date: 2005-08-10.
$97,650 with Air Force for Airframe Structural Components. Signed on 2002-07-12. Completion date: 2002-08-23.
$97,320, same as above.Signed on 2004-10-27. Completion date: 2004-11-29.
$96,000, same as above.Signed on 2003-08-18. Completion date: 2003-09-18.
Top industries in this zip code by the number of employees in 2005:
Real Estate and Rental and Leasing: Construction, Mining, and Forestry Machinery and Equipment Rental and Leasing (20-49 employees: 1 establishment)
Mining: Natural Gas Liquid Extraction (20-49: 1)
Construction: New Single-Family Housing Construction (except Operative Builders) (10-19: 1)
Finance and Insurance: Commercial Banking (10-19: 1)
Accommodation and Food Services: Full-Service Restaurants (10-19: 1)
Construction: Commercial and Institutional Building Construction (5-9: 2)
Administrative and Support and Waste Management and Remediation Services: Other Services to Buildings and Dwellings (5-9: 1)
Mining: Drilling Oil and Gas Wells (5-9: 1)
Fatal accident statistics in 2012:
Fatal accident count: 1
Vehicles involved in fatal accidents: 1
Fatal accidents caused by drunken drivers: 0
Fatalities: 1
Persons involved in fatal accidents: 1
Pedestrians involved in fatal accidents: 0
Fatal accident statistics in 2010:
Fatal accident count: 1
Vehicles involved in fatal accidents: 1
Fatal accidents caused by drunken drivers: 0
Fatalities: 1
Persons involved in fatal accidents: 1
Pedestrians involved in fatal accidents: 0
Home Mortgage Disclosure Act Aggregated Statistics For Year 2009 (Based on 2 partial tracts)
A) FHA, FSA/RHS & VA Home Purchase Loans
B) Conventional Home Purchase Loans
C) Refinancings
D) Home Improvement Loans
F) Non-occupant Loans on < 5 Family Dwellings (A B C & D)
G) Loans On Manufactured Home Dwelling (A B C & D)
Number
Average Value
Number
Average Value
Number
Average Value
Number
Average Value
Number
Average Value
Number
Average Value
LOANS ORIGINATED
15
$160,241
21
$191,488
84
$201,459
11
$66,649
8
$110,245
5
$57,670
APPLICATIONS APPROVED, NOT ACCEPTED
1
$214,780
1
$152,630
6
$156,788
3
$25,510
0
$0
3
$45,943
APPLICATIONS DENIED
3
$159,397
1
$185,610
23
$163,568
4
$42,492
1
$21,140
2
$71,240
APPLICATIONS WITHDRAWN
0
$0
1
$188,150
20
$170,854
1
$25,370
0
$0
1
$120,500
FILES CLOSED FOR INCOMPLETENESS
0
$0
0
$0
6
$195,615
0
$0
1
$88,790
0
$0
Aggregated Statistics For Year 2008 (Based on 2 partial tracts)
A) FHA, FSA/RHS & VA Home Purchase Loans
B) Conventional Home Purchase Loans
C) Refinancings
D) Home Improvement Loans
F) Non-occupant Loans on < 5 Family Dwellings (A B C & D)
G) Loans On Manufactured Home Dwelling (A B C & D)
Number
Average Value
Number
Average Value
Number
Average Value
Number
Average Value
Number
Average Value
Number
Average Value
LOANS ORIGINATED
13
$171,234
38
$182,071
33
$171,567
13
$35,158
8
$90,321
5
$59,276
APPLICATIONS APPROVED, NOT ACCEPTED
0
$0
4
$120,920
2
$99,145
1
$73,990
0
$0
2
$66,800
APPLICATIONS DENIED
3
$158,833
4
$118,068
29
$158,113
7
$77,191
3
$87,237
5
$75,174
APPLICATIONS WITHDRAWN
2
$221,970
3
$200,407
12
$156,225
1
$59,190
0
$0
0
$0
FILES CLOSED FOR INCOMPLETENESS
0
$0
0
$0
1
$65,530
0
$0
0
$0
0
$0
Aggregated Statistics For Year 2007 (Based on 2 partial tracts)
A) FHA, FSA/RHS & VA Home Purchase Loans
B) Conventional Home Purchase Loans
C) Refinancings
D) Home Improvement Loans
F) Non-occupant Loans on < 5 Family Dwellings (A B C & D)
G) Loans On Manufactured Home Dwelling (A B C & D)
Number
Average Value
Number
Average Value
Number
Average Value
Number
Average Value
Number
Average Value
Number
Average Value
LOANS ORIGINATED
5
$112,804
46
$174,451
33
$187,877
12
$24,875
6
$353,038
5
$351,432
APPLICATIONS APPROVED, NOT ACCEPTED
0
$0
4
$163,940
6
$204,212
1
$24,100
0
$0
1
$68,920
APPLICATIONS DENIED
1
$77,800
7
$107,210
22
$150,594
6
$71,312
2
$41,225
6
$59,192
APPLICATIONS WITHDRAWN
0
$0
3
$193,080
9
$168,650
0
$0
1
$99,360
0
$0
FILES CLOSED FOR INCOMPLETENESS
0
$0
1
$145,020
5
$158,804
0
$0
0
$0
0
$0
Aggregated Statistics For Year 2006 (Based on 2 partial tracts)
A) FHA, FSA/RHS & VA Home Purchase Loans
B) Conventional Home Purchase Loans
C) Refinancings
D) Home Improvement Loans
F) Non-occupant Loans on < 5 Family Dwellings (A B C & D)
G) Loans On Manufactured Home Dwelling (A B C & D)
Number
Average Value
Number
Average Value
Number
Average Value
Number
Average Value
Number
Average Value
Number
Average Value
LOANS ORIGINATED
11
$169,505
64
$155,478
43
$127,440
15
$35,571
6
$108,800
8
$59,615
APPLICATIONS APPROVED, NOT ACCEPTED
1
$158,970
11
$109,236
8
$144,122
1
$39,740
0
$0
4
$41,962
APPLICATIONS DENIED
0
$0
12
$98,478
27
$113,138
8
$38,845
0
$0
5
$46,508
APPLICATIONS WITHDRAWN
1
$137,410
4
$83,398
18
$140,346
1
$95,550
0
$0
0
$0
FILES CLOSED FOR INCOMPLETENESS
0
$0
5
$101,218
3
$143,470
0
$0
1
$95,550
0
$0
Aggregated Statistics For Year 2005 (Based on 2 partial tracts)
A) FHA, FSA/RHS & VA Home Purchase Loans
B) Conventional Home Purchase Loans
C) Refinancings
D) Home Improvement Loans
F) Non-occupant Loans on < 5 Family Dwellings (A B C & D)
G) Loans On Manufactured Home Dwelling (A B C & D)
Number
Average Value
Number
Average Value
Number
Average Value
Number
Average Value
Number
Average Value
Number
Average Value
LOANS ORIGINATED
5
$107,476
59
$147,392
52
$132,979
12
$29,526
11
$65,342
4
$72,088
APPLICATIONS APPROVED, NOT ACCEPTED
0
$0
7
$120,981
4
$141,955
3
$37,487
0
$0
3
$55,527
APPLICATIONS DENIED
1
$53,270
11
$113,695
24
$112,412
6
$35,445
1
$31,290
8
$88,312
APPLICATIONS WITHDRAWN
1
$246,490
3
$149,813
23
$118,825
2
$160,875
0
$0
1
$63,420
FILES CLOSED FOR INCOMPLETENESS
0
$0
2
$160,030
3
$160,947
0
$0
0
$0
0
$0
Aggregated Statistics For Year 2004 (Based on 2 partial tracts)
A) FHA, FSA/RHS & VA Home Purchase Loans
B) Conventional Home Purchase Loans
C) Refinancings
D) Home Improvement Loans
F) Non-occupant Loans on < 5 Family Dwellings (A B C & D)
G) Loans On Manufactured Home Dwelling (A B C & D)
Number
Average Value
Number
Average Value
Number
Average Value
Number
Average Value
Number
Average Value
Number
Average Value
LOANS ORIGINATED
5
$101,050
53
$135,376
67
$148,573
11
$34,093
6
$76,033
6
$67,225
APPLICATIONS APPROVED, NOT ACCEPTED
1
$100,200
5
$138,086
10
$128,700
2
$31,920
0
$0
3
$58,347
APPLICATIONS DENIED
0
$0
10
$79,740
25
$103,366
13
$33,726
0
$0
8
$54,330
APPLICATIONS WITHDRAWN
0
$0
4
$132,338
17
$118,658
2
$14,165
0
$0
1
$62,150
FILES CLOSED FOR INCOMPLETENESS
0
$0
1
$50,310
4
$116,058
0
$0
0
$0
0
$0
Aggregated Statistics For Year 2003 (Based on 2 partial tracts)
A) FHA, FSA/RHS & VA Home Purchase Loans
B) Conventional Home Purchase Loans
C) Refinancings
D) Home Improvement Loans
F) Non-occupant Loans on < 5 Family Dwellings (A B C & D)
Detailed PMIC statistics for the following Tracts:6008.00
2004 - 2018 National Fire Incident Reporting System (NFIRS) incidents
According to the data from the years 2004 - 2018 the average number of fire incidents per year is 30. The highest number of fires - 98 took place in 2008, and the least - 3 in 2004. The data has an increasing trend.
When looking into fire subcategories, the most incidents belonged to: Outside Fires (79.9%), and Structure Fires (14.5%).
Fire incident types reported to NFIRS in Zip Code 73016

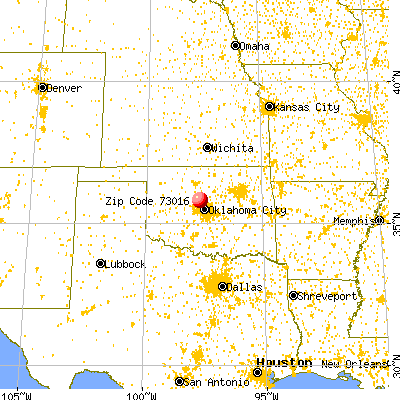


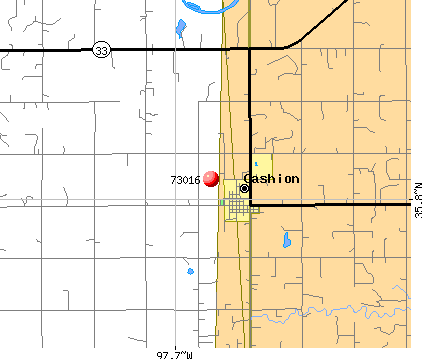 Nearest zip codes: 73025, 73078, 73012, 73028, 73142, 73134.


 According to the data from the years 2004 - 2018 the average number of fire incidents per year is 30. The highest number of fires - 98 took place in 2008, and the least - 3 in 2004. The data has an increasing trend.
 When looking into fire subcategories, the most incidents belonged to: Outside Fires (79.9%), and Structure Fires (14.5%).