Estimated zip code population in 2022: 3,740 Zip code population in 2010: 3,454 Zip code population in 2000: 3,199
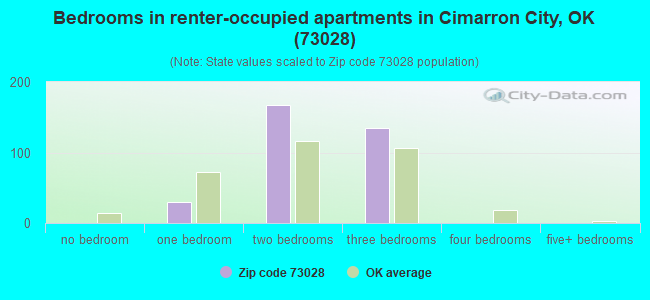
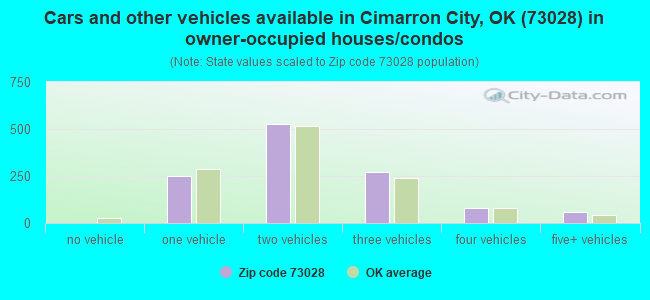
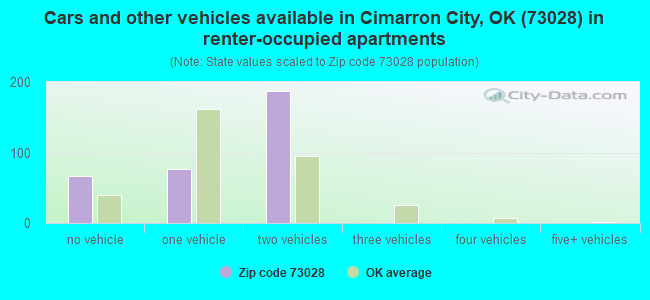
Houses and condos: 1,683 Renter-occupied apartments: 333
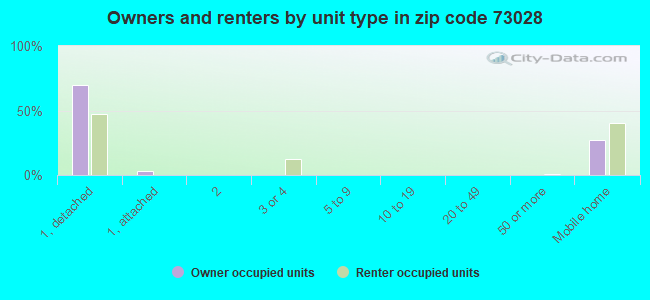
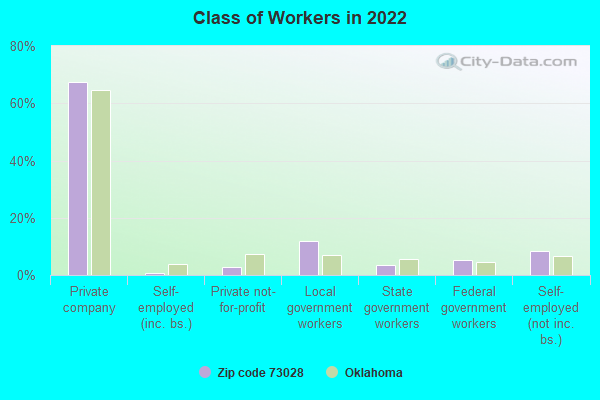
% of renters here:
22%
State:
35%
March 2022 cost of living index in zip code 73028: 79.8 (low, U.S. average is 100)
Land area: 145.1 sq. mi. Water area: 0.9 sq. mi.
Population density: 26 people per square mile
(very low).
OSM Map
General Map
Google Map
MSN Map
OSM Map
General Map
Google Map
MSN Map
OSM Map
General Map
Google Map
MSN Map
OSM Map
General Map
Google Map
MSN Map
Please wait while loading the map...
Real estate property taxes paid for housing units in 2022:
This zip code:
0.6% ($985)
Oklahoma:
0.8% ($1,501)
Median real estate property taxes paid for housing units with mortgages in 2022: $821 (0.5%) Median real estate property taxes paid for housing units with no mortgage in 2022: $1,053 (0.8%)
Business Search- 14 Million verified businesses
Males: 1,788
(47.8%)
Females: 1,952
(52.2%)
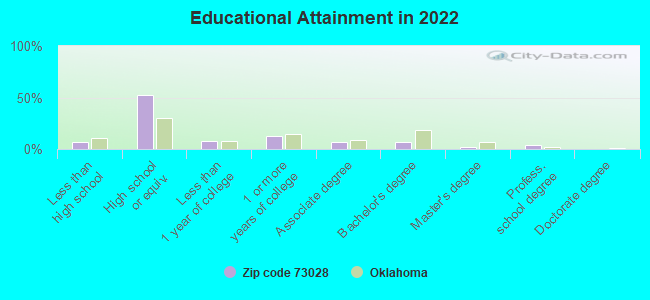
For population 25 years and over in 73028:
High school or higher: 92.5%
Bachelor's degree or higher: 13.3%
Graduate or professional degree: 6.3%
Unemployed: 2.5%
Mean travel time to work (commute): 30.9 minutes
For population 15 years and over in 73028:
Never married: 25.9%
Now married: 51.1%
Separated: 2.6%
Widowed: 6.7%
Divorced: 13.8%
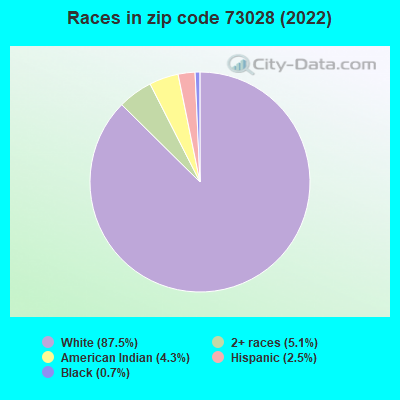
Zip code 73028 compared to state average:
Black race population percentage significantly below state average.
Hispanic race population percentage significantly below state average.
Median age significantly above state average.
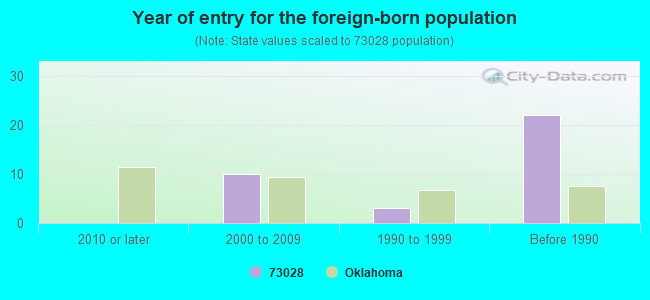
Foreign-born population percentage significantly below state average.
Renting percentage below state average.
Length of stay since moving in significantly above state average.
Number of college students below state average.
Percentage of population with a bachelor's degree or higher below state average.
Averages for the 2020 tax year for zip code 73028, filed in 2021:
Average Adjusted Gross Income (AGI) in 2020: $57,036 (Individual Income Tax Returns)
Here:
$57,036
State:
$63,060
Salary/wage: $50,021 (reported on 78.7% of returns)
Here:
$50,021
State:
$52,427
(% of AGI for various income ranges: 1182.2% for AGIs below $25k, 3604.8% for AGIs $25k-50k, 7354.3% for AGIs $50k-75k, 9253.0% for AGIs $75k-100k, 14738.0% for AGIs $100k-200k)
Taxable interest for individuals: $1,373 (reported on 27.2% of returns)
This zip code:
$1,373
Oklahoma:
$1,603
(% of AGI for various income ranges: 25.0% for AGIs below $25k, 32.8% for AGIs $25k-50k, 35.7% for AGIs $50k-75k, 32.0% for AGIs $75k-100k, 164.0% for AGIs $100k-200k)
Ordinary dividends: $3,894 (reported on 12.5% of returns)
Here:
$3,894
State:
$7,001
(% of AGI for various income ranges: 32.8% for AGIs below $25k, 66.4% for AGIs $50k-75k, 222.0% for AGIs $75k-100k, 242.0% for AGIs $100k-200k)
Net capital gain/loss in AGI: +$7,000 (reported on 11.8% of returns)
Here:
+$7,000
State:
+$19,855
(% of AGI for various income ranges: 24.4% for AGIs below $25k, 38.6% for AGIs $25k-50k, 93.6% for AGIs $50k-75k, 268.0% for AGIs $75k-100k, 531.0% for AGIs $100k-200k)
Profit/loss from business: +$8,515 (reported on 19.1% of returns)
Here:
+$8,515
State:
+$9,904
(% of AGI for various income ranges: 162.2% for AGIs below $25k, 170.0% for AGIs $25k-50k, 137.9% for AGIs $50k-75k, 86.0% for AGIs $75k-100k, 923.0% for AGIs $100k-200k)
Taxable individual retirement arrangement distribution: $14,817 (reported on 8.8% of returns)
73028:
$14,817
Oklahoma:
$20,476
(% of AGI for various income ranges: 74.4% for AGIs below $25k, 77.2% for AGIs $25k-50k, 377.9% for AGIs $50k-75k, 787.0% for AGIs $100k-200k)
Total itemized deductions: $41,771 (reported on 5.1% of returns)
Here:
$41,771
State:
$39,736
(% of AGI for various income ranges: 289.3% for AGIs $25k-50k, 2085.0% for AGIs $100k-200k)
Charity contributions: $15,880 (reported on 3.7% of returns)
Here:
$15,880
State:
$17,288
(% of AGI for various income ranges: 794.0% for AGIs $100k-200k)
Taxes paid: $6,371 (reported on 5.1% of returns)
73028:
$6,371
State:
$7,046
(% of AGI for various income ranges: 49.7% for AGIs $25k-50k, 302.0% for AGIs $100k-200k)
Earned income credit: $2,276 (reported on 18.4% of returns)
Here:
$2,276
State:
$2,435
(% of AGI for various income ranges: 99.7% for AGIs below $25k, 86.2% for AGIs $25k-50k)
Percentage of individuals using paid preparers for their 2020 taxes: 88.2%
Here:
88%
State:
94%
(% for various income ranges: 87.0% for AGIs below $25k, 89.2% for AGIs $25k-50k, 85.7% for AGIs $50k-75k, 92.9% for AGIs $75k-100k, 86.7% for AGIs $100k-200k, 100.0% for AGIs over 200k)
Averages for the 2012 tax year for zip code 73028, filed in 2013:
Average Adjusted Gross Income (AGI) in 2012: $48,832 (Individual Income Tax Returns)
Here:
$48,832
State:
$58,581
Salary/wage: $41,980 (reported on 80.6% of returns)
Here:
$41,980
State:
$45,973
(% of AGI for various income ranges: 70.8% for AGIs below $25k, 77.5% for AGIs $25k-50k, 78.8% for AGIs $50k-75k, 76.7% for AGIs $75k-100k, 95.7% for AGIs $100k-200k)
Taxable interest for individuals: $933 (reported on 30.9% of returns)
This zip code:
$933
Oklahoma:
$1,625
(% of AGI for various income ranges: 0.8% for AGIs below $25k, 0.8% for AGIs $25k-50k, 0.6% for AGIs $50k-75k, 0.3% for AGIs $75k-100k, 1.0% for AGIs $100k-200k)
Ordinary dividends: $2,511 (reported on 12.9% of returns)
Here:
$2,511
State:
$6,374
(% of AGI for various income ranges: 0.9% for AGIs below $25k, 1.0% for AGIs $25k-50k, 0.1% for AGIs $50k-75k, 0.4% for AGIs $75k-100k, 1.5% for AGIs $100k-200k)
Net capital gain/loss in AGI: +$4,438 (reported on 9.4% of returns)
Here:
+$4,438
State:
+$24,023
(% of AGI for various income ranges: 0.1% for AGIs below $25k, 0.3% for AGIs $25k-50k, 3.8% for AGIs $100k-200k)
Profit/loss from business: +$10,945 (reported on 22.3% of returns)
Here:
+$10,945
State:
+$11,913
(% of AGI for various income ranges: 12.6% for AGIs below $25k, 4.3% for AGIs $25k-50k, 3.6% for AGIs $50k-75k, 3.1% for AGIs $75k-100k, 8.2% for AGIs $100k-200k)
Taxable individual retirement arrangement distribution: $9,817 (reported on 8.6% of returns)
73028:
$9,817
Oklahoma:
$15,242
(% of AGI for various income ranges: 3.7% for AGIs below $25k, 2.0% for AGIs $25k-50k, 2.1% for AGIs $50k-75k, 3.5% for AGIs $75k-100k)
Total itemized deductions: $19,938 (21% of AGI, reported on 23.0% of returns)
Here:
$19,938
State:
$24,882
Here:
21.2% of AGI
State:
18.8% of AGI
(% of AGI for various income ranges: 8.4% for AGIs below $25k, 6.6% for AGIs $25k-50k, 7.6% for AGIs $50k-75k, 11.8% for AGIs $75k-100k, 11.5% for AGIs $100k-200k, 10.7% for AGIs over 200k)
Charity contributions: $5,435 (reported on 16.5% of returns)
Here:
$5,435
State:
$6,591
(% of AGI for various income ranges: 1.6% for AGIs $25k-50k, 1.0% for AGIs $50k-75k, 2.5% for AGIs $75k-100k, 4.7% for AGIs $100k-200k)
Taxes paid: $5,417 (reported on 21.6% of returns)
73028:
$5,417
State:
$7,196
(% of AGI for various income ranges: 0.9% for AGIs below $25k, 1.1% for AGIs $25k-50k, 1.5% for AGIs $50k-75k, 2.6% for AGIs $75k-100k, 3.4% for AGIs $100k-200k, 4.8% for AGIs over 200k)
Earned income credit: $2,239 (reported on 20.1% of returns)
Here:
$2,239
State:
$2,354
(% of AGI for various income ranges: 6.7% for AGIs below $25k, 1.3% for AGIs $25k-50k)
Percentage of individuals using paid preparers for their 2012 taxes: 61.2%
Here:
61%
State:
56%
(% for various income ranges: 54.5% for AGIs below $25k, 59.5% for AGIs $25k-50k, 66.7% for AGIs $50k-75k, 69.2% for AGIs $75k-100k, 90.9% for AGIs $100k-200k)
Averages for the 2004 tax year for zip code 73028, filed in 2005:
Average Adjusted Gross Income (AGI) in 2004: $33,560 (Individual Income Tax Returns)
Here:
$33,560
State:
$41,245
Salary/wage: $31,281 (reported on 77.6% of returns)
Here:
$31,281
State:
$35,318
(% of AGI for various income ranges: 101.8% for AGIs below $10k, 71.4% for AGIs $10k-25k, 80.1% for AGIs $25k-50k, 77.0% for AGIs $50k-75k, 70.2% for AGIs $75k-100k, 50.7% for AGIs over 100k)
Taxable interest for individuals: $1,430 (reported on 42.0% of returns)
This zip code:
$1,430
Oklahoma:
$1,745
(% of AGI for various income ranges: 8.6% for AGIs below $10k, 2.9% for AGIs $10k-25k, 1.8% for AGIs $25k-50k, 1.2% for AGIs $50k-75k, 1.2% for AGIs $75k-100k, 1.2% for AGIs over 100k)
Taxable dividends: $1,343 (reported on 17.2% of returns)
Here:
$1,343
State:
$2,920
(% of AGI for various income ranges: 3.0% for AGIs below $10k, 1.3% for AGIs $10k-25k, 0.7% for AGIs $25k-50k, 0.4% for AGIs $50k-75k, 0.3% for AGIs $75k-100k, 0.6% for AGIs over 100k)
Net capital gain/loss: +$3,085 (reported on 15.4% of returns)
Here:
+$3,085
State:
+$10,653
(% of AGI for various income ranges: 3.8% for AGIs below $10k, 1.6% for AGIs $10k-25k, 0.5% for AGIs $25k-50k, 1.2% for AGIs $50k-75k, 3.9% for AGIs $75k-100k, 0.6% for AGIs over 100k)
Profit/loss from business: +$7,881 (reported on 24.0% of returns)
Here:
+$7,881
State:
+$8,532
(% of AGI for various income ranges: 5.2% for AGIs below $10k, 8.5% for AGIs $10k-25k, 5.5% for AGIs $25k-50k, 2.7% for AGIs $50k-75k, 8.2% for AGIs $75k-100k, 5.0% for AGIs over 100k)
IRA payment deduction: $2,850 (reported on 1.5% of returns)
73028:
$2,850
Oklahoma:
$3,127
Total itemized deductions: $15,412 (25% of AGI, reported on 27.5% of returns)
Here:
$15,412
State:
$17,093
Here:
25.0% of AGI
State:
20.5% of AGI
(% of AGI for various income ranges: 22.3% for AGIs below $10k, 8.7% for AGIs $10k-25k, 10.5% for AGIs $25k-50k, 13.6% for AGIs $50k-75k, 13.8% for AGIs $75k-100k, 16.1% for AGIs over 100k)
Charity contributions deductions: $3,429 (6% of AGI, reported on 22.6% of returns)
Here:
$3,429
State:
$4,240
Here:
5.6% of AGI
State:
4.8% of AGI
(% of AGI for various income ranges: 2.5% for AGIs below $10k, 1.7% for AGIs $10k-25k, 1.6% for AGIs $25k-50k, 2.6% for AGIs $50k-75k, 3.0% for AGIs $75k-100k, 3.1% for AGIs over 100k)
Total tax: $4,247 (reported on 71.1% of returns)
73028:
$4,247
State:
$6,542
(% of AGI for various income ranges: 4.6% for AGIs below $10k, 4.1% for AGIs $10k-25k, 5.5% for AGIs $25k-50k, 8.4% for AGIs $50k-75k, 11.5% for AGIs $75k-100k, 19.1% for AGIs over 100k)
Earned income credit: $1,712 (reported on 20.0% of returns)
Here:
$1,712
State:
$1,830
Percentage of individuals using paid preparers for their 2004 taxes: 69.1%
Here:
69%
State:
63%
(% for various income ranges: 65.7% for AGIs below $10k, 68.8% for AGIs $10k-25k, 66.3% for AGIs $25k-50k, 73.3% for AGIs $50k-75k, 81.2% for AGIs $75k-100k, 81.6% for AGIs over 100k)
Household received Food Stamps/SNAP in the past 12 months: 196 Household did not receive Food Stamps/SNAP in the past 12 months: 1,322
Women who had a birth in the past 12 months: 26 (27 now married, 0 unmarried) Women who did not have a birth in the past 12 months: 764 (389 now married, 374 unmarried)
Housing units in zip code 73028 with a mortgage: 557 (2 second mortgage, 2 both second mortgage and home equity loan) Median monthly owner costs for units with a mortgage: $1,232 Median monthly owner costs for units without a mortgage: $525
Residents with income below the poverty level in 2022:
This zip code:
14.9%
Whole state:
15.7%
Residents with income below 50% of the poverty level in 2022:
This zip code:
10.5%
Whole state:
8.3%
Median number of rooms in houses and condos:
Here:
5.8
State:
6.1
Median number of rooms in apartments:
Here:
5.1
State:
4.5
Notable locations in this zip code not listed on our city pages
Notable locations in zip code 73028: Crescent Ambulance Service (A), Crescent Fire Department (B), Twin Lakes Volunteer Fire Department (C). Display/hide their locations on the map
Churches in zip code 73028 include: Central Church (A), Oak Valley Church (B), Saint Margaret Mary Church (C), Assembly of God Church (D), Baptist Church (E), Mount Pleasant Church (F), First Christian Church (G), First United Methodist Church (H), Immanuel Covenant Church (I). Display/hide their locations on the map
Cemeteries: Zion Community Cemetery (1), Knowles Cemetery (2), Oak Grove Cemetery (3), Oak Vale Cemetery (4), Oak View Cemetery (5), Crescent Cemetery (6). Display/hide their locations on the map
Reservoirs: Cedar Cove Lake (A), Winter Creek Site 11 Reservoir (B), Winter Creek Site 12 Reservoir (C), Winter Creek Site 16 Reservoir (D), Winter Creek Site 20 Reservoir (E), Oknoname 083034 Reservoir (F), Oknoname 083035 Reservoir (G), Oknoname 083038 Reservoir (H). Display/hide their locations on the map
In group quarters: 37 (-1 institutionalized population)
Size of family households: 502 2-persons, 300 3-persons, 163 4-persons, 64 5-persons, 7 6-persons
Size of nonfamily households: 323 1-person, 162 2-persons, 7 3-persons
412 married couples with children.
161 single-parent households (115 men, 46 women).
98.5% of residents of 73028 zip code speak English at home.
1.5% of residents speak Spanish at home (36% very well, 25% well, 18% not well, 20% not at all).
0.1% of residents speak other Indo-European language at home (100% very well).
0.1% of residents speak other language at home (100% very well).
Foreign born population: 32 (0.9%) (39.6% of them are naturalized citizens)
This zip code:
0.9%
Whole state:
6.0%
62%Honduras
31%Sweden
25%United Kingdom, excluding England and Scotland
12%Guatemala
18%German
14%English
14%American
5%European
5%Irish
4%Scottish
2%Czech
Year of entry for the foreign-born population
02010 or later
102000 to 2009
31990 to 1999
22Before 1990
Facilities with environmental interests located in this zip code:
CRESCENT MS (106 N. MAGNOLIA in CRESCENT, OK)
(National Center for Education Statistics) - STATE ID-42-I002-105 (National Center for Education Statistics) - STATE ID-42-I002-515
CRESCENT HS (106 N. MAGNOLA in CRESCENT, OK)
(National Center for Education Statistics) - STATE ID-42-I002-715
LUBRICATION SERVICES (202 WEST WASHINGTON in CRESCENT, OK)
(Integrated Compliance Information System) - ICIS-06-2003-4346, FORMAL ENFORCEMENT ACTION
CRESCENT COOP ASSOC/CRESCENT (NORTH PINE & SANDERSON in CRESCENT, OK)
AIR MINOR (AIRS/AFS) Business SIC classification: GRAIN AND FIELD BEANS Alternative names: CRESCENT COOPERATIVE ASSOCIATION, CRESCENT COOP/CRESCENT
DAVON CRUDE PIPELINE STATION (3.5M SOUTH & 1M WEST OF TOWN in CRESCENT, OK)
Small Quantity Generators, between 100 kg and 1000 kg of hazardous waste/month (Resource Conservation and Recovery Act (tracking hazardous waste)) Organizations: MID-CONTINENT PIPELINE (CONTACT/OPERATOR)
DCP MIDSTREAM LP/CRESCENT STA (5 MI W, 1MI S OFF HWY 74 in CRESCENT, OK)
AIR MAJOR (AIRS/AFS) CRITERIA AND HAZARDOUS AIR POLLUTANT INVENTORY (Inventory of air pollution sources) Business SIC classification: CRUDE PETROLEUM AND NATURAL GAS; NATURAL GAS TRANSMISSION Business NAICS classification: PIPELINE TRANSPORTATION OF NATURAL GAS. Alternative names: CONOCO INC./CRESCENT STAT, DUKE ENERGY FIELD S/CRESCENT STA
CANTERA NATURAL GAS INC (4 MI S OF CRESCENT, 1.5 MI W in CRESCENT, OK)
CRITERIA AND HAZARDOUS AIR POLLUTANT INVENTORY (Inventory of air pollution sources) Business SIC classification: NATURAL GAS LIQUIDS Alternative names: HERITAGE GAS SE/CRESCENT
CRESCENT PUBLIC SCHOOLS (106 N MAGNOLIA ST in CRESCENT, OK)
COMPLIANCE ACTIVITY (Tracking inspections of insecticide, fungicide, and rodenticide, and toxic substances)
Housing units lacking complete plumbing facilities: 2.7% Housing units lacking complete kitchen facilities: 2.4%
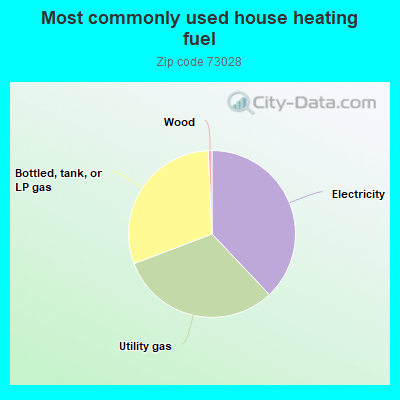
38.0%Electricity
31.3%Utility gas
30.1%Bottled, tank, or LP gas
0.7%Wood
Population in 1990: 2,832. Population change in the 1990s: +367 (+13.0%).
Place of birth for U.S.-born residents:
This state: 2,895
Northeast: 55
Midwest: 178
South: 271
West: 287
58% of the 73028 zip code residents lived in the same house 5 years ago. Out of people who lived in different houses, 52% lived in this county. Out of people who lived in different counties, 50% lived in Oklahoma.
87% of the 73028 zip code residents lived in the same house 1 year ago. Out of people who lived in different houses, 19% moved from this county. Out of people who lived in different houses, 55% moved from different county within same state. Out of people who lived in different houses, 23% moved from different state. Out of people who lived in different houses, 8% moved from abroad.
Private vs. public school enrollment:
Students in private schools in grades 1 to 8 (elementary and middle school): 42
Here:
15.6%
Oklahoma:
11.7%
Students in private schools in grades 9 to 12 (high school): 18
Here:
7.4%
Oklahoma:
11.7%
Students in private undergraduate colleges:
Here:
0.0%
Oklahoma:
19.3%
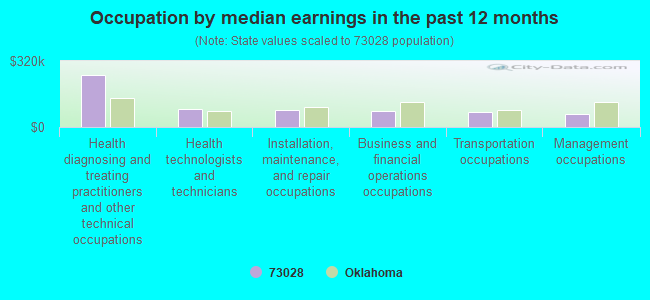
Occupation by median earnings in the past 12 months ($)
254,293Health diagnosing and treating practitioners and other technical occupations
89,034Health technologists and technicians
84,134Installation, maintenance, and repair occupations
78,366Business and financial operations occupations
74,984Transportation occupations
62,023Management occupations
Top industries in this zip code by the number of employees in 2005:
Mining: Crude Petroleum and Natural Gas Extraction (20-49 employees: 1 establishment, 1-4 employees: 2 establishments)
Finance and Insurance: Commercial Banking (20-49: 1)
Mining: Natural Gas Liquid Extraction (20-49: 1)
Mining: Support Activities for Oil and Gas Operations (10-19: 1, 1-4: 4)
Accommodation and Food Services: Full-Service Restaurants (10-19: 1, 5-9: 1)
Other Services (except Public Administration): Religious Organizations (5-9: 2, 1-4: 2)
People in group quarters in 2010:
38 people in nursing facilities/skilled-nursing facilities
People in group quarters in 2000:
32 people in nursing homes
Fatal accident statistics in 2014:
Fatal accident count: 2
Vehicles involved in fatal accidents: 4
Fatal accidents caused by drunken drivers: 0
Fatalities: 3
Persons involved in fatal accidents: 9
Pedestrians involved in fatal accidents: 0
Fatal accident statistics in 2013:
Fatal accident count: 2
Vehicles involved in fatal accidents: 2
Fatal accidents caused by drunken drivers: 2
Fatalities: 2
Persons involved in fatal accidents: 2
Pedestrians involved in fatal accidents: 0
Home Mortgage Disclosure Act Aggregated Statistics For Year 2009 (Based on 2 partial tracts)
A) FHA, FSA/RHS & VA Home Purchase Loans
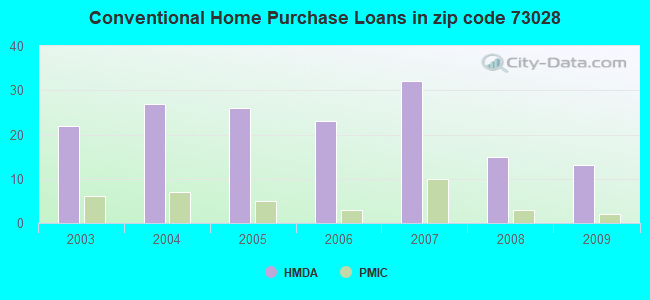
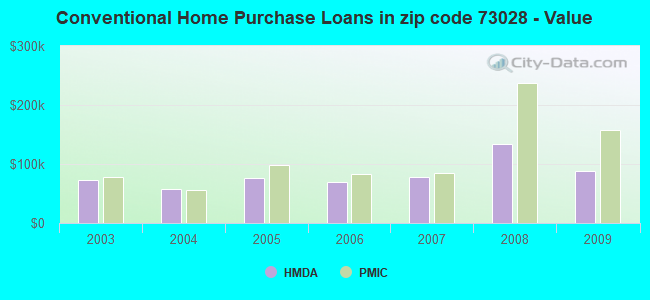
B) Conventional Home Purchase Loans
C) Refinancings
D) Home Improvement Loans
F) Non-occupant Loans on < 5 Family Dwellings (A B C & D)
G) Loans On Manufactured Home Dwelling (A B C & D)
Number
Average Value
Number
Average Value
Number
Average Value
Number
Average Value
Number
Average Value
Number
Average Value
LOANS ORIGINATED
16
$101,016
13
$87,621
37
$109,893
9
$24,794
11
$69,159
10
$52,182
APPLICATIONS APPROVED, NOT ACCEPTED
2
$42,225
1
$43,940
1
$118,780
1
$10,990
0
$0
1
$65,910
APPLICATIONS DENIED
5
$166,158
10
$76,007
16
$104,535
6
$9,383
1
$1,370
7
$65,129
APPLICATIONS WITHDRAWN
3
$86,053
3
$64,540
14
$118,095
1
$51,490
3
$91,547
3
$58,820
FILES CLOSED FOR INCOMPLETENESS
0
$0
1
$243,060
3
$91,547
0
$0
0
$0
1
$82,390
Aggregated Statistics For Year 2008 (Based on 2 partial tracts)
A) FHA, FSA/RHS & VA Home Purchase Loans
B) Conventional Home Purchase Loans
C) Refinancings
D) Home Improvement Loans
F) Non-occupant Loans on < 5 Family Dwellings (A B C & D)
G) Loans On Manufactured Home Dwelling (A B C & D)
Number
Average Value
Number
Average Value
Number
Average Value
Number
Average Value
Number
Average Value
Number
Average Value
LOANS ORIGINATED
8
$74,068
15
$133,246
32
$94,944
8
$28,838
7
$62,186
14
$76,556
APPLICATIONS APPROVED, NOT ACCEPTED
1
$81,020
2
$90,630
1
$65,230
1
$10,300
1
$20,600
0
$0
APPLICATIONS DENIED
1
$43,940
8
$49,779
17
$85,219
10
$39,617
1
$61,790
3
$78,273
APPLICATIONS WITHDRAWN
0
$0
3
$100,473
12
$124,332
1
$25,400
3
$44,630
1
$195,680
FILES CLOSED FOR INCOMPLETENESS
1
$237,560
0
$0
1
$61,110
0
$0
0
$0
1
$59,730
Aggregated Statistics For Year 2007 (Based on 2 partial tracts)
A) FHA, FSA/RHS & VA Home Purchase Loans
B) Conventional Home Purchase Loans
C) Refinancings
D) Home Improvement Loans
F) Non-occupant Loans on < 5 Family Dwellings (A B C & D)
G) Loans On Manufactured Home Dwelling (A B C & D)
Number
Average Value
Number
Average Value
Number
Average Value
Number
Average Value
Number
Average Value
Number
Average Value
LOANS ORIGINATED
3
$87,657
32
$77,350
33
$100,265
14
$25,551
11
$31,022
19
$51,387
APPLICATIONS APPROVED, NOT ACCEPTED
0
$0
4
$38,620
3
$83,993
1
$71,410
0
$0
4
$53,212
APPLICATIONS DENIED
2
$69,005
12
$68,259
25
$101,315
16
$37,205
3
$29,293
7
$61,010
APPLICATIONS WITHDRAWN
0
$0
2
$37,765
8
$100,244
1
$30,900
1
$14,420
2
$58,705
FILES CLOSED FOR INCOMPLETENESS
1
$34,330
1
$12,360
4
$101,272
1
$27,460
0
$0
0
$0
Aggregated Statistics For Year 2006 (Based on 2 partial tracts)
A) FHA, FSA/RHS & VA Home Purchase Loans
B) Conventional Home Purchase Loans
C) Refinancings
D) Home Improvement Loans
F) Non-occupant Loans on < 5 Family Dwellings (A B C & D)
G) Loans On Manufactured Home Dwelling (A B C & D)
Number
Average Value
Number
Average Value
Number
Average Value
Number
Average Value
Number
Average Value
Number
Average Value
LOANS ORIGINATED
9
$90,708
23
$69,705
45
$87,137
16
$41,711
19
$32,234
14
$51,691
APPLICATIONS APPROVED, NOT ACCEPTED
0
$0
8
$71,578
10
$76,213
0
$0
2
$31,240
3
$78,043
APPLICATIONS DENIED
2
$50,465
21
$77,357
40
$90,442
13
$20,968
8
$33,042
8
$46,431
APPLICATIONS WITHDRAWN
1
$76,900
8
$37,162
16
$70,076
1
$17,160
2
$41,540
2
$30,555
FILES CLOSED FOR INCOMPLETENESS
0
$0
3
$72,550
7
$88,767
1
$49,440
1
$30,210
0
$0
Aggregated Statistics For Year 2005 (Based on 2 partial tracts)
A) FHA, FSA/RHS & VA Home Purchase Loans
B) Conventional Home Purchase Loans
C) Refinancings
D) Home Improvement Loans
F) Non-occupant Loans on < 5 Family Dwellings (A B C & D)
G) Loans On Manufactured Home Dwelling (A B C & D)
Number
Average Value
Number
Average Value
Number
Average Value
Number
Average Value
Number
Average Value
Number
Average Value
LOANS ORIGINATED
4
$77,415
26
$76,847
60
$67,813
14
$21,726
16
$63,382
12
$47,604
APPLICATIONS APPROVED, NOT ACCEPTED
0
$0
12
$56,988
8
$110,629
2
$6,865
3
$34,100
5
$45,590
APPLICATIONS DENIED
2
$75,185
15
$48,932
41
$63,921
8
$13,475
1
$10,990
11
$40,073
APPLICATIONS WITHDRAWN
1
$63,850
11
$58,985
20
$73,775
2
$76,215
0
$0
3
$37,533
FILES CLOSED FOR INCOMPLETENESS
0
$0
1
$90,630
1
$47,380
1
$44,630
0
$0
0
$0
Aggregated Statistics For Year 2004 (Based on 2 partial tracts)
A) FHA, FSA/RHS & VA Home Purchase Loans
B) Conventional Home Purchase Loans
C) Refinancings
D) Home Improvement Loans
F) Non-occupant Loans on < 5 Family Dwellings (A B C & D)
G) Loans On Manufactured Home Dwelling (A B C & D)
Number
Average Value
Number
Average Value
Number
Average Value
Number
Average Value
Number
Average Value
Number
Average Value
LOANS ORIGINATED
8
$66,600
27
$56,962
43
$63,790
14
$25,355
8
$31,069
12
$68,889
APPLICATIONS APPROVED, NOT ACCEPTED
0
$0
3
$229,323
5
$155,720
1
$11,670
0
$0
1
$51,490
APPLICATIONS DENIED
4
$57,845
15
$79,737
35
$72,525
10
$28,494
3
$32,500
12
$69,576
APPLICATIONS WITHDRAWN
0
$0
3
$140,523
13
$66,442
1
$6,870
1
$30,210
0
$0
FILES CLOSED FOR INCOMPLETENESS
1
$55,610
1
$158,600
2
$105,735
0
$0
0
$0
0
$0
Aggregated Statistics For Year 2003 (Based on 2 partial tracts)
A) FHA, FSA/RHS & VA Home Purchase Loans
B) Conventional Home Purchase Loans
C) Refinancings
D) Home Improvement Loans
F) Non-occupant Loans on < 5 Family Dwellings (A B C & D)
Detailed PMIC statistics for the following Tracts:6007.00
2005 - 2018 National Fire Incident Reporting System (NFIRS) incidents
According to the data from the years 2005 - 2018 the average number of fires per year is 38. The highest number of reported fires - 106 took place in 2006, and the least - 5 in 2010. The data has a decreasing trend.
When looking into fire subcategories, the most reports belonged to: Outside Fires (82.9%), and Structure Fires (9.7%).
Fire incident types reported to NFIRS in Zip Code 73028

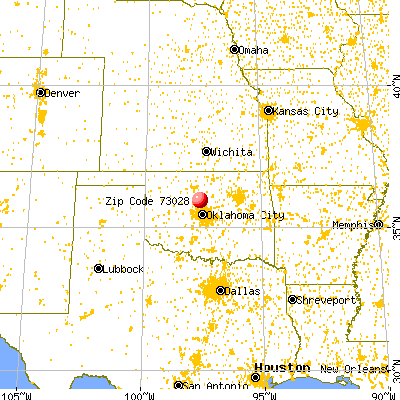


 Nearest zip codes: 73016, 73056, 73063, 73734, 73044, 73025.


 According to the data from the years 2005 - 2018 the average number of fires per year is 38. The highest number of reported fires - 106 took place in 2006, and the least - 5 in 2010. The data has a decreasing trend.
 When looking into fire subcategories, the most reports belonged to: Outside Fires (82.9%), and Structure Fires (9.7%).