Estimated zip code population in 2022: 5,838 Zip code population in 2010: 5,476 Zip code population in 2000: 4,547
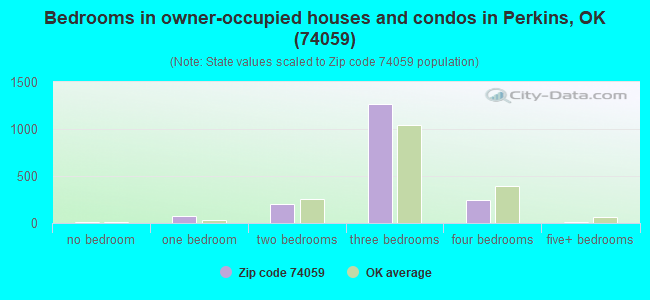
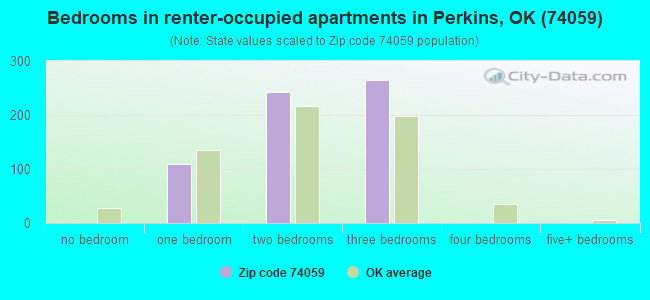
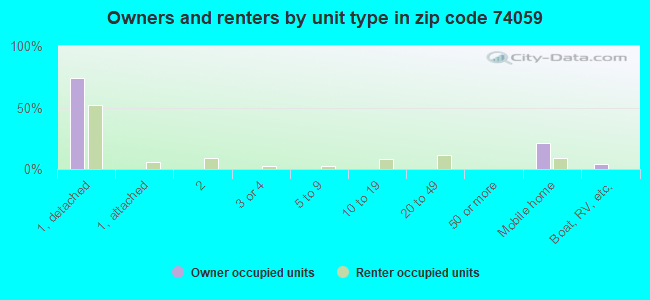
Houses and condos: 2,597 Renter-occupied apartments: 621
% of renters here:
26%
State:
35%
March 2022 cost of living index in zip code 74059: 80.3 (low, U.S. average is 100)
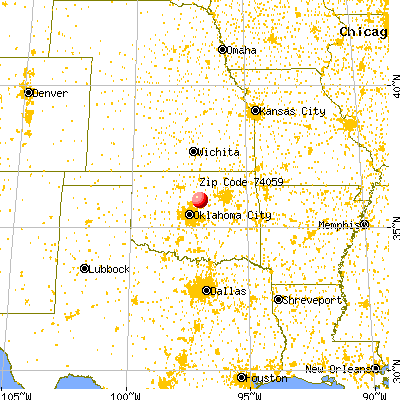
Land area: 115.5 sq. mi. Water area: 1.2 sq. mi.
Population density: 51 people per square mile
(very low).
OSM Map
General Map
Google Map
MSN Map
OSM Map
General Map
Google Map
MSN Map
OSM Map
General Map
Google Map
MSN Map
OSM Map
General Map
Google Map
MSN Map
Please wait while loading the map...
Real estate property taxes paid for housing units in 2022:
This zip code:
0.8% ($1,502)
Oklahoma:
0.8% ($1,501)
Median real estate property taxes paid for housing units with mortgages in 2022: $1,625 (0.8%) Median real estate property taxes paid for housing units with no mortgage in 2022: $1,302 (0.7%)
Business Search- 14 Million verified businesses
Males: 2,976
(51.0%)
Females: 2,862
(49.0%)
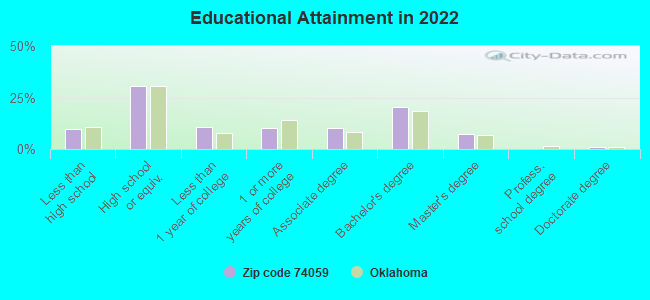
For population 25 years and over in 74059:
High school or higher: 90.0%
Bachelor's degree or higher: 28.9%
Graduate or professional degree: 8.5%
Unemployed: 5.3%
Mean travel time to work (commute): 25.3 minutes
For population 15 years and over in 74059:
Never married: 25.1%
Now married: 55.8%
Separated: 0.6%
Widowed: 5.5%
Divorced: 13.0%
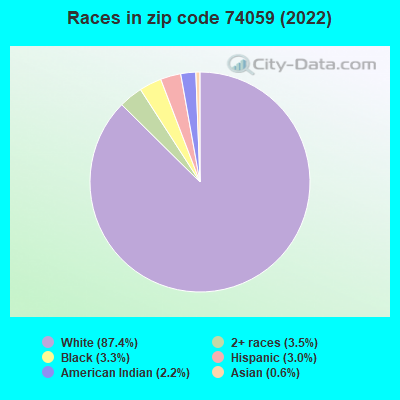
Zip code 74059 compared to state average:
Black race population percentage below state average.
Hispanic race population percentage significantly below state average.
Median age below state average.
Foreign-born population percentage significantly below state average.
Estimated median house/condo value in 2022: $190,576
74059:
$190,576
Oklahoma:
$191,700
According to our research of Oklahoma and other state lists, there were 10 registered sex offenders living in 74059 zip code as of May 28, 2024. The ratio of all residents to sex offenders in zip code 74059 is 534 to 1. The ratio of registered sex offenders to all residents in this zip code is near the state average.
Median resident age:
This zip code:
31.0 years
Oklahoma median age:
37.1 years
Average household size:
This zip code:
2.4 people
Oklahoma:
2.5 people
Averages for the 2020 tax year for zip code 74059, filed in 2021:
Average Adjusted Gross Income (AGI) in 2020: $53,908 (Individual Income Tax Returns)
Here:
$53,908
State:
$63,060
Salary/wage: $48,911 (reported on 80.3% of returns)
Here:
$48,911
State:
$52,427
(% of AGI for various income ranges: 1115.9% for AGIs below $25k, 3611.1% for AGIs $25k-50k, 6905.7% for AGIs $50k-75k, 9368.5% for AGIs $75k-100k, 16073.0% for AGIs $100k-200k, 39205.0% for AGIs over 200k)
Taxable interest for individuals: $925 (reported on 29.7% of returns)
This zip code:
$925
Oklahoma:
$1,603
(% of AGI for various income ranges: 17.9% for AGIs below $25k, 20.0% for AGIs $25k-50k, 44.3% for AGIs $50k-75k, 29.0% for AGIs $75k-100k, 86.0% for AGIs $100k-200k, 780.0% for AGIs over 200k)
Ordinary dividends: $2,975 (reported on 11.9% of returns)
Here:
$2,975
State:
$7,001
(% of AGI for various income ranges: 8.3% for AGIs below $25k, 24.5% for AGIs $25k-50k, 62.9% for AGIs $50k-75k, 29.5% for AGIs $75k-100k, 146.0% for AGIs $100k-200k, 1165.0% for AGIs over 200k)
Net capital gain/loss in AGI: +$11,972 (reported on 11.9% of returns)
Here:
+$11,972
State:
+$19,855
(% of AGI for various income ranges: 25.2% for AGIs below $25k, 48.0% for AGIs $25k-50k, 104.3% for AGIs $50k-75k, 188.5% for AGIs $75k-100k, 469.5% for AGIs $100k-200k, 8940.0% for AGIs over 200k)
Profit/loss from business: +$9,469 (reported on 18.2% of returns)
Here:
+$9,469
State:
+$9,904
(% of AGI for various income ranges: 177.4% for AGIs below $25k, 163.8% for AGIs $25k-50k, 293.9% for AGIs $50k-75k, 244.0% for AGIs $75k-100k, 620.5% for AGIs $100k-200k)
Taxable individual retirement arrangement distribution: $18,670 (reported on 7.4% of returns)
74059:
$18,670
Oklahoma:
$20,476
(% of AGI for various income ranges: 35.6% for AGIs below $25k, 86.2% for AGIs $25k-50k, 206.4% for AGIs $50k-75k, 334.5% for AGIs $75k-100k, 884.5% for AGIs $100k-200k)
Total itemized deductions: $34,843 (reported on 5.2% of returns)
Here:
$34,843
State:
$39,736
(% of AGI for various income ranges: 81.5% for AGIs below $25k, 336.8% for AGIs $50k-75k, 883.5% for AGIs $100k-200k, 8150.0% for AGIs over 200k)
Charity contributions: $16,790 (reported on 3.7% of returns)
Here:
$16,790
State:
$17,288
(% of AGI for various income ranges: 111.4% for AGIs $50k-75k, 259.0% for AGIs $100k-200k, 4245.0% for AGIs over 200k)
Taxes paid: $5,807 (reported on 5.2% of returns)
74059:
$5,807
State:
$7,046
(% of AGI for various income ranges: 6.7% for AGIs below $25k, 62.5% for AGIs $50k-75k, 178.5% for AGIs $100k-200k, 1185.0% for AGIs over 200k)
Earned income credit: $2,382 (reported on 18.6% of returns)
Here:
$2,382
State:
$2,435
(% of AGI for various income ranges: 105.5% for AGIs below $25k, 86.8% for AGIs $25k-50k, 3.2% for AGIs $50k-75k)
Percentage of individuals using paid preparers for their 2020 taxes: 94.1%
Here:
94%
State:
94%
(% for various income ranges: 94.4% for AGIs below $25k, 93.0% for AGIs $25k-50k, 95.1% for AGIs $50k-75k, 93.1% for AGIs $75k-100k, 96.9% for AGIs $100k-200k, 83.3% for AGIs over 200k)
Averages for the 2012 tax year for zip code 74059, filed in 2013:
Average Adjusted Gross Income (AGI) in 2012: $50,774 (Individual Income Tax Returns)
Here:
$50,774
State:
$58,581
Salary/wage: $43,098 (reported on 83.1% of returns)
Here:
$43,098
State:
$45,973
(% of AGI for various income ranges: 73.7% for AGIs below $25k, 79.7% for AGIs $25k-50k, 79.0% for AGIs $50k-75k, 82.5% for AGIs $75k-100k, 72.8% for AGIs $100k-200k, 28.7% for AGIs over 200k)
Taxable interest for individuals: $920 (reported on 30.3% of returns)
This zip code:
$920
Oklahoma:
$1,625
(% of AGI for various income ranges: 1.4% for AGIs below $25k, 0.7% for AGIs $25k-50k, 0.5% for AGIs $50k-75k, 0.4% for AGIs $75k-100k, 0.2% for AGIs $100k-200k, 0.6% for AGIs over 200k)
Ordinary dividends: $2,219 (reported on 11.7% of returns)
Here:
$2,219
State:
$6,374
(% of AGI for various income ranges: 0.5% for AGIs below $25k, 0.6% for AGIs $25k-50k, 0.5% for AGIs $50k-75k, 0.6% for AGIs $75k-100k, 0.7% for AGIs $100k-200k)
Net capital gain/loss in AGI: +$10,788 (reported on 10.4% of returns)
Here:
+$10,788
State:
+$24,023
(% of AGI for various income ranges: 0.3% for AGIs below $25k, 0.9% for AGIs $25k-50k, 1.1% for AGIs $50k-75k, 1.6% for AGIs $75k-100k, 6.7% for AGIs $100k-200k)
Profit/loss from business: +$10,336 (reported on 18.2% of returns)
Here:
+$10,336
State:
+$11,913
(% of AGI for various income ranges: 6.1% for AGIs below $25k, 4.6% for AGIs $25k-50k, 2.6% for AGIs $50k-75k, 1.5% for AGIs $75k-100k, 6.6% for AGIs $100k-200k)
Taxable individual retirement arrangement distribution: $10,083 (reported on 7.8% of returns)
74059:
$10,083
Oklahoma:
$15,242
(% of AGI for various income ranges: 1.9% for AGIs below $25k, 1.2% for AGIs $25k-50k, 1.6% for AGIs $50k-75k, 1.5% for AGIs $75k-100k, 2.6% for AGIs $100k-200k)
Total itemized deductions: $20,802 (21% of AGI, reported on 22.5% of returns)
Here:
$20,802
State:
$24,882
Here:
20.7% of AGI
State:
18.8% of AGI
(% of AGI for various income ranges: 6.1% for AGIs below $25k, 7.5% for AGIs $25k-50k, 7.2% for AGIs $50k-75k, 10.2% for AGIs $75k-100k, 11.6% for AGIs $100k-200k, 11.5% for AGIs over 200k)
Charity contributions: $6,133 (reported on 16.9% of returns)
Here:
$6,133
State:
$6,591
(% of AGI for various income ranges: 0.8% for AGIs below $25k, 1.3% for AGIs $25k-50k, 1.4% for AGIs $50k-75k, 1.8% for AGIs $75k-100k, 3.3% for AGIs $100k-200k, 3.0% for AGIs over 200k)
Taxes paid: $4,952 (reported on 21.6% of returns)
74059:
$4,952
State:
$7,196
(% of AGI for various income ranges: 0.7% for AGIs below $25k, 1.3% for AGIs $25k-50k, 1.3% for AGIs $50k-75k, 2.5% for AGIs $75k-100k, 3.6% for AGIs $100k-200k, 2.5% for AGIs over 200k)
Earned income credit: $2,274 (reported on 20.3% of returns)
Here:
$2,274
State:
$2,354
(% of AGI for various income ranges: 6.9% for AGIs below $25k, 1.4% for AGIs $25k-50k)
Percentage of individuals using paid preparers for their 2012 taxes: 55.8%
Here:
56%
State:
56%
(% for various income ranges: 51.1% for AGIs below $25k, 50.0% for AGIs $25k-50k, 59.0% for AGIs $50k-75k, 65.0% for AGIs $75k-100k, 71.4% for AGIs $100k-200k, 100.0% for AGIs over 200k)
Averages for the 2004 tax year for zip code 74059, filed in 2005:
Average Adjusted Gross Income (AGI) in 2004: $33,424 (Individual Income Tax Returns)
Here:
$33,424
State:
$41,245
Salary/wage: $31,816 (reported on 84.3% of returns)
Here:
$31,816
State:
$35,318
(% of AGI for various income ranges: 136.4% for AGIs below $10k, 76.4% for AGIs $10k-25k, 83.6% for AGIs $25k-50k, 86.5% for AGIs $50k-75k, 77.7% for AGIs $75k-100k, 58.1% for AGIs over 100k)
Taxable interest for individuals: $1,383 (reported on 36.5% of returns)
This zip code:
$1,383
Oklahoma:
$1,745
(% of AGI for various income ranges: 8.2% for AGIs below $10k, 2.7% for AGIs $10k-25k, 0.9% for AGIs $25k-50k, 0.9% for AGIs $50k-75k, 0.9% for AGIs $75k-100k, 2.6% for AGIs over 100k)
Taxable dividends: $1,088 (reported on 14.2% of returns)
Here:
$1,088
State:
$2,920
(% of AGI for various income ranges: 0.6% for AGIs below $10k, 0.5% for AGIs $10k-25k, 0.3% for AGIs $25k-50k, 0.3% for AGIs $50k-75k, 0.3% for AGIs $75k-100k, 1.4% for AGIs over 100k)
Net capital gain/loss: +$3,004 (reported on 13.7% of returns)
Here:
+$3,004
State:
+$10,653
(% of AGI for various income ranges: -1.3% for AGIs below $10k, 1.4% for AGIs $10k-25k, 0.7% for AGIs $25k-50k, 0.5% for AGIs $50k-75k, 2.4% for AGIs $75k-100k, 3.0% for AGIs over 100k)
Profit/loss from business: +$6,584 (reported on 19.5% of returns)
Here:
+$6,584
State:
+$8,532
(% of AGI for various income ranges: 21.2% for AGIs below $10k, 5.3% for AGIs $10k-25k, 4.3% for AGIs $25k-50k, 2.7% for AGIs $50k-75k, 1.6% for AGIs $75k-100k, 3.2% for AGIs over 100k)
IRA payment deduction: $2,732 (reported on 2.0% of returns)
74059:
$2,732
Oklahoma:
$3,127
Total itemized deductions: $13,961 (24% of AGI, reported on 29.0% of returns)
Here:
$13,961
State:
$17,093
Here:
24.1% of AGI
State:
20.5% of AGI
(% of AGI for various income ranges: 11.9% for AGIs below $10k, 8.5% for AGIs $10k-25k, 10.8% for AGIs $25k-50k, 12.2% for AGIs $50k-75k, 15.4% for AGIs $75k-100k, 15.5% for AGIs over 100k)
Charity contributions deductions: $3,513 (6% of AGI, reported on 23.4% of returns)
Here:
$3,513
State:
$4,240
Here:
5.7% of AGI
State:
4.8% of AGI
(% of AGI for various income ranges: 1.7% for AGIs $10k-25k, 1.6% for AGIs $25k-50k, 2.0% for AGIs $50k-75k, 4.1% for AGIs $75k-100k, 5.0% for AGIs over 100k)
Total tax: $3,740 (reported on 72.7% of returns)
74059:
$3,740
State:
$6,542
(% of AGI for various income ranges: 6.1% for AGIs below $10k, 4.0% for AGIs $10k-25k, 6.0% for AGIs $25k-50k, 7.7% for AGIs $50k-75k, 9.9% for AGIs $75k-100k, 17.0% for AGIs over 100k)
Earned income credit: $1,785 (reported on 19.2% of returns)
Here:
$1,785
State:
$1,830
Percentage of individuals using paid preparers for their 2004 taxes: 65.7%
Here:
66%
State:
63%
(% for various income ranges: 62.9% for AGIs below $10k, 65.1% for AGIs $10k-25k, 66.0% for AGIs $25k-50k, 65.9% for AGIs $50k-75k, 70.6% for AGIs $75k-100k, 81.8% for AGIs over 100k)
Household received Food Stamps/SNAP in the past 12 months: 195 Household did not receive Food Stamps/SNAP in the past 12 months: 2,217
Women who had a birth in the past 12 months: 46 (47 now married, 0 unmarried) Women who did not have a birth in the past 12 months: 1,074 (624 now married, 449 unmarried)
Housing units in zip code 74059 with a mortgage: 922 (23 second mortgage, 3 home equity loan, 1 both second mortgage and home equity loan) Houses without a mortgage: 5
Median monthly owner costs for units with a mortgage: $1,147 Median monthly owner costs for units without a mortgage: $395
Residents with income below the poverty level in 2022:
This zip code:
16.6%
Whole state:
15.7%
Residents with income below 50% of the poverty level in 2022:
This zip code:
3.2%
Whole state:
8.3%
Median number of rooms in houses and condos:
Here:
6.0
State:
6.1
Median number of rooms in apartments:
Here:
4.5
State:
4.5
Notable locations in this zip code not listed on our city pages
Notable locations in zip code 74059: Merrick Volunteer Fire Department (A), Iowa Tribal Volunteer Fire Department (B), Perkins Fire Department (C). Display/hide their locations on the map
Churches in zip code 74059 include: Eden Chapel (A), Free Methodist Church (B), Olivet Church (C), Bible Evanglistic Temple (D). Display/hide their locations on the map
Cemeteries: Elm Grove Cemetery (1), Iowa Chapel Cemetery (2), Iowa Indian Cemetery (3), Perkins Cemetery (4), Olivet Cemetery (5), Knipe Cemetery (6), Clayton Cemetery (7). Display/hide their locations on the map
Reservoirs: Stillwater Creek Site 56 Reservoir (A), Oknoname 08117 Reservoir (B), Oknoname 08118 Reservoir (C), Twin Lakes (D), Oknoname 11909 Reservoir (E). Display/hide their locations on the map
Creeks: Wild Horse Creek (A), Headquarters Creek (B), Corduroy Creek (C), Spring Creek (D), Sand Creek (E), Lost Creek (F), Dugout Creek (G), Deer Creek (H). Display/hide their locations on the map
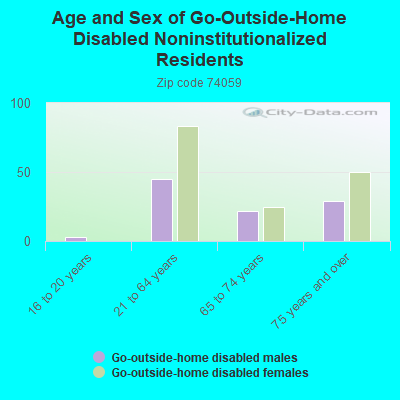
In group quarters: 17 (-1 institutionalized population)
Size of family households: 731 2-persons, 333 3-persons, 217 4-persons, 174 5-persons, 8 6-persons, 103 7-or-more-persons
Size of nonfamily households: 857 1-person, 5 2-persons
1,332 married couples with children.
306 single-parent households (111 men, 195 women).
96.6% of residents of 74059 zip code speak English at home.
2.4% of residents speak Spanish at home (60% very well, 37% well, 3% not well).
0.9% of residents speak Asian or Pacific Island language at home (100% very well).
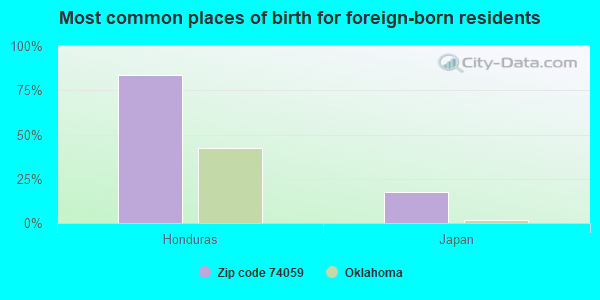
Foreign born population: 133 (2.3%) (32.2% of them are naturalized citizens)
This zip code:
2.3%
Whole state:
6.0%
83%Honduras
17%Japan
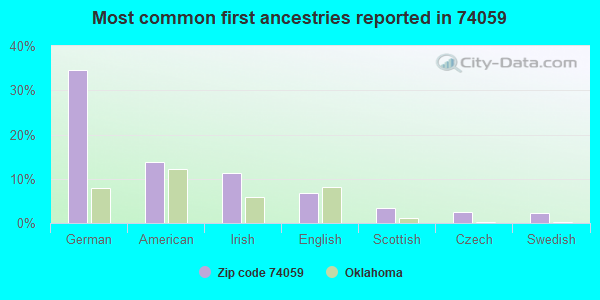
35%German
14%American
11%Irish
7%English
3%Scottish
2%Czech
2%Swedish
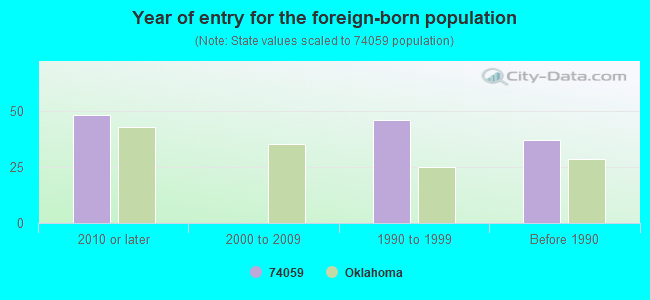
Year of entry for the foreign-born population
482010 or later
02000 to 2009
461990 to 1999
37Before 1990
Facilities with environmental interests located in this zip code:
DCP MIDSTREAM LP/COYLE STA CARNEY LIN (4 MI W 1.5 MI N HWY 77/33 in PERKINS, OK)
AIR MINOR (AIRS/AFS) Business SIC classification: NATURAL GAS TRANSMISSION Alternative names: DUKE ENERGY FIELD S/COYLE STA CARNEY LIN
CUMMINS CONSTRCTN C/PLT 2745 (SE CORNER OF HWYS 33 AND 177 in PERKINS, OK)
AIR SYNTHETIC MINOR (AIRS/AFS) Business SIC classification: ASPHALT PAVING MIXTURES AND BLOCKS Alternative names: CUMMINS CONSTRUCTION COMPANY PLANT 2745, CUMMINS CONSTRUCTION COMPANY, CUMMINS CONST CO IN/PLT 2745
Housing units lacking complete plumbing facilities: 1.4% Housing units lacking complete kitchen facilities: 1.1%
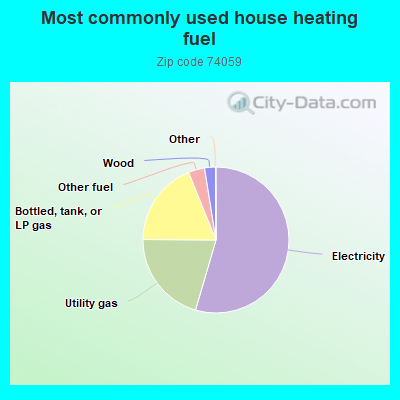
54.6%Electricity
20.6%Utility gas
18.8%Bottled, tank, or LP gas
3.6%Other fuel
2.4%Wood
Population in 1990: 3,246. Population change in the 1990s: +1,301 (+40.1%).
Place of birth for U.S.-born residents:
This state: 3,689
Northeast: 115
Midwest: 802
South: 708
West: 388
54% of the 74059 zip code residents lived in the same house 5 years ago. Out of people who lived in different houses, 58% lived in this county. Out of people who lived in different counties, 50% lived in Oklahoma.
95% of the 74059 zip code residents lived in the same house 1 year ago. Out of people who lived in different houses, 78% moved from this county. Out of people who lived in different houses, 22% moved from different county within same state. Out of people who lived in different houses, 6% moved from different state.
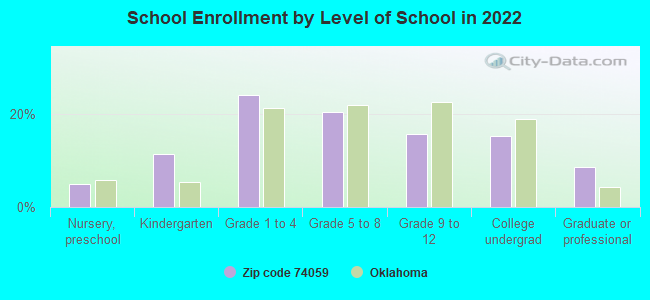
Private vs. public school enrollment:
Students in private schools in grades 1 to 8 (elementary and middle school): 294
Here:
43.7%
Oklahoma:
11.7%
Students in private schools in grades 9 to 12 (high school): 57
Here:
24.7%
Oklahoma:
11.7%
Students in private undergraduate colleges: 2
Here:
1.1%
Oklahoma:
19.3%
Occupation by median earnings in the past 12 months ($)
115,595Health diagnosing and treating practitioners and other technical occupations
104,793Computer and mathematical occupations
60,169Installation, maintenance, and repair occupations
55,200Construction and extraction occupations
51,054Management occupations
48,232Education, training, and library occupations
Top industries in this zip code by the number of employees in 2005:
Other Services (except Public Administration): Religious Organizations (10-19 employees: 1 establishment, 5-9 employees: 2 establishments, 1-4 employees: 3 establishments)
Accommodation and Food Services: Limited-Service Restaurants (20-49: 1)
Wholesale Trade: Wholesale Trade Agents and Brokers (20-49: 1)
Finance and Insurance: Commercial Banking (20-49: 1)
Accommodation and Food Services: Full-Service Restaurants (10-19: 2)
Health Care and Social Assistance: Child Day Care Services (10-19: 1, 5-9: 1, 1-4: 2)
Construction: Plumbing, Heating, and Air-Conditioning Contractors (10-19: 1, 1-4: 2)
People in group quarters in 2010:
11 people in group homes for juveniles (non-correctional)
4 people in workers' group living quarters and job corps centers
People in group quarters in 2000:
18 people in unknown juvenile institutions
Fatal accident statistics in 2014:
Fatal accident count: 2
Vehicles involved in fatal accidents: 3
Fatal accidents caused by drunken drivers: 0
Fatalities: 3
Persons involved in fatal accidents: 5
Pedestrians involved in fatal accidents: 0
Fatal accident statistics in 2013:
Fatal accident count: 1
Vehicles involved in fatal accidents: 2
Fatal accidents caused by drunken drivers: 0
Fatalities: 2
Persons involved in fatal accidents: 3
Pedestrians involved in fatal accidents: 0
Home Mortgage Disclosure Act Aggregated Statistics For Year 2009 (Based on 2 partial tracts)
A) FHA, FSA/RHS & VA Home Purchase Loans
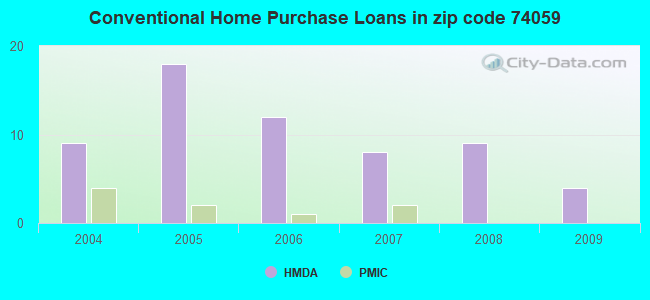
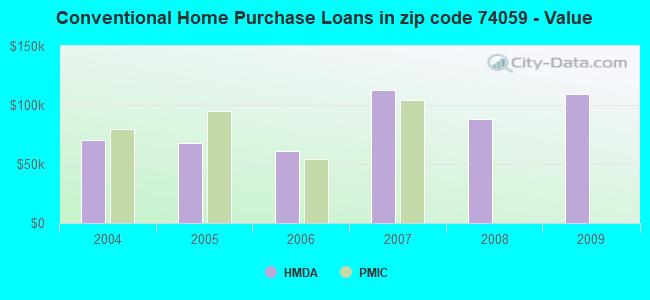
B) Conventional Home Purchase Loans
C) Refinancings
D) Home Improvement Loans
G) Loans On Manufactured Home Dwelling (A B C & D)
Number
Average Value
Number
Average Value
Number
Average Value
Number
Average Value
Number
Average Value
LOANS ORIGINATED
4
$95,315
4
$109,242
13
$96,342
4
$42,692
4
$47,942
APPLICATIONS APPROVED, NOT ACCEPTED
1
$82,190
0
$0
3
$90,407
0
$0
1
$81,730
APPLICATIONS DENIED
0
$0
2
$92,460
9
$73,006
2
$10,960
2
$72,600
APPLICATIONS WITHDRAWN
0
$0
0
$0
5
$120,086
1
$73,060
1
$136,070
FILES CLOSED FOR INCOMPLETENESS
0
$0
0
$0
5
$73,422
0
$0
1
$94,520
Aggregated Statistics For Year 2008 (Based on 2 partial tracts)
A) FHA, FSA/RHS & VA Home Purchase Loans
B) Conventional Home Purchase Loans
C) Refinancings
D) Home Improvement Loans
F) Non-occupant Loans on < 5 Family Dwellings (A B C & D)
G) Loans On Manufactured Home Dwelling (A B C & D)
Number
Average Value
Number
Average Value
Number
Average Value
Number
Average Value
Number
Average Value
Number
Average Value
LOANS ORIGINATED
2
$97,710
9
$88,276
15
$63,193
5
$40,454
6
$89,265
9
$57,734
APPLICATIONS APPROVED, NOT ACCEPTED
0
$0
2
$38,355
1
$160,720
0
$0
0
$0
2
$38,355
APPLICATIONS DENIED
1
$58,440
2
$35,160
11
$79,946
4
$34,702
0
$0
2
$76,935
APPLICATIONS WITHDRAWN
0
$0
0
$0
3
$68,337
1
$68,030
0
$0
0
$0
FILES CLOSED FOR INCOMPLETENESS
0
$0
0
$0
0
$0
0
$0
0
$0
0
$0
Aggregated Statistics For Year 2007 (Based on 2 partial tracts)
A) FHA, FSA/RHS & VA Home Purchase Loans
B) Conventional Home Purchase Loans
C) Refinancings
D) Home Improvement Loans
F) Non-occupant Loans on < 5 Family Dwellings (A B C & D)
G) Loans On Manufactured Home Dwelling (A B C & D)
Number
Average Value
Number
Average Value
Number
Average Value
Number
Average Value
Number
Average Value
Number
Average Value
LOANS ORIGINATED
3
$97,257
8
$112,838
18
$76,582
4
$41,322
3
$114,453
9
$59,612
APPLICATIONS APPROVED, NOT ACCEPTED
0
$0
3
$52,203
0
$0
0
$0
0
$0
2
$38,355
APPLICATIONS DENIED
1
$138,350
3
$41,247
10
$68,307
5
$31,962
0
$0
3
$86,907
APPLICATIONS WITHDRAWN
0
$0
2
$65,750
4
$96,912
1
$27,850
0
$0
0
$0
FILES CLOSED FOR INCOMPLETENESS
0
$0
0
$0
0
$0
0
$0
0
$0
0
$0
Aggregated Statistics For Year 2006 (Based on 2 partial tracts)
A) FHA, FSA/RHS & VA Home Purchase Loans
B) Conventional Home Purchase Loans
C) Refinancings
D) Home Improvement Loans
F) Non-occupant Loans on < 5 Family Dwellings (A B C & D)
G) Loans On Manufactured Home Dwelling (A B C & D)
Number
Average Value
Number
Average Value
Number
Average Value
Number
Average Value
Number
Average Value
Number
Average Value
LOANS ORIGINATED
2
$71,915
12
$60,766
16
$84,214
4
$31,050
3
$67,273
8
$50,398
APPLICATIONS APPROVED, NOT ACCEPTED
0
$0
5
$43,742
1
$84,470
0
$0
0
$0
5
$38,810
APPLICATIONS DENIED
0
$0
7
$73,447
12
$82,835
4
$22,030
2
$100,910
5
$58,902
APPLICATIONS WITHDRAWN
1
$70,770
1
$63,470
5
$71,230
1
$57,990
0
$0
1
$82,190
FILES CLOSED FOR INCOMPLETENESS
0
$0
0
$0
1
$52,050
0
$0
0
$0
0
$0
Aggregated Statistics For Year 2005 (Based on 2 partial tracts)
A) FHA, FSA/RHS & VA Home Purchase Loans
B) Conventional Home Purchase Loans
C) Refinancings
D) Home Improvement Loans
F) Non-occupant Loans on < 5 Family Dwellings (A B C & D)
G) Loans On Manufactured Home Dwelling (A B C & D)
Number
Average Value
Number
Average Value
Number
Average Value
Number
Average Value
Number
Average Value
Number
Average Value
LOANS ORIGINATED
2
$73,055
18
$67,856
20
$60,180
4
$35,388
3
$30,287
10
$46,482
APPLICATIONS APPROVED, NOT ACCEPTED
0
$0
3
$46,573
1
$156,160
0
$0
0
$0
1
$52,050
APPLICATIONS DENIED
1
$101,370
10
$57,258
17
$77,299
3
$15,980
1
$73,060
7
$49,704
APPLICATIONS WITHDRAWN
1
$58,900
4
$68,032
7
$90,603
1
$136,980
0
$0
0
$0
FILES CLOSED FOR INCOMPLETENESS
0
$0
1
$68,950
1
$73,970
1
$79,450
0
$0
0
$0
Aggregated Statistics For Year 2004 (Based on 2 partial tracts)
A) FHA, FSA/RHS & VA Home Purchase Loans
B) Conventional Home Purchase Loans
C) Refinancings
D) Home Improvement Loans
F) Non-occupant Loans on < 5 Family Dwellings (A B C & D)
G) Loans On Manufactured Home Dwelling (A B C & D)
Detailed PMIC statistics for the following Tracts:9812.00
2003 - 2018 National Fire Incident Reporting System (NFIRS) incidents
Based on the data from the years 2003 - 2018 the average number of fires per year is 47. The highest number of fires - 102 took place in 2006, and the least - 8 in 2003. The data has an increasing trend.
When looking into fire subcategories, the most incidents belonged to: Outside Fires (76.0%), and Structure Fires (14.6%).
Fire incident types reported to NFIRS in Zip Code 74059


 Nearest zip codes: 74074, 74875, 74078, 74832, 74062, 73027.
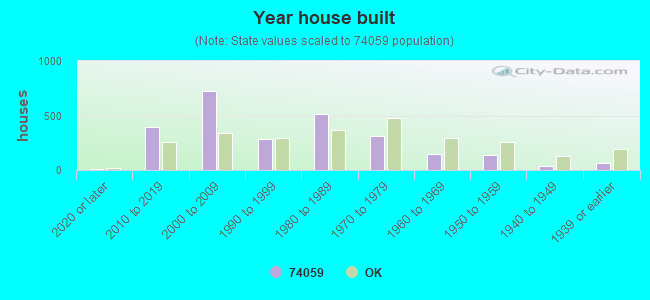


 Based on the data from the years 2003 - 2018 the average number of fires per year is 47. The highest number of fires - 102 took place in 2006, and the least - 8 in 2003. The data has an increasing trend.
 When looking into fire subcategories, the most incidents belonged to: Outside Fires (76.0%), and Structure Fires (14.6%).