Estimated zip code population in 2022: 408 Zip code population in 2010: 628 Zip code population in 2000: 678
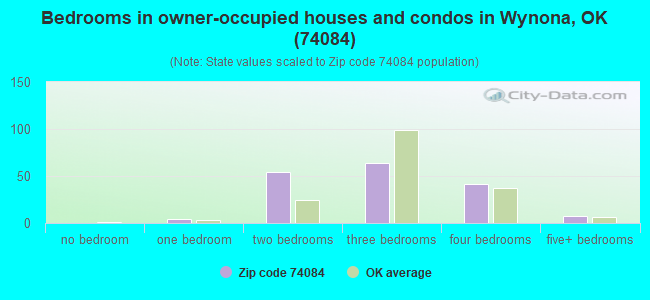
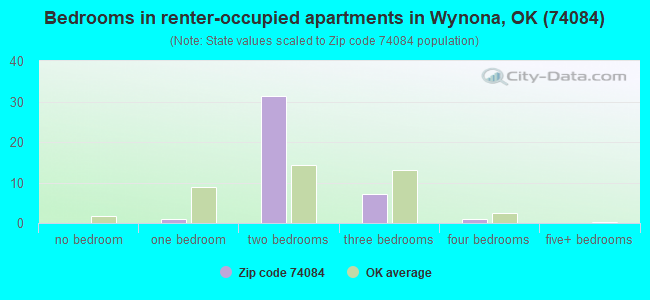
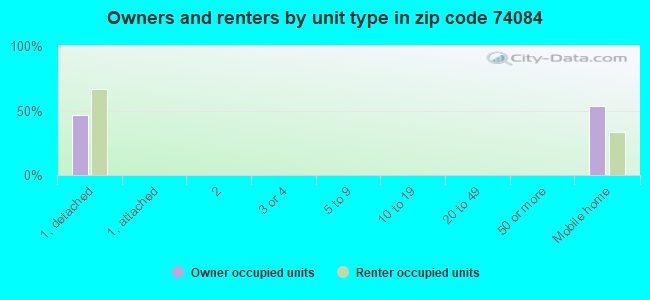
Houses and condos: 256 Renter-occupied apartments: 40
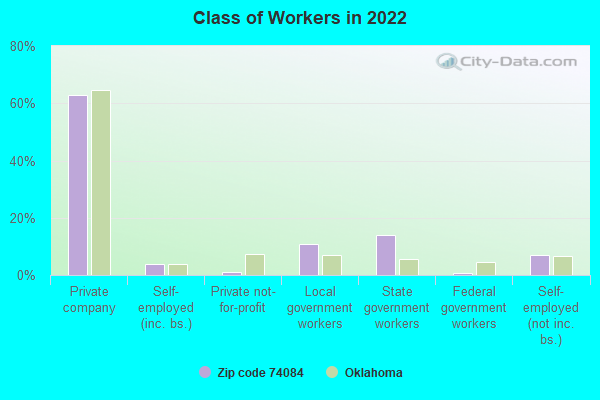
% of renters here:
19%
State:
35%
March 2022 cost of living index in zip code 74084: 77.4 (low, U.S. average is 100)
Land area: 60.8 sq. mi. Water area: 0.0 sq. mi.
Population density: 7 people per square mile
(very low).
OSM Map
General Map
Google Map
MSN Map
OSM Map
General Map
Google Map
MSN Map
OSM Map
General Map
Google Map
MSN Map
OSM Map
General Map
Google Map
MSN Map
Please wait while loading the map...
Real estate property taxes paid for housing units in 2022:
This zip code:
0.8% ($353)
Oklahoma:
0.8% ($1,501)
Median real estate property taxes paid for housing units with mortgages in 2022: $672 (0.3%) Median real estate property taxes paid for housing units with no mortgage in 2022: $273 (0.2%)
Business Search- 14 Million verified businesses
Males: 219
(53.8%)
Females: 188
(46.2%)
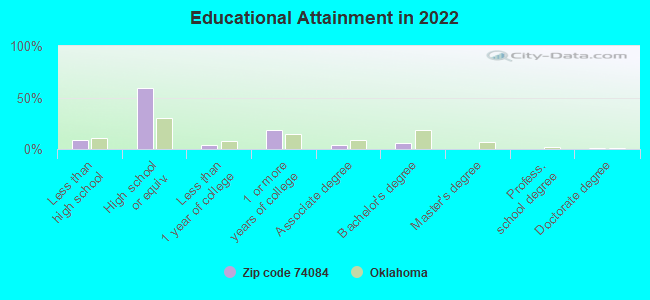
For population 25 years and over in 74084:
High school or higher: 87.8%
Bachelor's degree or higher: 6.6%
Graduate or professional degree: 0.6%
Unemployed: 5.8%
Mean travel time to work (commute): 24.8 minutes
For population 15 years and over in 74084:
Never married: 14.4%
Now married: 48.8%
Separated: 1.6%
Widowed: 10.9%
Divorced: 24.3%
Zip code 74084 compared to state average:
Median household income below state average.
Median house value significantly below state average.
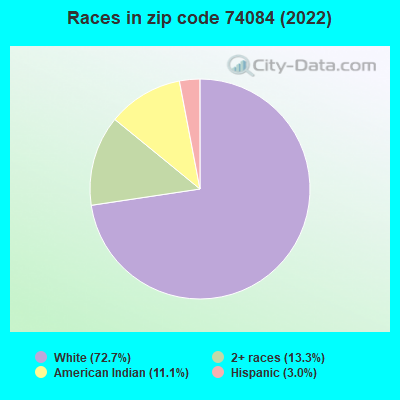
Black race population percentage significantly below state average.
Hispanic race population percentage significantly below state average.
Median age significantly above state average.
Foreign-born population percentage significantly below state average.
Renting percentage below state average.
Length of stay since moving in significantly above state average.
Percentage of population with a bachelor's degree or higher significantly below state average.
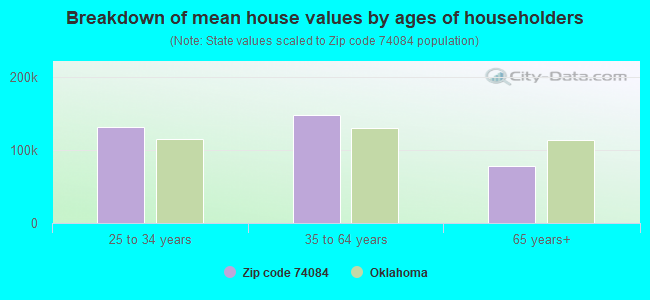
Estimated median house/condo value in 2022: $46,885
74084:
$46,885
Oklahoma:
$191,700
Median resident age:
This zip code:
62.7 years
Oklahoma median age:
37.1 years
Average household size:
This zip code:
1.9 people
Oklahoma:
2.5 people
Averages for the 2020 tax year for zip code 74084, filed in 2021:
Average Adjusted Gross Income (AGI) in 2020: $43,955 (Individual Income Tax Returns)
Here:
$43,955
State:
$63,060
Salary/wage: $37,388 (reported on 80.0% of returns)
Here:
$37,388
State:
$52,427
(% of AGI for various income ranges: 941.7% for AGIs below $25k, 3700.0% for AGIs $25k-50k, 4570.0% for AGIs $50k-75k)
Taxable interest for individuals: $925 (reported on 20.0% of returns)
This zip code:
$925
Oklahoma:
$1,603
(% of AGI for various income ranges: 56.7% for AGIs below $25k, 7.5% for AGIs $50k-75k)
Profit/loss from business: +$6,633 (reported on 15.0% of returns)
Here:
+$6,633
State:
+$9,904
(% of AGI for various income ranges: 331.7% for AGIs below $25k)
Earned income credit: $2,450 (reported on 20.0% of returns)
Here:
$2,450
State:
$2,435
(% of AGI for various income ranges: 196.0% for AGIs $25k-50k)
Percentage of individuals using paid preparers for their 2020 taxes: 95.0%
Here:
95%
State:
94%
(% for various income ranges: 100.0% for AGIs below $25k, 100.0% for AGIs $25k-50k, 75.0% for AGIs $50k-75k, 100.0% for AGIs $75k-100k)
Averages for the 2012 tax year for zip code 74084, filed in 2013:
Average Adjusted Gross Income (AGI) in 2012: $43,261 (Individual Income Tax Returns)
Here:
$43,261
State:
$58,581
Salary/wage: $37,700 (reported on 82.6% of returns)
Here:
$37,700
State:
$45,973
(% of AGI for various income ranges: 65.7% for AGIs below $25k, 79.3% for AGIs $25k-50k, 87.5% for AGIs $50k-75k, 59.7% for AGIs $75k-100k)
Taxable interest for individuals: $467 (reported on 26.1% of returns)
This zip code:
$467
Oklahoma:
$1,625
Profit/loss from business: +$10,375 (reported on 17.4% of returns)
Here:
+$10,375
State:
+$11,913
Total itemized deductions: $20,700 (32% of AGI, reported on 17.4% of returns)
Here:
$20,700
State:
$24,882
Here:
31.7% of AGI
State:
18.8% of AGI
Taxes paid: $2,850 (reported on 17.4% of returns)
74084:
$2,850
State:
$7,196
Earned income credit: $2,375 (reported on 17.4% of returns)
Here:
$2,375
State:
$2,354
(% of AGI for various income ranges: 8.0% for AGIs below $25k)
Percentage of individuals using paid preparers for their 2012 taxes: 69.6%
Here:
70%
State:
56%
(% for various income ranges: 66.7% for AGIs below $25k, 66.7% for AGIs $25k-50k, 75.0% for AGIs $50k-75k, 75.0% for AGIs $75k-100k)
Averages for the 2004 tax year for zip code 74084, filed in 2005:
Average Adjusted Gross Income (AGI) in 2004: $27,621 (Individual Income Tax Returns)
Here:
$27,621
State:
$41,245
Salary/wage: $27,748 (reported on 86.6% of returns)
Here:
$27,748
State:
$35,318
(% of AGI for various income ranges: 97.5% for AGIs below $10k, 86.9% for AGIs $10k-25k, 92.5% for AGIs $25k-50k, 88.5% for AGIs $50k-75k, 73.6% for AGIs $75k-100k)
Taxable interest for individuals: $962 (reported on 30.3% of returns)
This zip code:
$962
Oklahoma:
$1,745
(% of AGI for various income ranges: 2.9% for AGIs below $10k, 3.1% for AGIs $10k-25k, 0.8% for AGIs $25k-50k, 0.2% for AGIs $50k-75k)
Taxable dividends: $59 (reported on 6.5% of returns)
Here:
$59
State:
$2,920
Total itemized deductions: $13,043 (24% of AGI, reported on 17.6% of returns)
Here:
$13,043
State:
$17,093
Here:
24.1% of AGI
State:
20.5% of AGI
Charity contributions deductions: $2,231 (5% of AGI, reported on 10.0% of returns)
Here:
$2,231
State:
$4,240
Here:
4.7% of AGI
State:
4.8% of AGI
Total tax: $3,024 (reported on 63.2% of returns)
74084:
$3,024
State:
$6,542
(% of AGI for various income ranges: 1.2% for AGIs below $10k, 4.2% for AGIs $10k-25k, 5.8% for AGIs $25k-50k, 8.4% for AGIs $50k-75k, 11.2% for AGIs $75k-100k)
Earned income credit: $1,970 (reported on 25.3% of returns)
Here:
$1,970
State:
$1,830
Percentage of individuals using paid preparers for their 2004 taxes: 69.3%
Here:
69%
State:
63%
(% for various income ranges: 60.6% for AGIs below $10k, 70.2% for AGIs $10k-25k, 73.0% for AGIs $25k-50k, 66.7% for AGIs $50k-75k, 92.3% for AGIs $75k-100k)
Household received Food Stamps/SNAP in the past 12 months: 29 Household did not receive Food Stamps/SNAP in the past 12 months: 183
Women who had a birth in the past 12 months: 7 (4 now married, 2 unmarried) Women who did not have a birth in the past 12 months: 57 (29 now married, 27 unmarried)
Housing units in zip code 74084 with a mortgage: 40 Median monthly owner costs for units with a mortgage: $931 Median monthly owner costs for units without a mortgage: $305
Residents with income below the poverty level in 2022:
This zip code:
7.9%
Whole state:
15.7%
Residents with income below 50% of the poverty level in 2022:
This zip code:
4.8%
Whole state:
8.3%
Median number of rooms in houses and condos:
Here:
5.4
State:
6.1
Median number of rooms in apartments:
Here:
4.8
State:
4.5
Notable locations in this zip code not listed on our city pages
Size of family households: 46 2-persons, 16 3-persons, 7 4-persons, 15 5-persons
Size of nonfamily households: 115 1-person, 11 2-persons
34 married couples with children.
4 single-parent households (4 women).
99.7% of residents of 74084 zip code speak English at home.
0.8% of residents speak Spanish at home (33% very well, 67% well).
0.3% of residents speak other language at home (100% very well).
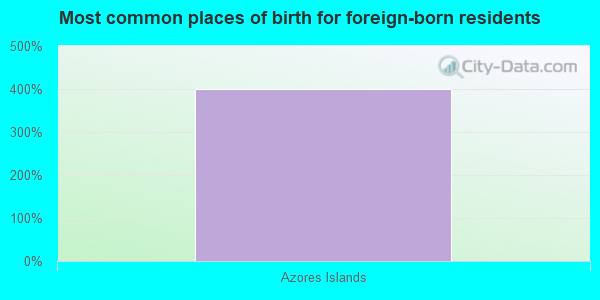
Foreign born population: 1 (0.5%) (100.0% of them are naturalized citizens)
This zip code:
0.5%
Whole state:
6.0%
400%Azores Islands
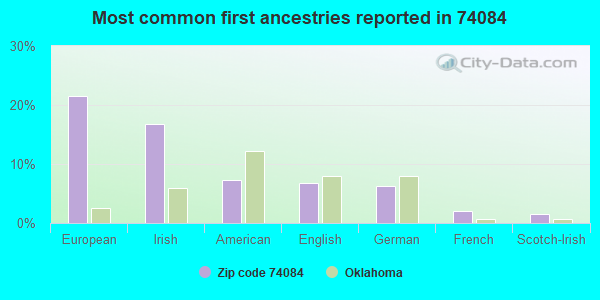
21%European
17%Irish
7%American
7%English
6%German
2%French
2%Scotch-Irish
Year of entry for the foreign-born population
02010 or later
02000 to 2009
01990 to 1999
2Before 1990
Facilities with environmental interests located in this zip code:
CARNES CRUDE OIL RECLAIMING IND (1/2 N OF WYNONA in WYNONA, OK) . Tribal Land
(Integrated Compliance Information System) - ICIS-06-1998-0904, FORMAL ENFORCEMENT ACTION Business SIC classification: CRUDE PETROLEUM AND NATURAL GAS
GILBERT SPENCER (PO BOX 253 in WYNONA, OK)
(Integrated Compliance Information System) - ICIS-06-2002-1121, FORMAL ENFORCEMENT ACTION, ICIS-06-2002-1128, Business SIC classification: CRUDE PETROLEUM AND NATURAL GAS
Housing units lacking complete plumbing facilities: 14.2% Housing units lacking complete kitchen facilities: 9.9%
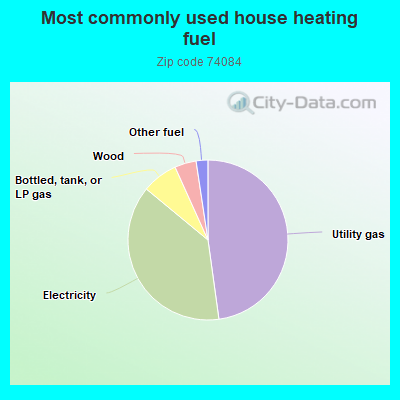
48.2%Utility gas
38.5%Electricity
7.3%Bottled, tank, or LP gas
4.4%Wood
2.4%Other fuel
Population in 1990: 1,815.
Place of birth for U.S.-born residents:
This state: 286
Northeast: 6
Midwest: 42
South: 34
West: 35
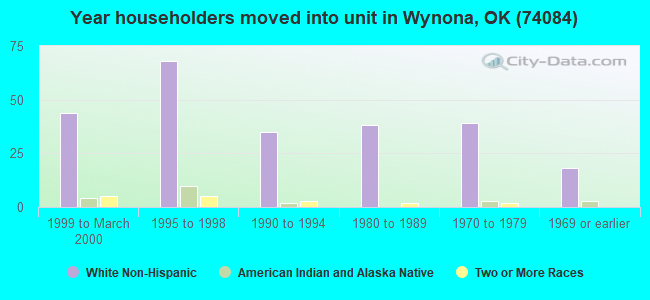
63% of the 74084 zip code residents lived in the same house 5 years ago. Out of people who lived in different houses, 59% lived in this county. Out of people who lived in different counties, 50% lived in Oklahoma.
95% of the 74084 zip code residents lived in the same house 1 year ago. Out of people who lived in different houses, 62% moved from this county. Out of people who lived in different houses, 44% moved from different county within same state.
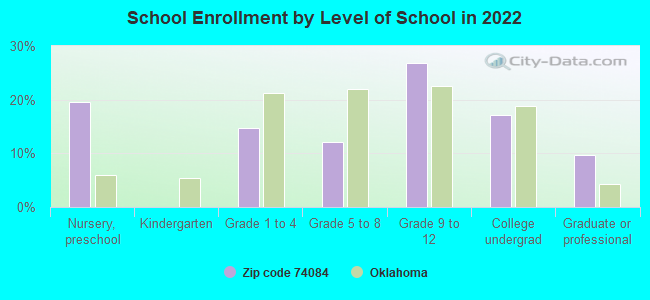
Private vs. public school enrollment:
Students in private schools in grades 1 to 8 (elementary and middle school):
Here:
0.0%
Oklahoma:
11.7%
Students in private schools in grades 9 to 12 (high school): 1
Here:
8.8%
Oklahoma:
11.7%
Students in private undergraduate colleges:
Here:
0.0%
Oklahoma:
19.3%
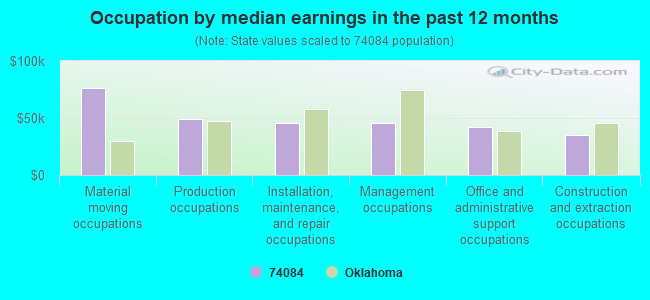
Occupation by median earnings in the past 12 months ($)
76,409Material moving occupations
49,250Production occupations
45,644Installation, maintenance, and repair occupations
45,603Management occupations
42,049Office and administrative support occupations
35,304Construction and extraction occupations
Top industries in this zip code by the number of employees in 2005:
Accommodation and Food Services: Full-Service Restaurants (10-19 employees: 1 establishment)
Mining: Support Activities for Oil and Gas Operations (5-9: 1, 1-4: 1)
Health Care and Social Assistance: Child Day Care Services (5-9: 1)
Mining: Crude Petroleum and Natural Gas Extraction (1-4: 1)
Construction: Site Preparation Contractors (1-4: 1)
Administrative and Support and Waste Management and Remediation Services: All Other Support Services (1-4: 1)
Construction: Water and Sewer Line and Related Structures Construction (1-4: 1)
Fatal accident statistics in 2011:
Fatal accident count: 1
Vehicles involved in fatal accidents: 3
Fatal accidents caused by drunken drivers: 0
Fatalities: 2
Persons involved in fatal accidents: 3
Pedestrians involved in fatal accidents: 2
Fatal accident statistics in 2010:
Fatal accident count: 1
Vehicles involved in fatal accidents: 2
Fatal accidents caused by drunken drivers: 0
Fatalities: 2
Persons involved in fatal accidents: 2
Pedestrians involved in fatal accidents: 0
Home Mortgage Disclosure Act Aggregated Statistics For Year 2009 (Based on 2 partial tracts)
A) FHA, FSA/RHS & VA Home Purchase Loans
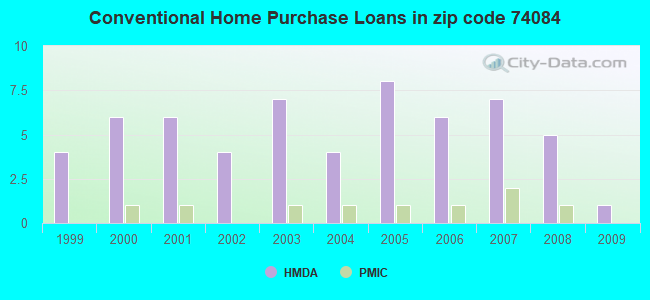
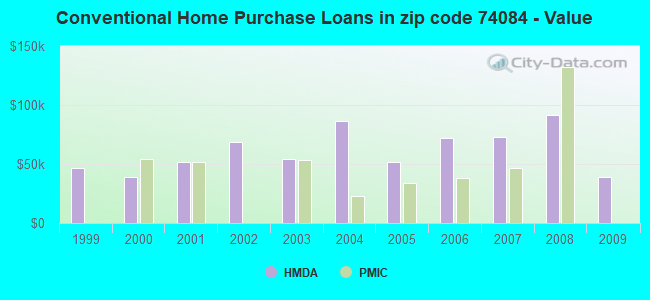
B) Conventional Home Purchase Loans
C) Refinancings
D) Home Improvement Loans
F) Non-occupant Loans on < 5 Family Dwellings (A B C & D)
G) Loans On Manufactured Home Dwelling (A B C & D)
Number
Average Value
Number
Average Value
Number
Average Value
Number
Average Value
Number
Average Value
Number
Average Value
LOANS ORIGINATED
3
$62,307
1
$38,830
6
$78,912
2
$43,385
1
$12,850
2
$55,435
APPLICATIONS APPROVED, NOT ACCEPTED
0
$0
0
$0
1
$43,920
0
$0
0
$0
1
$37,220
APPLICATIONS DENIED
1
$68,020
2
$29,860
4
$140,730
2
$64,140
1
$22,230
2
$60,525
APPLICATIONS WITHDRAWN
0
$0
1
$63,470
2
$213,570
0
$0
0
$0
0
$0
FILES CLOSED FOR INCOMPLETENESS
0
$0
0
$0
0
$0
0
$0
0
$0
0
$0
Aggregated Statistics For Year 2008 (Based on 2 partial tracts)
A) FHA, FSA/RHS & VA Home Purchase Loans
B) Conventional Home Purchase Loans
C) Refinancings
D) Home Improvement Loans
G) Loans On Manufactured Home Dwelling (A B C & D)
Number
Average Value
Number
Average Value
Number
Average Value
Number
Average Value
Number
Average Value
LOANS ORIGINATED
1
$53,830
5
$91,802
5
$150,450
2
$23,835
2
$70,835
APPLICATIONS APPROVED, NOT ACCEPTED
1
$50,880
0
$0
1
$22,230
0
$0
0
$0
APPLICATIONS DENIED
1
$116,760
3
$85,340
7
$95,796
2
$54,900
4
$72,842
APPLICATIONS WITHDRAWN
0
$0
1
$27,050
1
$68,290
0
$0
0
$0
FILES CLOSED FOR INCOMPLETENESS
0
$0
0
$0
0
$0
0
$0
0
$0
Aggregated Statistics For Year 2007 (Based on 2 partial tracts)
A) FHA, FSA/RHS & VA Home Purchase Loans
B) Conventional Home Purchase Loans
C) Refinancings
D) Home Improvement Loans
F) Non-occupant Loans on < 5 Family Dwellings (A B C & D)
G) Loans On Manufactured Home Dwelling (A B C & D)
Number
Average Value
Number
Average Value
Number
Average Value
Number
Average Value
Number
Average Value
Number
Average Value
LOANS ORIGINATED
1
$91,050
7
$72,841
5
$95,766
2
$36,690
0
$0
3
$53,293
APPLICATIONS APPROVED, NOT ACCEPTED
0
$0
1
$23,300
0
$0
0
$0
0
$0
0
$0
APPLICATIONS DENIED
0
$0
3
$67,397
6
$94,667
2
$36,020
1
$10,980
4
$52,758
APPLICATIONS WITHDRAWN
0
$0
1
$65,340
4
$81,680
0
$0
0
$0
1
$39,100
FILES CLOSED FOR INCOMPLETENESS
0
$0
0
$0
1
$144,340
0
$0
0
$0
0
$0
Aggregated Statistics For Year 2006 (Based on 2 partial tracts)
A) FHA, FSA/RHS & VA Home Purchase Loans
B) Conventional Home Purchase Loans
C) Refinancings
D) Home Improvement Loans
F) Non-occupant Loans on < 5 Family Dwellings (A B C & D)
G) Loans On Manufactured Home Dwelling (A B C & D)
Number
Average Value
Number
Average Value
Number
Average Value
Number
Average Value
Number
Average Value
Number
Average Value
LOANS ORIGINATED
2
$85,695
6
$71,860
7
$129,233
2
$36,020
1
$66,950
3
$69,183
APPLICATIONS APPROVED, NOT ACCEPTED
0
$0
1
$45,790
1
$29,460
0
$0
0
$0
1
$45,790
APPLICATIONS DENIED
1
$70,970
5
$78,198
6
$75,520
3
$21,333
1
$60,260
4
$65,945
APPLICATIONS WITHDRAWN
0
$0
2
$96,275
3
$96,587
0
$0
0
$0
0
$0
FILES CLOSED FOR INCOMPLETENESS
0
$0
0
$0
0
$0
0
$0
0
$0
0
$0
Aggregated Statistics For Year 2005 (Based on 2 partial tracts)
A) FHA, FSA/RHS & VA Home Purchase Loans
B) Conventional Home Purchase Loans
C) Refinancings
D) Home Improvement Loans
F) Non-occupant Loans on < 5 Family Dwellings (A B C & D)
G) Loans On Manufactured Home Dwelling (A B C & D)
Number
Average Value
Number
Average Value
Number
Average Value
Number
Average Value
Number
Average Value
Number
Average Value
LOANS ORIGINATED
1
$88,370
8
$51,954
7
$96,179
2
$12,585
2
$26,780
3
$76,770
APPLICATIONS APPROVED, NOT ACCEPTED
0
$0
2
$67,350
1
$38,300
1
$4,280
0
$0
2
$58,380
APPLICATIONS DENIED
1
$30,800
5
$58,594
12
$76,636
2
$24,905
1
$10,710
7
$45,450
APPLICATIONS WITHDRAWN
0
$0
2
$31,335
4
$76,725
1
$46,600
0
$0
1
$38,030
FILES CLOSED FOR INCOMPLETENESS
0
$0
1
$61,860
1
$74,980
0
$0
0
$0
0
$0
Aggregated Statistics For Year 2004 (Based on 2 partial tracts)
A) FHA, FSA/RHS & VA Home Purchase Loans
B) Conventional Home Purchase Loans
C) Refinancings
D) Home Improvement Loans
F) Non-occupant Loans on < 5 Family Dwellings (A B C & D)
G) Loans On Manufactured Home Dwelling (A B C & D)
Number
Average Value
Number
Average Value
Number
Average Value
Number
Average Value
Number
Average Value
Number
Average Value
LOANS ORIGINATED
1
$88,910
4
$86,165
8
$82,114
3
$17,587
0
$0
3
$69,540
APPLICATIONS APPROVED, NOT ACCEPTED
0
$0
1
$36,420
1
$29,460
0
$0
0
$0
1
$36,420
APPLICATIONS DENIED
0
$0
3
$42,043
9
$57,369
2
$48,605
1
$17,940
2
$38,030
APPLICATIONS WITHDRAWN
0
$0
2
$69,225
2
$56,640
2
$25,710
0
$0
0
$0
FILES CLOSED FOR INCOMPLETENESS
0
$0
0
$0
1
$129,080
0
$0
0
$0
0
$0
Aggregated Statistics For Year 2003 (Based on 2 partial tracts)
A) FHA, FSA/RHS & VA Home Purchase Loans
B) Conventional Home Purchase Loans
C) Refinancings
D) Home Improvement Loans
F) Non-occupant Loans on < 5 Family Dwellings (A B C & D)
Number
Average Value
Number
Average Value
Number
Average Value
Number
Average Value
Number
Average Value
LOANS ORIGINATED
1
$47,670
7
$54,593
13
$74,634
2
$28,520
1
$6,960
APPLICATIONS APPROVED, NOT ACCEPTED
1
$31,330
1
$60,260
2
$74,045
0
$0
0
$0
APPLICATIONS DENIED
0
$0
7
$55,511
7
$61,670
2
$9,240
1
$41,780
APPLICATIONS WITHDRAWN
1
$50,880
1
$29,460
4
$96,542
0
$0
0
$0
FILES CLOSED FOR INCOMPLETENESS
0
$0
1
$12,590
0
$0
0
$0
0
$0
Aggregated Statistics For Year 2002 (Based on 2 partial tracts)
A) FHA, FSA/RHS & VA Home Purchase Loans
B) Conventional Home Purchase Loans
C) Refinancings
D) Home Improvement Loans
Number
Average Value
Number
Average Value
Number
Average Value
Number
Average Value
LOANS ORIGINATED
1
$28,650
4
$68,892
12
$73,154
3
$31,153
APPLICATIONS APPROVED, NOT ACCEPTED
0
$0
1
$32,400
1
$44,450
1
$21,420
APPLICATIONS DENIED
0
$0
3
$52,847
5
$48,740
1
$11,250
APPLICATIONS WITHDRAWN
0
$0
0
$0
6
$48,383
1
$2,950
FILES CLOSED FOR INCOMPLETENESS
0
$0
0
$0
1
$59,990
0
$0
Aggregated Statistics For Year 2001 (Based on 2 partial tracts)
A) FHA, FSA/RHS & VA Home Purchase Loans
B) Conventional Home Purchase Loans
C) Refinancings
D) Home Improvement Loans
F) Non-occupant Loans on < 5 Family Dwellings (A B C & D)
Number
Average Value
Number
Average Value
Number
Average Value
Number
Average Value
Number
Average Value
LOANS ORIGINATED
1
$91,590
6
$51,998
6
$71,323
1
$16,340
1
$13,390
APPLICATIONS APPROVED, NOT ACCEPTED
0
$0
1
$44,720
1
$43,120
0
$0
0
$0
APPLICATIONS DENIED
0
$0
5
$47,080
5
$71,182
2
$10,445
0
$0
APPLICATIONS WITHDRAWN
0
$0
1
$35,620
3
$59,450
1
$4,820
0
$0
FILES CLOSED FOR INCOMPLETENESS
0
$0
0
$0
0
$0
0
$0
0
$0
Aggregated Statistics For Year 2000 (Based on 2 partial tracts)
A) FHA, FSA/RHS & VA Home Purchase Loans
B) Conventional Home Purchase Loans
C) Refinancings
D) Home Improvement Loans
F) Non-occupant Loans on < 5 Family Dwellings (A B C & D)
Number
Average Value
Number
Average Value
Number
Average Value
Number
Average Value
Number
Average Value
LOANS ORIGINATED
1
$71,770
6
$39,277
4
$48,808
2
$15,400
1
$17,940
APPLICATIONS APPROVED, NOT ACCEPTED
0
$0
1
$62,400
1
$59,720
0
$0
0
$0
APPLICATIONS DENIED
1
$34,810
4
$48,405
4
$71,905
2
$29,460
0
$0
APPLICATIONS WITHDRAWN
0
$0
1
$28,920
2
$36,690
0
$0
0
$0
FILES CLOSED FOR INCOMPLETENESS
0
$0
0
$0
0
$0
0
$0
0
$0
Aggregated Statistics For Year 1999 (Based on 1 partial tract)

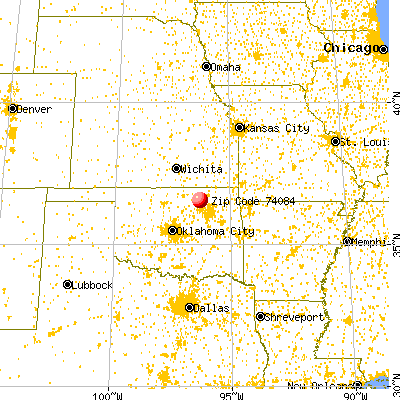


 Nearest zip codes: 74035, 74002, 74054, 74056, 74001, 74060.


 . Tribal Land