Estimated zip code population in 2022: 1,021 Zip code population in 2010: 824 Zip code population in 2000: 816
Houses and condos: 487 Renter-occupied apartments: 58
% of renters here:
14%
State:
35%
March 2022 cost of living index in zip code 74422: 80.3 (low, U.S. average is 100)
Land area: 65.3 sq. mi. Water area: 0.8 sq. mi.
Population density: 16 people per square mile
(very low).
OSM Map
General Map
Google Map
MSN Map
OSM Map
General Map
Google Map
MSN Map
OSM Map
General Map
Google Map
MSN Map
OSM Map
General Map
Google Map
MSN Map
Please wait while loading the map...
Real estate property taxes paid for housing units in 2022:
This zip code:
0.5% ($731)
Oklahoma:
0.8% ($1,501)
Median real estate property taxes paid for housing units with mortgages in 2022: $997 (1.0%) Median real estate property taxes paid for housing units with no mortgage in 2022: $582 (0.4%)
Business Search- 14 Million verified businesses
Males: 481
(47.2%)
Females: 539
(52.8%)
For population 25 years and over in 74422:
High school or higher: 96.7%
Bachelor's degree or higher: 37.3%
Graduate or professional degree: 9.1%
Unemployed: 3.2%
Mean travel time to work (commute): 28.5 minutes
For population 15 years and over in 74422:
Never married: 21.9%
Now married: 61.1%
Separated: 5.1%
Widowed: 4.7%
Divorced: 7.2%
Zip code 74422 compared to state average:
Black race population percentage significantly above state average.
Hispanic race population percentage significantly below state average.
Median age significantly above state average.
Foreign-born population percentage significantly below state average.
Renting percentage significantly below state average.
Length of stay since moving in significantly above state average.
Averages for the 2020 tax year for zip code 74422, filed in 2021:
Average Adjusted Gross Income (AGI) in 2020: $55,045 (Individual Income Tax Returns)
Here:
$55,045
State:
$63,060
Salary/wage: $52,421 (reported on 77.4% of returns)
Here:
$52,421
State:
$52,427
(% of AGI for various income ranges: 1141.2% for AGIs below $25k, 3816.2% for AGIs $25k-50k, 4246.0% for AGIs $50k-75k, 22355.0% for AGIs $100k-200k)
Taxable interest for individuals: $229 (reported on 22.6% of returns)
This zip code:
$229
Oklahoma:
$1,603
(% of AGI for various income ranges: 15.0% for AGIs below $25k, 8.0% for AGIs $50k-75k)
Ordinary dividends: $1,933 (reported on 9.7% of returns)
Here:
$1,933
State:
$7,001
(% of AGI for various income ranges: 72.5% for AGIs below $25k)
Net capital gain/loss in AGI: +$7,733 (reported on 9.7% of returns)
Here:
+$7,733
State:
+$19,855
(% of AGI for various income ranges: 290.0% for AGIs $25k-50k)
Profit/loss from business: +$6,675 (reported on 12.9% of returns)
Here:
+$6,675
State:
+$9,904
(% of AGI for various income ranges: 333.8% for AGIs $25k-50k)
Total itemized deductions: $39,850 (reported on 6.5% of returns)
Here:
$39,850
State:
$39,736
(% of AGI for various income ranges: 1594.0% for AGIs $50k-75k)
Taxes paid: $6,200 (reported on 6.5% of returns)
74422:
$6,200
State:
$7,046
(% of AGI for various income ranges: 155.0% for AGIs $25k-50k)
Earned income credit: $3,117 (reported on 19.4% of returns)
Here:
$3,117
State:
$2,435
(% of AGI for various income ranges: 132.5% for AGIs below $25k, 101.2% for AGIs $25k-50k)
Percentage of individuals using paid preparers for their 2020 taxes: 87.1%
Here:
87%
State:
94%
(% for various income ranges: 90.0% for AGIs below $25k, 90.0% for AGIs $25k-50k, 100.0% for AGIs $50k-75k, 66.7% for AGIs $75k-100k, 75.0% for AGIs $100k-200k)
Averages for the 2012 tax year for zip code 74422, filed in 2013:
Average Adjusted Gross Income (AGI) in 2012: $42,986 (Individual Income Tax Returns)
Here:
$42,986
State:
$58,581
Salary/wage: $41,242 (reported on 82.8% of returns)
Here:
$41,242
State:
$45,973
(% of AGI for various income ranges: 90.7% for AGIs below $25k, 80.1% for AGIs $25k-50k, 148.6% for AGIs $50k-75k, 69.1% for AGIs $100k-200k)
Taxable interest for individuals: $200 (reported on 17.2% of returns)
This zip code:
$200
Oklahoma:
$1,625
Net capital gain/loss in AGI: +$6,450 (reported on 6.9% of returns)
Here:
+$6,450
State:
+$24,023
Profit/loss from business: +$4,667 (reported on 10.3% of returns)
Here:
+$4,667
State:
+$11,913
Total itemized deductions: $25,680 (28% of AGI, reported on 17.2% of returns)
Here:
$25,680
State:
$24,882
Here:
28.5% of AGI
State:
18.8% of AGI
Charity contributions: $8,600 (reported on 13.8% of returns)
Here:
$8,600
State:
$6,591
Taxes paid: $4,720 (reported on 17.2% of returns)
74422:
$4,720
State:
$7,196
Earned income credit: $2,100 (reported on 27.6% of returns)
Here:
$2,100
State:
$2,354
(% of AGI for various income ranges: 8.7% for AGIs below $25k, 1.5% for AGIs $25k-50k)
Percentage of individuals using paid preparers for their 2012 taxes: 55.2%
Here:
55%
State:
56%
(% for various income ranges: 45.5% for AGIs below $25k, 55.6% for AGIs $25k-50k, 100.0% for AGIs $50k-75k, 66.7% for AGIs $100k-200k)
Averages for the 2004 tax year for zip code 74422, filed in 2005:
Average Adjusted Gross Income (AGI) in 2004: $28,670 (Individual Income Tax Returns)
Here:
$28,670
State:
$41,245
Salary/wage: $28,221 (reported on 85.6% of returns)
Here:
$28,221
State:
$35,318
(% of AGI for various income ranges: 89.2% for AGIs below $10k, 83.3% for AGIs $10k-25k, 102.4% for AGIs $25k-50k, 91.4% for AGIs $50k-75k, 42.8% for AGIs $75k-100k)
Taxable interest for individuals: $413 (reported on 29.5% of returns)
This zip code:
$413
Oklahoma:
$1,745
(% of AGI for various income ranges: 4.7% for AGIs below $10k, 0.8% for AGIs $10k-25k, 0.2% for AGIs $25k-50k, 0.2% for AGIs $50k-75k)
Taxable dividends: $593 (reported on 8.7% of returns)
Here:
$593
State:
$2,920
Net capital gain/loss: +$5,667 (reported on 4.8% of returns)
Here:
+$5,667
State:
+$10,653
Profit/loss from business: +$34 (reported on 9.3% of returns)
Here:
+$34
State:
+$8,532
Total itemized deductions: $14,544 (28% of AGI, reported on 21.8% of returns)
Here:
$14,544
State:
$17,093
Here:
28.2% of AGI
State:
20.5% of AGI
(% of AGI for various income ranges: 11.7% for AGIs $10k-25k, 9.3% for AGIs $25k-50k, 15.3% for AGIs $50k-75k, 10.0% for AGIs $75k-100k)
Charity contributions deductions: $4,610 (9% of AGI, reported on 18.9% of returns)
Here:
$4,610
State:
$4,240
Here:
8.8% of AGI
State:
4.8% of AGI
Total tax: $2,694 (reported on 61.9% of returns)
74422:
$2,694
State:
$6,542
(% of AGI for various income ranges: 2.2% for AGIs below $10k, 2.5% for AGIs $10k-25k, 5.1% for AGIs $25k-50k, 7.0% for AGIs $50k-75k, 10.0% for AGIs $75k-100k)
Earned income credit: $1,927 (reported on 26.3% of returns)
Here:
$1,927
State:
$1,830
Percentage of individuals using paid preparers for their 2004 taxes: 70.2%
Here:
70%
State:
63%
(% for various income ranges: 60.9% for AGIs below $10k, 71.3% for AGIs $10k-25k, 73.6% for AGIs $25k-50k, 105.9% for AGIs $50k-75k)
Household received Food Stamps/SNAP in the past 12 months: 32 Household did not receive Food Stamps/SNAP in the past 12 months: 388
Women who had a birth in the past 12 months: 2 (2 now married, 0 unmarried) Women who did not have a birth in the past 12 months: 239 (97 now married, 141 unmarried)
Housing units in zip code 74422 with a mortgage: 131 Median monthly owner costs for units with a mortgage: $1,004 Median monthly owner costs for units without a mortgage: $551
Residents with income below the poverty level in 2022:
This zip code:
7.5%
Whole state:
15.7%
Residents with income below 50% of the poverty level in 2022:
This zip code:
2.6%
Whole state:
8.3%
Median number of rooms in houses and condos:
Here:
5.9
State:
6.1
Median number of rooms in apartments:
Here:
5.5
State:
4.5
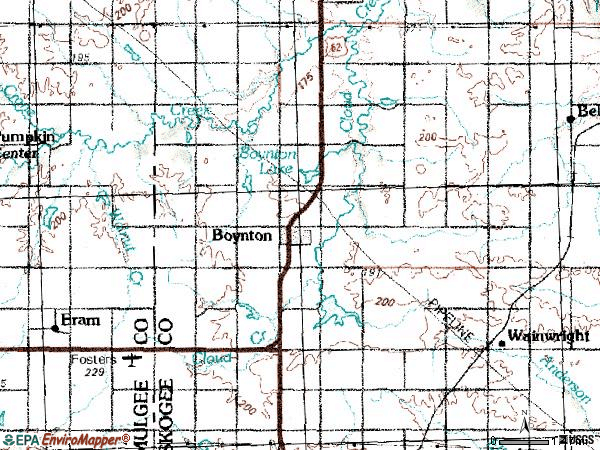
Notable locations in this zip code not listed on our city pages
Reservoirs: Boynton Lake (A), Cane Creek Site 20 Reservoir (B), Cane Creek Site 21 Reservoir (C), Cane Creek Site 22 Reservoir (D), Cane Creek Site 17 Reservoir (E), Cane Creek Site 18 Reservoir (F), Cane Creek Site 19 Reservoir (G), Cane Creek Site 5 Reservoir (H). Display/hide their locations on the map
Size of family households: 179 2-persons, 35 3-persons, 9 4-persons, 52 5-persons, 18 6-persons
Size of nonfamily households: 110 1-person, 16 2-persons
132 married couples with children.
25 single-parent households (25 women).
99.8% of residents of 74422 zip code speak English at home.
Foreign born population: 9 (1.0%) (100.0% of them are naturalized citizens)
This zip code:
1.0%
Whole state:
6.0%
89%Uruguay
30%American
20%English
2%Polish
1%Scottish
0%French
0%Irish
Year of entry for the foreign-born population
02010 or later
02000 to 2009
01990 to 1999
8Before 1990
Facilities with environmental interests located in this zip code:
BOYNTON ES (115 S. CARDINAL in BOYNTON, OK)
(National Center for Education Statistics) - STATE ID-51-I004-110
BOYNTON HS (115 S. CARDINAL in BOYNTON, OK)
(National Center for Education Statistics) - STATE ID-51-I004-705
BOYNTON PWA (PO BOX 266 in BOYNTON, OK)
STATE MASTER (Oklahoma environmental compliance activities data) National Pollutant Discharge Elimination System NON-MAJOR (Tracking pollutant discharge elimination systems) - permit Business SIC classification: SEWERAGE SYSTEMS
MARATHON REFINERY (KENEFICK ROAD in BOYNTON, OK)
SUPERFUND (Superfund database)
Housing units lacking complete plumbing facilities: 10.2% Housing units lacking complete kitchen facilities: 7.9%
58.8%Electricity
22.6%Utility gas
15.1%Bottled, tank, or LP gas
2.2%Other fuel
1.5%Wood
Population in 1990: 762. Population change in the 1990s: +54 (+7.1%).
Place of birth for U.S.-born residents:
This state: 690
Northeast: 12
Midwest: 185
South: 62
West: 59
69% of the 74422 zip code residents lived in the same house 5 years ago. Out of people who lived in different houses, 39% lived in this county. Out of people who lived in different counties, 50% lived in Oklahoma.
96% of the 74422 zip code residents lived in the same house 1 year ago. Out of people who lived in different houses, 10% moved from this county. Out of people who lived in different houses, 86% moved from different county within same state. Out of people who lived in different houses, 24% moved from different state.
Private vs. public school enrollment:
Students in private schools in grades 1 to 8 (elementary and middle school): 57
Here:
39.5%
Oklahoma:
11.7%
Students in private schools in grades 9 to 12 (high school):
Here:
0.0%
Oklahoma:
11.7%
Students in private undergraduate colleges: 17
Here:
29.7%
Oklahoma:
19.3%
Occupation by median earnings in the past 12 months ($)
85,763Fire fighting and prevention, and other protective service workers including supervisors
84,009Business and financial operations occupations
61,030Health diagnosing and treating practitioners and other technical occupations
47,476Education, training, and library occupations
41,663Management occupations
39,768Transportation occupations
Top industries in this zip code by the number of employees in 2005:
Health Care and Social Assistance: Community Food Services (1-4 employees: 1 establishment)
Construction: Commercial and Institutional Building Construction (1-4: 1)
Home Mortgage Disclosure Act Aggregated Statistics For Year 2009 (Based on 2 partial tracts)
A) FHA, FSA/RHS & VA Home Purchase Loans
B) Conventional Home Purchase Loans
C) Refinancings
D) Home Improvement Loans
F) Non-occupant Loans on < 5 Family Dwellings (A B C & D)
G) Loans On Manufactured Home Dwelling (A B C & D)
Number
Average Value
Number
Average Value
Number
Average Value
Number
Average Value
Number
Average Value
Number
Average Value
LOANS ORIGINATED
2
$121,635
5
$92,528
11
$106,957
6
$59,718
2
$43,325
2
$65,735
APPLICATIONS APPROVED, NOT ACCEPTED
0
$0
0
$0
2
$98,355
0
$0
0
$0
0
$0
APPLICATIONS DENIED
1
$180,770
4
$108,378
7
$114,327
1
$7,220
0
$0
1
$108,810
APPLICATIONS WITHDRAWN
0
$0
0
$0
2
$186,130
0
$0
0
$0
0
$0
FILES CLOSED FOR INCOMPLETENESS
0
$0
0
$0
0
$0
0
$0
0
$0
0
$0
Aggregated Statistics For Year 2008 (Based on 2 partial tracts)
A) FHA, FSA/RHS & VA Home Purchase Loans
B) Conventional Home Purchase Loans
C) Refinancings
D) Home Improvement Loans
F) Non-occupant Loans on < 5 Family Dwellings (A B C & D)
G) Loans On Manufactured Home Dwelling (A B C & D)
Number
Average Value
Number
Average Value
Number
Average Value
Number
Average Value
Number
Average Value
Number
Average Value
LOANS ORIGINATED
1
$110,060
7
$84,839
10
$107,668
3
$51,377
3
$80,260
3
$52,623
APPLICATIONS APPROVED, NOT ACCEPTED
1
$73,450
1
$29,630
1
$105,330
0
$0
0
$0
1
$41,330
APPLICATIONS DENIED
0
$0
3
$89,473
8
$91,974
1
$52,540
0
$0
2
$81,920
APPLICATIONS WITHDRAWN
0
$0
0
$0
3
$149,567
0
$0
0
$0
0
$0
FILES CLOSED FOR INCOMPLETENESS
0
$0
0
$0
0
$0
0
$0
0
$0
0
$0
Aggregated Statistics For Year 2007 (Based on 2 partial tracts)
B) Conventional Home Purchase Loans
C) Refinancings
D) Home Improvement Loans
F) Non-occupant Loans on < 5 Family Dwellings (A B C & D)
G) Loans On Manufactured Home Dwelling (A B C & D)
Number
Average Value
Number
Average Value
Number
Average Value
Number
Average Value
Number
Average Value
LOANS ORIGINATED
12
$86,133
15
$78,003
4
$47,122
5
$61,752
7
$46,811
APPLICATIONS APPROVED, NOT ACCEPTED
0
$0
2
$79,680
0
$0
0
$0
1
$76,690
APPLICATIONS DENIED
6
$130,310
9
$97,193
3
$30,710
0
$0
4
$73,020
APPLICATIONS WITHDRAWN
1
$224,350
3
$76,940
0
$0
0
$0
0
$0
FILES CLOSED FOR INCOMPLETENESS
0
$0
1
$77,940
0
$0
0
$0
0
$0
Aggregated Statistics For Year 2006 (Based on 2 partial tracts)
A) FHA, FSA/RHS & VA Home Purchase Loans
B) Conventional Home Purchase Loans
C) Refinancings
D) Home Improvement Loans
F) Non-occupant Loans on < 5 Family Dwellings (A B C & D)
G) Loans On Manufactured Home Dwelling (A B C & D)
Number
Average Value
Number
Average Value
Number
Average Value
Number
Average Value
Number
Average Value
Number
Average Value
LOANS ORIGINATED
1
$107,320
13
$81,864
11
$79,408
7
$35,359
2
$35,855
5
$44,372
APPLICATIONS APPROVED, NOT ACCEPTED
0
$0
3
$98,107
4
$74,015
0
$0
0
$0
2
$104,330
APPLICATIONS DENIED
0
$0
6
$64,948
10
$80,502
6
$60,673
0
$0
4
$62,562
APPLICATIONS WITHDRAWN
0
$0
2
$55,400
9
$100,292
1
$107,320
0
$0
1
$61,010
FILES CLOSED FOR INCOMPLETENESS
0
$0
0
$0
1
$108,070
0
$0
0
$0
0
$0
Aggregated Statistics For Year 2005 (Based on 2 partial tracts)
A) FHA, FSA/RHS & VA Home Purchase Loans
B) Conventional Home Purchase Loans
C) Refinancings
D) Home Improvement Loans
F) Non-occupant Loans on < 5 Family Dwellings (A B C & D)
G) Loans On Manufactured Home Dwelling (A B C & D)
Number
Average Value
Number
Average Value
Number
Average Value
Number
Average Value
Number
Average Value
Number
Average Value
LOANS ORIGINATED
1
$77,940
17
$71,624
13
$68,245
5
$37,002
6
$50,008
8
$42,050
APPLICATIONS APPROVED, NOT ACCEPTED
0
$0
4
$115,972
4
$74,762
0
$0
0
$0
4
$61,502
APPLICATIONS DENIED
0
$0
8
$68,350
16
$83,835
1
$64,990
1
$85,410
5
$67,030
APPLICATIONS WITHDRAWN
0
$0
2
$93,000
10
$97,235
1
$58,520
0
$0
0
$0
FILES CLOSED FOR INCOMPLETENESS
0
$0
1
$84,660
0
$0
0
$0
0
$0
0
$0
Aggregated Statistics For Year 2004 (Based on 2 partial tracts)
A) FHA, FSA/RHS & VA Home Purchase Loans
B) Conventional Home Purchase Loans
C) Refinancings
D) Home Improvement Loans
F) Non-occupant Loans on < 5 Family Dwellings (A B C & D)
G) Loans On Manufactured Home Dwelling (A B C & D)


 Nearest zip codes: 74428, 74438, 74445, 74468, 74436, 74463.