Estimated zip code population in 2022: 2,863 Zip code population in 2010: 3,226 Zip code population in 2000: 2,600
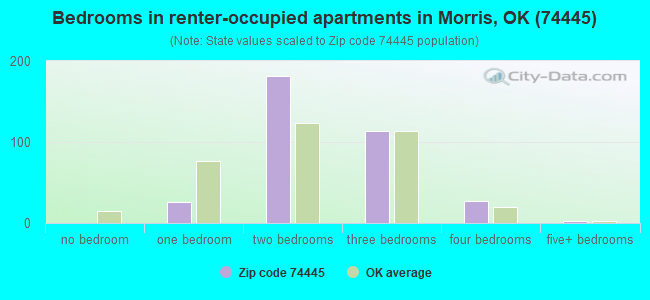
Houses and condos: 1,244 Renter-occupied apartments: 354
% of renters here:
33%
State:
35%
March 2022 cost of living index in zip code 74445: 79.4 (low, U.S. average is 100)
Land area: 82.0 sq. mi. Water area: 0.2 sq. mi.
Population density: 35 people per square mile
(very low).
OSM Map
General Map
Google Map
MSN Map
OSM Map
General Map
Google Map
MSN Map
OSM Map
General Map
Google Map
MSN Map
OSM Map
General Map
Google Map
MSN Map
Please wait while loading the map...
Real estate property taxes paid for housing units in 2022:
This zip code:
0.7% ($1,148)
Oklahoma:
0.8% ($1,501)
Median real estate property taxes paid for housing units with mortgages in 2022: $1,339 (0.7%) Median real estate property taxes paid for housing units with no mortgage in 2022: $738 (0.5%)
Business Search- 14 Million verified businesses
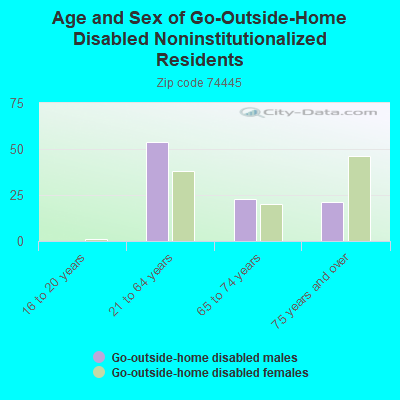
Males: 1,530
(53.4%)
Females: 1,332
(46.6%)
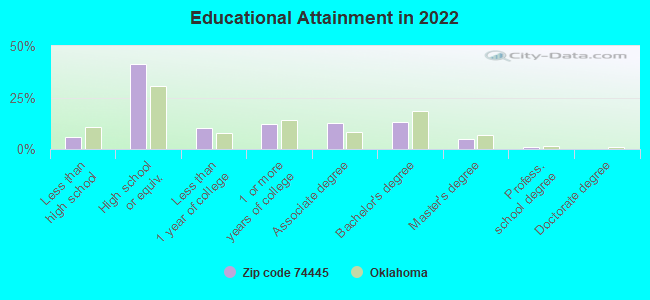
For population 25 years and over in 74445:
High school or higher: 94.0%
Bachelor's degree or higher: 18.5%
Graduate or professional degree: 5.6%
Unemployed: 5.0%
Mean travel time to work (commute): 25.2 minutes
For population 15 years and over in 74445:
Never married: 22.1%
Now married: 56.8%
Separated: 3.4%
Widowed: 4.0%
Divorced: 13.7%
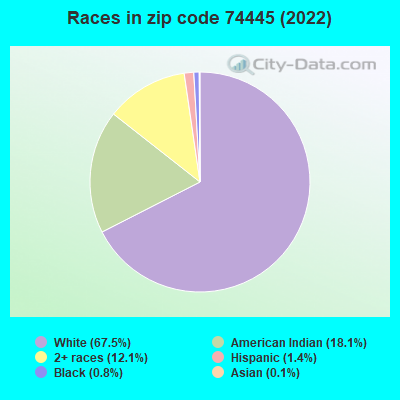
Zip code 74445 compared to state average:
Black race population percentage significantly below state average.
Hispanic race population percentage significantly below state average.
Foreign-born population percentage significantly below state average.
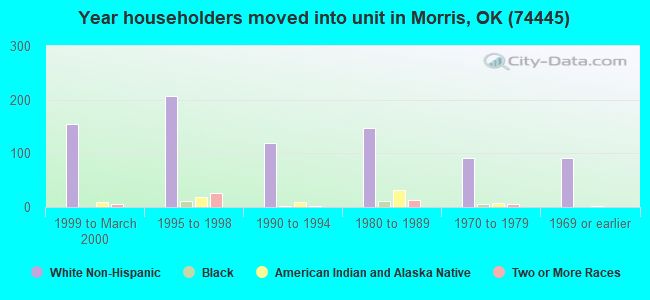
Length of stay since moving in significantly above state average.
Number of college students below state average.
Percentage of population with a bachelor's degree or higher below state average.
Averages for the 2020 tax year for zip code 74445, filed in 2021:
Average Adjusted Gross Income (AGI) in 2020: $55,345 (Individual Income Tax Returns)
Here:
$55,345
State:
$63,060
Salary/wage: $50,490 (reported on 84.9% of returns)
Here:
$50,490
State:
$52,427
(% of AGI for various income ranges: 1207.2% for AGIs below $25k, 3424.6% for AGIs $25k-50k, 7056.9% for AGIs $50k-75k, 9191.0% for AGIs $75k-100k, 18263.6% for AGIs $100k-200k)
Taxable interest for individuals: $586 (reported on 23.0% of returns)
This zip code:
$586
Oklahoma:
$1,603
(% of AGI for various income ranges: 6.6% for AGIs below $25k, 14.6% for AGIs $25k-50k, 21.2% for AGIs $50k-75k, 23.0% for AGIs $75k-100k, 46.4% for AGIs $100k-200k)
Ordinary dividends: $2,130 (reported on 7.9% of returns)
Here:
$2,130
State:
$7,001
(% of AGI for various income ranges: 22.5% for AGIs $25k-50k, 33.1% for AGIs $50k-75k, 88.2% for AGIs $100k-200k)
Net capital gain/loss in AGI: +$4,780 (reported on 7.9% of returns)
Here:
+$4,780
State:
+$19,855
(% of AGI for various income ranges: 16.2% for AGIs below $25k, 20.6% for AGIs $50k-75k, 357.3% for AGIs $100k-200k)
Profit/loss from business: +$7,313 (reported on 18.3% of returns)
Here:
+$7,313
State:
+$9,904
(% of AGI for various income ranges: 119.7% for AGIs below $25k, 57.5% for AGIs $25k-50k, 50.0% for AGIs $50k-75k, 194.0% for AGIs $75k-100k, 785.5% for AGIs $100k-200k)
Taxable individual retirement arrangement distribution: $15,500 (reported on 5.6% of returns)
74445:
$15,500
Oklahoma:
$20,476
(% of AGI for various income ranges: 139.3% for AGIs $25k-50k, 695.0% for AGIs $75k-100k)
Total itemized deductions: $31,214 (reported on 5.6% of returns)
Here:
$31,214
State:
$39,736
(% of AGI for various income ranges: 262.5% for AGIs $25k-50k, 1318.2% for AGIs $100k-200k)
Charity contributions: $11,780 (reported on 4.0% of returns)
Here:
$11,780
State:
$17,288
(% of AGI for various income ranges: 51.4% for AGIs $25k-50k, 404.5% for AGIs $100k-200k)
Taxes paid: $5,957 (reported on 5.6% of returns)
74445:
$5,957
State:
$7,046
(% of AGI for various income ranges: 46.8% for AGIs $25k-50k, 260.0% for AGIs $100k-200k)
Earned income credit: $2,472 (reported on 23.0% of returns)
Here:
$2,472
State:
$2,435
(% of AGI for various income ranges: 134.7% for AGIs below $25k, 102.1% for AGIs $25k-50k)
Percentage of individuals using paid preparers for their 2020 taxes: 92.9%
Here:
93%
State:
94%
(% for various income ranges: 95.0% for AGIs below $25k, 91.2% for AGIs $25k-50k, 95.2% for AGIs $50k-75k, 92.3% for AGIs $75k-100k, 88.9% for AGIs $100k-200k)
Averages for the 2012 tax year for zip code 74445, filed in 2013:
Average Adjusted Gross Income (AGI) in 2012: $45,492 (Individual Income Tax Returns)
Here:
$45,492
State:
$58,581
Salary/wage: $40,727 (reported on 83.3% of returns)
Here:
$40,727
State:
$45,973
(% of AGI for various income ranges: 74.3% for AGIs below $25k, 82.3% for AGIs $25k-50k, 80.6% for AGIs $50k-75k, 78.1% for AGIs $75k-100k, 63.1% for AGIs $100k-200k)
Taxable interest for individuals: $819 (reported on 21.4% of returns)
This zip code:
$819
Oklahoma:
$1,625
(% of AGI for various income ranges: 1.1% for AGIs below $25k, 0.5% for AGIs $25k-50k, 0.3% for AGIs $50k-75k, 0.2% for AGIs $75k-100k, 0.2% for AGIs $100k-200k)
Ordinary dividends: $1,242 (reported on 9.5% of returns)
Here:
$1,242
State:
$6,374
(% of AGI for various income ranges: 0.3% for AGIs below $25k, 0.2% for AGIs $25k-50k, 0.2% for AGIs $50k-75k, 0.4% for AGIs $100k-200k)
Net capital gain/loss in AGI: +$2,530 (reported on 7.9% of returns)
Here:
+$2,530
State:
+$24,023
(% of AGI for various income ranges: 0.5% for AGIs $25k-50k, 0.5% for AGIs $50k-75k, 1.8% for AGIs $75k-100k)
Profit/loss from business: +$12,214 (reported on 17.5% of returns)
Here:
+$12,214
State:
+$11,913
(% of AGI for various income ranges: 10.2% for AGIs below $25k, 3.7% for AGIs $25k-50k, 4.1% for AGIs $50k-75k, 6.0% for AGIs $100k-200k)
Taxable individual retirement arrangement distribution: $12,067 (reported on 7.1% of returns)
74445:
$12,067
Oklahoma:
$15,242
(% of AGI for various income ranges: 2.1% for AGIs below $25k, 2.6% for AGIs $25k-50k, 7.7% for AGIs $75k-100k)
Total itemized deductions: $23,159 (27% of AGI, reported on 23.0% of returns)
Here:
$23,159
State:
$24,882
Here:
26.5% of AGI
State:
18.8% of AGI
(% of AGI for various income ranges: 5.5% for AGIs below $25k, 8.6% for AGIs $25k-50k, 11.0% for AGIs $50k-75k, 10.8% for AGIs $75k-100k, 17.1% for AGIs $100k-200k)
Charity contributions: $4,886 (reported on 17.5% of returns)
Here:
$4,886
State:
$6,591
(% of AGI for various income ranges: 1.6% for AGIs $25k-50k, 1.9% for AGIs $50k-75k, 1.9% for AGIs $75k-100k, 2.6% for AGIs $100k-200k)
Taxes paid: $4,534 (reported on 23.0% of returns)
74445:
$4,534
State:
$7,196
(% of AGI for various income ranges: 0.6% for AGIs below $25k, 1.1% for AGIs $25k-50k, 1.9% for AGIs $50k-75k, 2.2% for AGIs $75k-100k, 4.1% for AGIs $100k-200k)
Earned income credit: $2,347 (reported on 25.4% of returns)
Here:
$2,347
State:
$2,354
(% of AGI for various income ranges: 8.4% for AGIs below $25k, 1.8% for AGIs $25k-50k)
Percentage of individuals using paid preparers for their 2012 taxes: 57.9%
Here:
58%
State:
56%
(% for various income ranges: 56.2% for AGIs below $25k, 56.8% for AGIs $25k-50k, 57.1% for AGIs $50k-75k, 66.7% for AGIs $75k-100k, 63.6% for AGIs $100k-200k)
Averages for the 2004 tax year for zip code 74445, filed in 2005:
Average Adjusted Gross Income (AGI) in 2004: $32,693 (Individual Income Tax Returns)
Here:
$32,693
State:
$41,245
Salary/wage: $31,378 (reported on 84.6% of returns)
Here:
$31,378
State:
$35,318
(% of AGI for various income ranges: 173.3% for AGIs below $10k, 83.1% for AGIs $10k-25k, 83.9% for AGIs $25k-50k, 83.7% for AGIs $50k-75k, 79.7% for AGIs $75k-100k, 61.3% for AGIs over 100k)
Taxable interest for individuals: $944 (reported on 30.9% of returns)
This zip code:
$944
Oklahoma:
$1,745
(% of AGI for various income ranges: 9.7% for AGIs below $10k, 0.7% for AGIs $10k-25k, 1.2% for AGIs $25k-50k, 0.5% for AGIs $50k-75k, 0.2% for AGIs $75k-100k, 0.9% for AGIs over 100k)
Taxable dividends: $1,142 (reported on 11.6% of returns)
Here:
$1,142
State:
$2,920
(% of AGI for various income ranges: 2.8% for AGIs below $10k, 0.3% for AGIs $10k-25k, 0.3% for AGIs $25k-50k, 0.1% for AGIs $50k-75k, 0.2% for AGIs $75k-100k, 1.3% for AGIs over 100k)
Net capital gain/loss: +$6,586 (reported on 9.6% of returns)
Here:
+$6,586
State:
+$10,653
(% of AGI for various income ranges: -0.9% for AGIs below $10k, 0.4% for AGIs $10k-25k, 0.3% for AGIs $25k-50k, 2.3% for AGIs $50k-75k, 0.2% for AGIs $75k-100k, 7.5% for AGIs over 100k)
Profit/loss from business: +$6,711 (reported on 19.2% of returns)
Here:
+$6,711
State:
+$8,532
(% of AGI for various income ranges: 24.9% for AGIs below $10k, 6.4% for AGIs $10k-25k, 3.8% for AGIs $25k-50k, 2.1% for AGIs $50k-75k, 3.4% for AGIs $75k-100k, 3.3% for AGIs over 100k)
IRA payment deduction: $2,917 (reported on 1.0% of returns)
74445:
$2,917
Oklahoma:
$3,127
Total itemized deductions: $14,701 (23% of AGI, reported on 26.3% of returns)
Here:
$14,701
State:
$17,093
Here:
23.2% of AGI
State:
20.5% of AGI
(% of AGI for various income ranges: 23.8% for AGIs below $10k, 5.8% for AGIs $10k-25k, 9.9% for AGIs $25k-50k, 12.7% for AGIs $50k-75k, 16.3% for AGIs $75k-100k, 14.3% for AGIs over 100k)
Charity contributions deductions: $3,454 (5% of AGI, reported on 21.6% of returns)
Here:
$3,454
State:
$4,240
Here:
5.2% of AGI
State:
4.8% of AGI
(% of AGI for various income ranges: 1.2% for AGIs $10k-25k, 1.9% for AGIs $25k-50k, 2.3% for AGIs $50k-75k, 3.2% for AGIs $75k-100k, 3.5% for AGIs over 100k)
Total tax: $3,882 (reported on 67.2% of returns)
74445:
$3,882
State:
$6,542
(% of AGI for various income ranges: 6.0% for AGIs below $10k, 3.6% for AGIs $10k-25k, 5.6% for AGIs $25k-50k, 7.8% for AGIs $50k-75k, 9.6% for AGIs $75k-100k, 15.8% for AGIs over 100k)
Earned income credit: $2,034 (reported on 22.1% of returns)
Here:
$2,034
State:
$1,830
Percentage of individuals using paid preparers for their 2004 taxes: 66.6%
Here:
67%
State:
63%
(% for various income ranges: 57.0% for AGIs below $10k, 69.2% for AGIs $10k-25k, 67.4% for AGIs $25k-50k, 70.6% for AGIs $50k-75k, 73.8% for AGIs $75k-100k, 79.5% for AGIs over 100k)
Household received Food Stamps/SNAP in the past 12 months: 174 Household did not receive Food Stamps/SNAP in the past 12 months: 899
Women who had a birth in the past 12 months: 30 (3 now married, 26 unmarried) Women who did not have a birth in the past 12 months: 484 (252 now married, 232 unmarried)
Housing units in zip code 74445 with a mortgage: 409 (24 second mortgage, 14 both second mortgage and home equity loan) Median monthly owner costs for units with a mortgage: $1,166 Median monthly owner costs for units without a mortgage: $462
Residents with income below the poverty level in 2022:
This zip code:
15.8%
Whole state:
15.7%
Residents with income below 50% of the poverty level in 2022:
This zip code:
9.6%
Whole state:
8.3%
Median number of rooms in houses and condos:
Here:
6.2
State:
6.1
Median number of rooms in apartments:
Here:
4.5
State:
4.5
Notable locations in this zip code not listed on our city pages
Churches in zip code 74445 include: United Pentecostal Church (A), Methodist Church (B), First Christian Church Parsonage (C), First Baptist Church (D), Church of Christ (E), Antioch Church (F), Big Cussetah Church (G), Liberty Church (H), New Zion Church (I). Display/hide their locations on the map
Cemeteries: Antioch Cemetery (1), Moore Creek Cemetery (2), Big Cussetah Cemetery (3), Little Cussetah Cemetery (4), Morris Cemetery (5). Display/hide their locations on the map
Reservoirs: Flag Lake (A), Cane Creek Site 15 Reservoir (B), Cane Creek Site 12 Reservoir (C), Cane Creek Site 11 Reservoir (D), Cane Creek Site 9 Reservoir (E), Cane Creek Site 7 Reservoir (F). Display/hide their locations on the map
Size of family households: 347 2-persons, 89 3-persons, 133 4-persons, 66 5-persons, 50 6-persons, 34 7-or-more-persons
Size of nonfamily households: 323 1-person, 10 2-persons, 9 3-persons
490 married couples with children.
221 single-parent households (66 men, 155 women).
97.7% of residents of 74445 zip code speak English at home.
0.4% of residents speak Spanish at home (25% very well, 75% not well).
1.9% of residents speak other language at home (100% very well).
Foreign born population: 3 (0.1%) (100.0% of them are naturalized citizens)
This zip code:
0.1%
Whole state:
6.0%
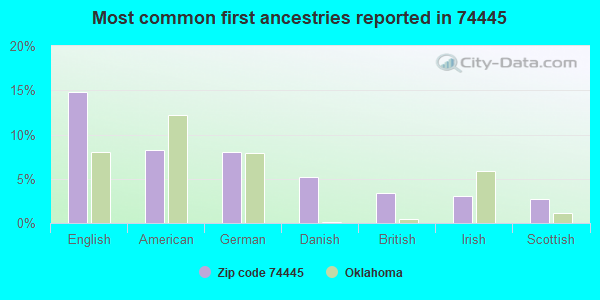
133%Honduras
15%English
8%American
8%German
5%Danish
3%British
3%Irish
3%Scottish
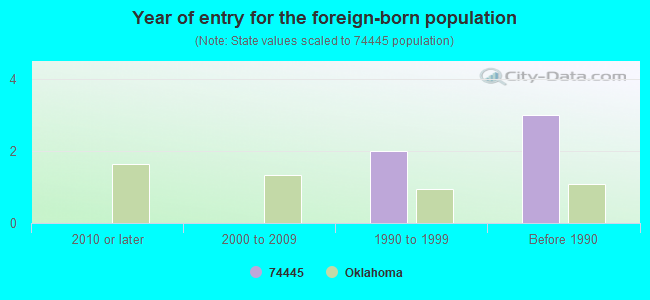
Year of entry for the foreign-born population
02010 or later
02000 to 2009
21990 to 1999
3Before 1990
Facilities with environmental interests located in this zip code:
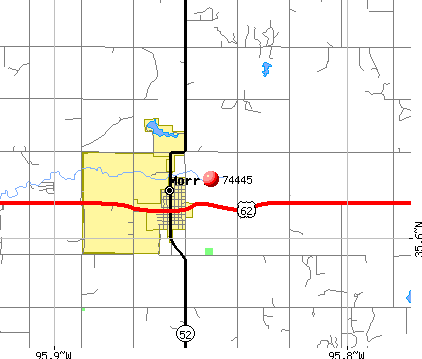
CITY OF MORRIS-NORTHWEST PLANT (501 S. HUGHES STREET in MORRIS, OK)
National Pollutant Discharge Elimination System NON-MAJOR (Tracking pollutant discharge elimination systems) - permit Business SIC classification: SEWERAGE SYSTEMS Alternative names: MORRIS, CITY OF (NW FACILITY)
Housing units lacking complete plumbing facilities: 8.3% Housing units lacking complete kitchen facilities: 6.5%
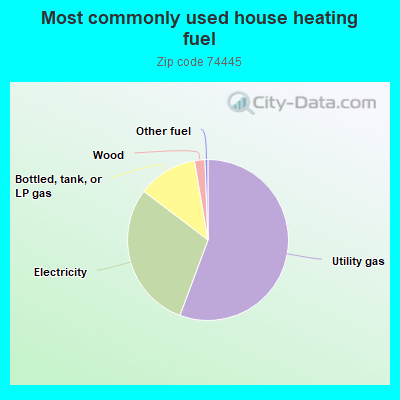
55.8%Utility gas
29.7%Electricity
12.0%Bottled, tank, or LP gas
2.1%Wood
0.6%Other fuel
Population in 1990: 3,028.
Place of birth for U.S.-born residents:
This state: 2,383
Northeast: 3
Midwest: 110
South: 188
West: 157
58% of the 74445 zip code residents lived in the same house 5 years ago. Out of people who lived in different houses, 61% lived in this county. Out of people who lived in different counties, 50% lived in Oklahoma.
91% of the 74445 zip code residents lived in the same house 1 year ago. Out of people who lived in different houses, 49% moved from this county. Out of people who lived in different houses, 51% moved from different county within same state.
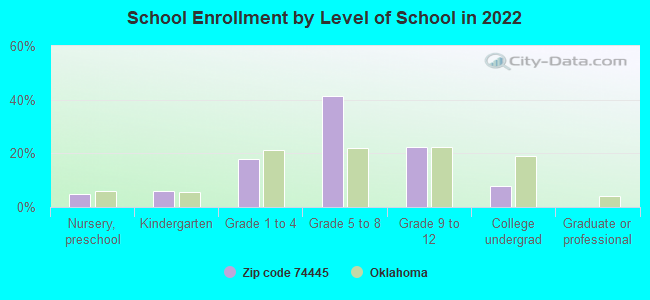
Private vs. public school enrollment:
Students in private schools in grades 1 to 8 (elementary and middle school): 26
Here:
6.4%
Oklahoma:
11.7%
Students in private schools in grades 9 to 12 (high school): 1
Here:
0.8%
Oklahoma:
11.7%
Students in private undergraduate colleges: 6
Here:
11.2%
Oklahoma:
19.3%
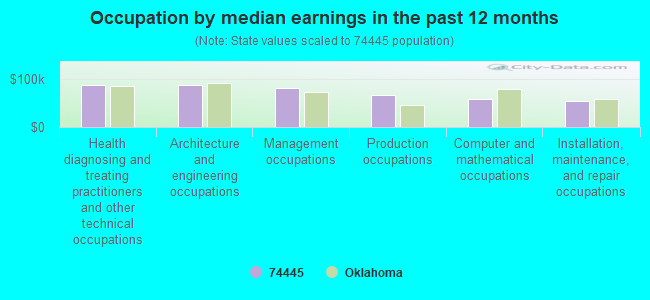
Occupation by median earnings in the past 12 months ($)
89,161Health diagnosing and treating practitioners and other technical occupations
87,713Architecture and engineering occupations
81,069Management occupations
66,330Production occupations
58,501Computer and mathematical occupations
54,896Installation, maintenance, and repair occupations
Companies with federal contracts located in this zip code:
MILITARY PARTS PLUS INC (18550 ASH ROAD in MORRIS, OK; small business) : $627,719 in 34 contractsfrom 2004 to 2006
Contracts for Guns, through 30 mm, Miscellaneous Power Transmission Equipment, Gears, Pulleys, Sprockets, and Transmission Chain, Vehicular Furniture and Accessories, and moreby Defense Logistics Agency Signed by year:2000: $0; 2001: $0; 2002: $0; 2003: $0; 2004: $197,033; 2005: $247,003; 2006: $183,683.
Biggest contracts:
$162,708 with Defense Logistics Agency for Guns, through 30 mm. Signed on 2004-09-07. Completion date: 2004-12-06.
$99,985 with Defense Logistics Agency for Miscellaneous Power Transmission Equipment. Signed on 2005-12-16. Completion date: 2006-05-15.
$48,627 with Defense Logistics Agency for Guns, through 30 mm. Signed on 2006-04-15. Completion date: 2006-07-20.
$42,390 with Defense Logistics Agency for Gears, Pulleys, Sprockets, and Transmission Chain. Signed on 2005-07-15. Completion date: 2005-10-24.
Top industries in this zip code by the number of employees in 2005:
Finance and Insurance: Commercial Banking (20-49 employees: 1 establishment)
Construction: Commercial and Institutional Building Construction (10-19: 1)
Administrative and Support and Waste Management and Remediation Services: Solid Waste Landfill (10-19: 1)
Professional, Scientific, and Technical Services: Veterinary Services (10-19: 1)
Finance and Insurance: Insurance Agencies and Brokerages (10-19: 1)
Mining: Crude Petroleum and Natural Gas Extraction (5-9: 1, 1-4: 2)
Wholesale Trade: Industrial Machinery and Equipment Merchant Wholesalers (5-9: 1)
Finance and Insurance: Investment Advice (5-9: 1)
Construction: Plumbing, Heating, and Air-Conditioning Contractors (5-9: 1)
Fatal accident statistics in 2014:
Fatal accident count: 1
Vehicles involved in fatal accidents: 2
Fatal accidents caused by drunken drivers: 1
Fatalities: 3
Persons involved in fatal accidents: 3
Pedestrians involved in fatal accidents: 0
Fatal accident statistics in 2012:
Fatal accident count: 1
Vehicles involved in fatal accidents: 1
Fatal accidents caused by drunken drivers: 0
Fatalities: 1
Persons involved in fatal accidents: 1
Pedestrians involved in fatal accidents: 0
Home Mortgage Disclosure Act Aggregated Statistics For Year 2009 (Based on 2 partial tracts)
A) FHA, FSA/RHS & VA Home Purchase Loans
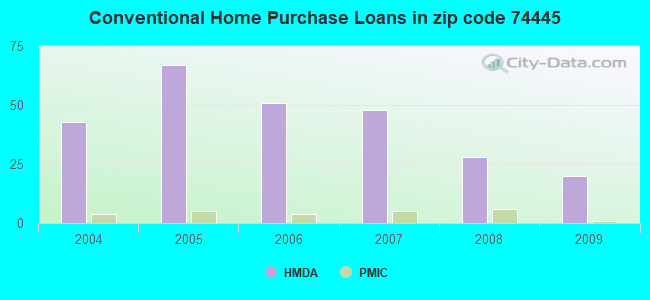
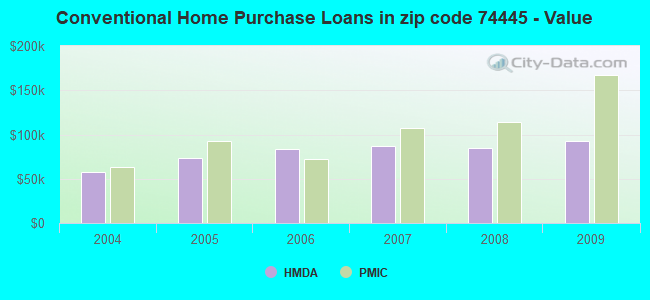
B) Conventional Home Purchase Loans
C) Refinancings
D) Home Improvement Loans
F) Non-occupant Loans on < 5 Family Dwellings (A B C & D)
G) Loans On Manufactured Home Dwelling (A B C & D)
Number
Average Value
Number
Average Value
Number
Average Value
Number
Average Value
Number
Average Value
Number
Average Value
LOANS ORIGINATED
9
$108,642
20
$92,974
44
$107,472
23
$62,615
7
$49,754
10
$52,842
APPLICATIONS APPROVED, NOT ACCEPTED
1
$39,030
2
$63,050
7
$112,947
1
$20,020
0
$0
2
$57,045
APPLICATIONS DENIED
5
$145,316
17
$102,494
28
$114,878
3
$9,673
1
$15,010
4
$109,338
APPLICATIONS WITHDRAWN
0
$0
0
$0
10
$149,620
0
$0
0
$0
1
$111,090
FILES CLOSED FOR INCOMPLETENESS
0
$0
0
$0
1
$29,020
0
$0
0
$0
1
$29,020
Aggregated Statistics For Year 2008 (Based on 2 partial tracts)
A) FHA, FSA/RHS & VA Home Purchase Loans
B) Conventional Home Purchase Loans
C) Refinancings
D) Home Improvement Loans
F) Non-occupant Loans on < 5 Family Dwellings (A B C & D)
G) Loans On Manufactured Home Dwelling (A B C & D)
Number
Average Value
Number
Average Value
Number
Average Value
Number
Average Value
Number
Average Value
Number
Average Value
LOANS ORIGINATED
5
$88,470
28
$85,247
39
$110,961
12
$51,625
13
$74,444
13
$48,808
APPLICATIONS APPROVED, NOT ACCEPTED
3
$98,413
3
$39,700
4
$105,835
0
$0
0
$0
3
$55,377
APPLICATIONS DENIED
2
$101,580
13
$82,989
31
$95,399
4
$52,792
1
$115,090
10
$65,853
APPLICATIONS WITHDRAWN
2
$54,045
0
$0
14
$128,817
0
$0
0
$0
1
$39,030
FILES CLOSED FOR INCOMPLETENESS
0
$0
0
$0
1
$52,040
0
$0
0
$0
0
$0
Aggregated Statistics For Year 2007 (Based on 2 partial tracts)
A) FHA, FSA/RHS & VA Home Purchase Loans
B) Conventional Home Purchase Loans
C) Refinancings
D) Home Improvement Loans
F) Non-occupant Loans on < 5 Family Dwellings (A B C & D)
G) Loans On Manufactured Home Dwelling (A B C & D)
Number
Average Value
Number
Average Value
Number
Average Value
Number
Average Value
Number
Average Value
Number
Average Value
LOANS ORIGINATED
2
$59,045
48
$86,548
60
$78,379
17
$44,565
20
$62,050
30
$43,902
APPLICATIONS APPROVED, NOT ACCEPTED
0
$0
2
$152,620
9
$71,168
0
$0
1
$200,160
3
$102,750
APPLICATIONS DENIED
0
$0
26
$120,866
37
$95,022
13
$28,485
0
$0
16
$73,371
APPLICATIONS WITHDRAWN
0
$0
6
$150,287
11
$84,340
0
$0
0
$0
2
$78,565
FILES CLOSED FOR INCOMPLETENESS
0
$0
2
$52,040
4
$78,312
0
$0
0
$0
0
$0
Aggregated Statistics For Year 2006 (Based on 2 partial tracts)
A) FHA, FSA/RHS & VA Home Purchase Loans
B) Conventional Home Purchase Loans
C) Refinancings
D) Home Improvement Loans
F) Non-occupant Loans on < 5 Family Dwellings (A B C & D)
G) Loans On Manufactured Home Dwelling (A B C & D)
Number
Average Value
Number
Average Value
Number
Average Value
Number
Average Value
Number
Average Value
Number
Average Value
LOANS ORIGINATED
4
$107,835
51
$83,871
45
$78,018
27
$36,844
10
$28,823
21
$42,462
APPLICATIONS APPROVED, NOT ACCEPTED
0
$0
14
$84,496
15
$79,330
1
$17,010
0
$0
10
$83,867
APPLICATIONS DENIED
1
$58,050
25
$62,650
39
$82,964
23
$63,616
0
$0
15
$67,053
APPLICATIONS WITHDRAWN
0
$0
7
$63,623
36
$100,775
6
$71,890
2
$45,035
5
$49,040
FILES CLOSED FOR INCOMPLETENESS
0
$0
0
$0
5
$86,870
0
$0
0
$0
0
$0
Aggregated Statistics For Year 2005 (Based on 2 partial tracts)
A) FHA, FSA/RHS & VA Home Purchase Loans
B) Conventional Home Purchase Loans
C) Refinancings
D) Home Improvement Loans
F) Non-occupant Loans on < 5 Family Dwellings (A B C & D)
G) Loans On Manufactured Home Dwelling (A B C & D)
Number
Average Value
Number
Average Value
Number
Average Value
Number
Average Value
Number
Average Value
Number
Average Value
LOANS ORIGINATED
3
$104,417
67
$73,043
51
$69,919
22
$33,800
24
$50,248
33
$40,972
APPLICATIONS APPROVED, NOT ACCEPTED
2
$59,045
16
$116,531
16
$75,122
1
$12,010
1
$32,030
15
$65,919
APPLICATIONS DENIED
1
$143,110
33
$66,599
63
$85,576
6
$43,535
6
$57,212
21
$64,147
APPLICATIONS WITHDRAWN
0
$0
10
$74,760
40
$97,703
4
$58,798
0
$0
2
$63,050
FILES CLOSED FOR INCOMPLETENESS
0
$0
4
$85,068
2
$73,060
0
$0
0
$0
0
$0
Aggregated Statistics For Year 2004 (Based on 2 partial tracts)
A) FHA, FSA/RHS & VA Home Purchase Loans
B) Conventional Home Purchase Loans
C) Refinancings
D) Home Improvement Loans
F) Non-occupant Loans on < 5 Family Dwellings (A B C & D)
G) Loans On Manufactured Home Dwelling (A B C & D)
Detailed PMIC statistics for the following Tracts:0007.00
2005 - 2018 National Fire Incident Reporting System (NFIRS) incidents
According to the data from the years 2005 - 2018 the average number of fires per year is 45. The highest number of reported fire incidents - 77 took place in 2006, and the least - 13 in 2013. The data has a dropping trend.
When looking into fire subcategories, the most incidents belonged to: Outside Fires (78.8%), and Structure Fires (9.4%).
Fire incident types reported to NFIRS in Zip Code 74445

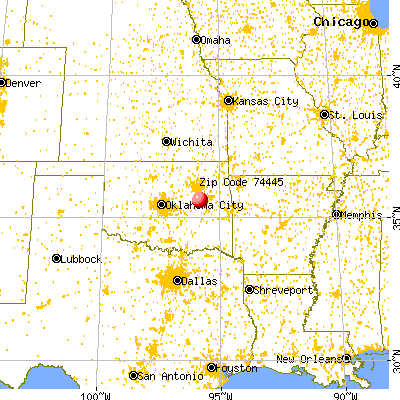


 Nearest zip codes: 74438, 74422, 74447, 74460, 74456, 74431.


 According to the data from the years 2005 - 2018 the average number of fires per year is 45. The highest number of reported fire incidents - 77 took place in 2006, and the least - 13 in 2013. The data has a dropping trend.
 When looking into fire subcategories, the most incidents belonged to: Outside Fires (78.8%), and Structure Fires (9.4%).