Estimated median house/condo value in 2022: $120,529
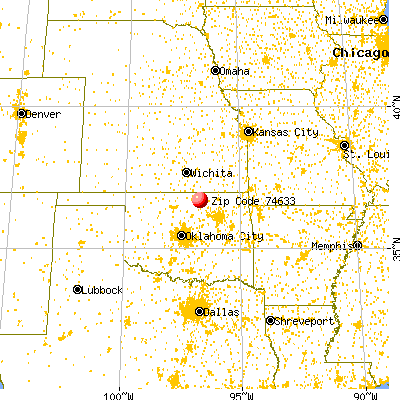
74633:
$120,529
Oklahoma:
$191,700
According to our research of Oklahoma and other state lists, there was 1 registered sex offender living in 74633 zip code as of May 28, 2024. The ratio of all residents to sex offenders in zip code 74633 is 413 to 1. The ratio of registered sex offenders to all residents in this zip code is near the state average.
Median resident age:
This zip code:
22.9 years
Oklahoma median age:
37.1 years
Average household size:
This zip code:
4.2 people
Oklahoma:
2.5 people
Averages for the 2020 tax year for zip code 74633, filed in 2021:
Average Adjusted Gross Income (AGI) in 2020: $56,767 (Individual Income Tax Returns)
Here:
$56,767
State:
$63,060
Salary/wage: $46,392 (reported on 86.7% of returns)
Here:
$46,392
State:
$52,427
(% of AGI for various income ranges: 1052.0% for AGIs below $25k, 3366.7% for AGIs $25k-50k, 5413.3% for AGIs $50k-75k, 14355.0% for AGIs $100k-200k)
Taxable interest for individuals: $225 (reported on 26.7% of returns)
This zip code:
$225
Oklahoma:
$1,603
(% of AGI for various income ranges: 30.0% for AGIs $25k-50k)
Profit/loss from business: +$5,550 (reported on 13.3% of returns)
Here:
+$5,550
State:
+$9,904
(% of AGI for various income ranges: 222.0% for AGIs below $25k)
Earned income credit: $2,200 (reported on 20.0% of returns)
Here:
$2,200
State:
$2,435
(% of AGI for various income ranges: 132.0% for AGIs below $25k)
Percentage of individuals using paid preparers for their 2020 taxes: 100.0%
Here:
100%
State:
94%
(% for various income ranges: 100.0% for AGIs below $25k, 100.0% for AGIs $25k-50k, 100.0% for AGIs $50k-75k, 100.0% for AGIs $100k-200k)
Averages for the 2012 tax year for zip code 74633, filed in 2013:
Average Adjusted Gross Income (AGI) in 2012: $54,689 (Individual Income Tax Returns)
Here:
$54,689
State:
$58,581
Salary/wage: $52,171 (reported on 77.8% of returns)
Here:
$52,171
State:
$45,973
(% of AGI for various income ranges: 71.5% for AGIs below $25k, 79.1% for AGIs $25k-50k, 80.1% for AGIs $50k-75k, 89.5% for AGIs $75k-100k, 61.8% for AGIs $100k-200k)
Taxable interest for individuals: $250 (reported on 33.3% of returns)
This zip code:
$250
Oklahoma:
$1,625
Profit/loss from business: +$2,167 (reported on 16.7% of returns)
Here:
+$2,167
State:
+$11,913
Total itemized deductions: $21,950 (22% of AGI, reported on 22.2% of returns)
Here:
$21,950
State:
$24,882
Here:
22.4% of AGI
State:
18.8% of AGI
Charity contributions: $2,650 (reported on 11.1% of returns)
Here:
$2,650
State:
$6,591
Taxes paid: $4,875 (reported on 22.2% of returns)
74633:
$4,875
State:
$7,196
Earned income credit: $2,100 (reported on 16.7% of returns)
Here:
$2,100
State:
$2,354
(% of AGI for various income ranges: 8.5% for AGIs below $25k)
Percentage of individuals using paid preparers for their 2012 taxes: 72.2%
Here:
72%
State:
56%
(% for various income ranges: 66.7% for AGIs below $25k, 75.0% for AGIs $25k-50k, 133.3% for AGIs $50k-75k, 66.7% for AGIs $100k-200k)
Averages for the 2004 tax year for zip code 74633, filed in 2005:
Average Adjusted Gross Income (AGI) in 2004: $41,655 (Individual Income Tax Returns)
Here:
$41,655
State:
$41,245
Salary/wage: $38,218 (reported on 87.5% of returns)
Here:
$38,218
State:
$35,318
(% of AGI for various income ranges: 171.4% for AGIs below $10k, 97.7% for AGIs $10k-25k, 80.1% for AGIs $25k-50k, 86.4% for AGIs $50k-75k, 70.4% for AGIs $75k-100k)
Taxable interest for individuals: $500 (reported on 36.9% of returns)
This zip code:
$500
Oklahoma:
$1,745
(% of AGI for various income ranges: 14.3% for AGIs below $10k, 0.5% for AGIs $25k-50k, 0.3% for AGIs $50k-75k, 0.2% for AGIs $75k-100k)
Taxable dividends: $619 (reported on 12.5% of returns)
Here:
$619
State:
$2,920
Net capital gain/loss: +$2,318 (reported on 13.1% of returns)
Here:
+$2,318
State:
+$10,653
Total itemized deductions: $15,333 (23% of AGI, reported on 33.9% of returns)
Here:
$15,333
State:
$17,093
Here:
23.4% of AGI
State:
20.5% of AGI
Charity contributions deductions: $2,341 (4% of AGI, reported on 26.2% of returns)
Here:
$2,341
State:
$4,240
Here:
4.0% of AGI
State:
4.8% of AGI
Total tax: $5,333 (reported on 73.2% of returns)
74633:
$5,333
State:
$6,542
(% of AGI for various income ranges: 3.7% for AGIs $10k-25k, 5.6% for AGIs $25k-50k, 8.1% for AGIs $50k-75k, 14.3% for AGIs $75k-100k)
Earned income credit: $1,917 (reported on 14.3% of returns)
Here:
$1,917
State:
$1,830
Percentage of individuals using paid preparers for their 2004 taxes: 65.5%
Here:
65%
State:
63%
(% for various income ranges: 66.7% for AGIs below $10k, 59.5% for AGIs $10k-25k, 69.1% for AGIs $25k-50k, 64.0% for AGIs $50k-75k, 66.7% for AGIs $75k-100k)
Household received Food Stamps/SNAP in the past 12 months: 23 Household did not receive Food Stamps/SNAP in the past 12 months: 129
Women who had a birth in the past 12 months: 1 (1 now married, 0 unmarried) Women who did not have a birth in the past 12 months: 164 (64 now married, 100 unmarried)
Housing units in zip code 74633 with a mortgage: 63 Median monthly owner costs for units with a mortgage: $2,185 Median monthly owner costs for units without a mortgage: $433
Residents with income below the poverty level in 2022:
This zip code:
9.5%
Whole state:
15.7%
Residents with income below 50% of the poverty level in 2022:
This zip code:
5.3%
Whole state:
8.3%
Median number of rooms in houses and condos:
Here:
5.9
State:
6.1
Median number of rooms in apartments:
Here:
5.1
State:
4.5
Notable locations in this zip code not listed on our city pages
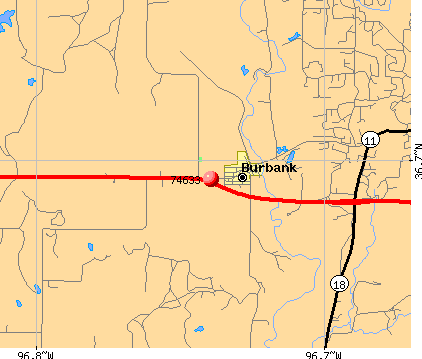
Notable locations in zip code 74633: Sarge Creek Rural Fire Company (A), Burbank Volunteer Fire Department (B), Denoya Rural Firefighters (C). Display/hide their locations on the map
In group quarters: 12 (-1 institutionalized population)
Size of family households: 41 2-persons, 29 3-persons, 21 4-persons, 27 5-persons, 7 6-persons, 4 7-or-more-persons
Size of nonfamily households: 19 1-person
154 married couples with children.
79 single-parent households (56 men, 23 women).
92.8% of residents of 74633 zip code speak English at home.
4.9% of residents speak other Indo-European language at home (100% very well).
0.5% of residents speak Asian or Pacific Island language at home (100% very well).
Foreign born population: 14 (2.3%) (100.0% of them are naturalized citizens)
This zip code:
2.3%
Whole state:
6.0%
100%France
14%European
13%American
7%Irish
6%German
2%English
Year of entry for the foreign-born population
02010 or later
02000 to 2009
01990 to 1999
12Before 1990
Facilities with environmental interests located in this zip code:
BURBANK ES (PO BOX 148 in BURBANK, OK)
(National Center for Education Statistics) - STATE ID-57-C020-105
BURBANK PETROLEUM CO (S BURBANK FIELD in BURBANK, OK) . Tribal Land
(Integrated Compliance Information System) - ICIS-06-1996-0194, FORMAL ENFORCEMENT ACTION
CALUMET OIL COMPANY, F-4 CRUDE OIL PIPELINE (NW/4, SECTION 2, T25 N, R6 E, S BURBANK UNIT in BURBANK, OK)
(Integrated Compliance Information System) - ICIS-06-2000-1168, FORMAL ENFORCEMENT ACTION Business SIC classification: CRUDE PETROLEUM AND NATURAL GAS; CRUDE PETROLEUM PIPELINES
AMERICAN TEL & TEL CO LONG LINES (HWY 60 7M E H18 in BURBANK, OK) . Tribal Land
(Resource Conservation and Recovery Act (tracking hazardous waste))
BURBANK PUBLIC SCHOOLS (P O BOX 148 in BURBANK, OK)
COMPLIANCE ACTIVITY (Tracking inspections of insecticide, fungicide, and rodenticide, and toxic substances)
COS0734 - WELL NO. K-W5 (E) (SE/4, SEC. 03, T25N, R06E in BURBANK, OK)
ENFORCEMENT/COMPLIANCE ACTIVITY (Integrated Compliance Information System)
Housing units lacking complete plumbing facilities: 13.6% Housing units lacking complete kitchen facilities: 7.7%
35.8%Electricity
25.5%Bottled, tank, or LP gas
15.2%Utility gas
13.8%Fuel oil, kerosene, etc.
11.0%Wood
0.7%Other fuel
Population in 1990: 641.
Place of birth for U.S.-born residents:
This state: 568
Midwest: 30
South: 37
65% of the 74633 zip code residents lived in the same house 5 years ago. Out of people who lived in different houses, 33% lived in this county. Out of people who lived in different counties, 50% lived in Oklahoma.
95% of the 74633 zip code residents lived in the same house 1 year ago. Out of people who lived in different houses, 31% moved from this county. Out of people who lived in different houses, 75% moved from different county within same state.
Private vs. public school enrollment:
Students in private schools in grades 1 to 8 (elementary and middle school): 23
Here:
20.4%
Oklahoma:
11.7%
Students in private schools in grades 9 to 12 (high school): 68
Here:
64.4%
Oklahoma:
11.7%
Students in private undergraduate colleges:
Here:
0.0%
Oklahoma:
19.3%
Occupation by median earnings in the past 12 months ($)
111,644Installation, maintenance, and repair occupations
96,154Management occupations
55,330Production occupations
54,143Education, training, and library occupations
38,110Sales and related occupations
37,817Construction and extraction occupations
Companies with federal contracts located in this zip code:
OGAN, WILLIAM C (13036 POSSUM HOLLAR RD in BURBANK, OK; small business)
$5,850 with U.S. Army Corps of Engineers - civil program financing only for Construction of Structures and Facilities -- Other Non-Building Facilities. Signed on 2000-03-15. Completion date: 2000-04-29.
People in group quarters in 2010:
4 people in group homes for juveniles (non-correctional)
4 people in group homes intended for adults
Fatal accident statistics in 2013:
Fatal accident count: 1
Vehicles involved in fatal accidents: 1
Fatal accidents caused by drunken drivers: 0
Fatalities: 1
Persons involved in fatal accidents: 1
Pedestrians involved in fatal accidents: 0
Home Mortgage Disclosure Act Aggregated Statistics For Year 2009 (Based on 2 partial tracts)
A) FHA, FSA/RHS & VA Home Purchase Loans
B) Conventional Home Purchase Loans
C) Refinancings
D) Home Improvement Loans
F) Non-occupant Loans on < 5 Family Dwellings (A B C & D)
G) Loans On Manufactured Home Dwelling (A B C & D)
Number
Average Value
Number
Average Value
Number
Average Value
Number
Average Value
Number
Average Value
Number
Average Value
LOANS ORIGINATED
0
$0
2
$133,775
4
$225,002
1
$51,750
1
$70,470
1
$36,550
APPLICATIONS APPROVED, NOT ACCEPTED
0
$0
0
$0
0
$0
0
$0
0
$0
0
$0
APPLICATIONS DENIED
1
$78,070
1
$19,010
1
$192,980
1
$19,010
0
$0
1
$58,770
APPLICATIONS WITHDRAWN
0
$0
0
$0
1
$103,220
0
$0
0
$0
0
$0
FILES CLOSED FOR INCOMPLETENESS
0
$0
0
$0
0
$0
0
$0
0
$0
0
$0
Aggregated Statistics For Year 2008 (Based on 2 partial tracts)
A) FHA, FSA/RHS & VA Home Purchase Loans
B) Conventional Home Purchase Loans
C) Refinancings
D) Home Improvement Loans
G) Loans On Manufactured Home Dwelling (A B C & D)
Number
Average Value
Number
Average Value
Number
Average Value
Number
Average Value
Number
Average Value
LOANS ORIGINATED
1
$37,430
1
$84,210
3
$92,107
2
$29,970
1
$12,870
APPLICATIONS APPROVED, NOT ACCEPTED
0
$0
1
$71,050
0
$0
0
$0
1
$71,050
APPLICATIONS DENIED
0
$0
2
$41,080
3
$87,427
2
$9,650
1
$43,280
APPLICATIONS WITHDRAWN
0
$0
0
$0
1
$33,040
1
$40,940
0
$0
FILES CLOSED FOR INCOMPLETENESS
0
$0
0
$0
0
$0
0
$0
0
$0
Aggregated Statistics For Year 2007 (Based on 2 partial tracts)
A) FHA, FSA/RHS & VA Home Purchase Loans
B) Conventional Home Purchase Loans
C) Refinancings
D) Home Improvement Loans
F) Non-occupant Loans on < 5 Family Dwellings (A B C & D)
G) Loans On Manufactured Home Dwelling (A B C & D)
Number
Average Value
Number
Average Value
Number
Average Value
Number
Average Value
Number
Average Value
Number
Average Value
LOANS ORIGINATED
1
$73,980
5
$49,124
3
$68,617
2
$15,060
1
$43,570
2
$55,265
APPLICATIONS APPROVED, NOT ACCEPTED
0
$0
1
$21,350
1
$38,890
1
$3,510
0
$0
1
$45,030
APPLICATIONS DENIED
0
$0
1
$54,390
2
$66,375
1
$44,150
0
$0
1
$43,570
APPLICATIONS WITHDRAWN
0
$0
1
$66,370
0
$0
0
$0
0
$0
0
$0
FILES CLOSED FOR INCOMPLETENESS
0
$0
0
$0
0
$0
0
$0
0
$0
0
$0
Aggregated Statistics For Year 2006 (Based on 2 partial tracts)
B) Conventional Home Purchase Loans
C) Refinancings
D) Home Improvement Loans
G) Loans On Manufactured Home Dwelling (A B C & D)
Number
Average Value
Number
Average Value
Number
Average Value
Number
Average Value
LOANS ORIGINATED
3
$45,517
4
$43,055
1
$7,310
1
$75,730
APPLICATIONS APPROVED, NOT ACCEPTED
0
$0
0
$0
0
$0
0
$0
APPLICATIONS DENIED
2
$96,930
3
$64,913
1
$3,220
0
$0
APPLICATIONS WITHDRAWN
0
$0
3
$93,470
0
$0
0
$0
FILES CLOSED FOR INCOMPLETENESS
0
$0
0
$0
0
$0
0
$0
Aggregated Statistics For Year 2005 (Based on 2 partial tracts)
B) Conventional Home Purchase Loans
C) Refinancings
D) Home Improvement Loans
G) Loans On Manufactured Home Dwelling (A B C & D)
Number
Average Value
Number
Average Value
Number
Average Value
Number
Average Value
LOANS ORIGINATED
4
$71,565
4
$49,562
1
$17,540
2
$42,985
APPLICATIONS APPROVED, NOT ACCEPTED
1
$42,980
0
$0
0
$0
1
$42,980
APPLICATIONS DENIED
3
$45,420
2
$57,310
0
$0
2
$32,020
APPLICATIONS WITHDRAWN
1
$57,900
2
$68,715
0
$0
0
$0
FILES CLOSED FOR INCOMPLETENESS
0
$0
0
$0
0
$0
0
$0
Aggregated Statistics For Year 2004 (Based on 2 partial tracts)
B) Conventional Home Purchase Loans
C) Refinancings
D) Home Improvement Loans
F) Non-occupant Loans on < 5 Family Dwellings (A B C & D)
G) Loans On Manufactured Home Dwelling (A B C & D)
Number
Average Value
Number
Average Value
Number
Average Value
Number
Average Value
Number
Average Value
LOANS ORIGINATED
2
$36,550
4
$68,202
0
$0
1
$87,430
1
$25,730
APPLICATIONS APPROVED, NOT ACCEPTED
1
$40,060
0
$0
0
$0
0
$0
1
$16,080
APPLICATIONS DENIED
1
$40,060
2
$75,440
1
$24,850
0
$0
1
$23,390
APPLICATIONS WITHDRAWN
0
$0
1
$69,590
0
$0
0
$0
0
$0
FILES CLOSED FOR INCOMPLETENESS
0
$0
0
$0
0
$0
0
$0
0
$0
Aggregated Statistics For Year 2003 (Based on 2 partial tracts)
B) Conventional Home Purchase Loans
C) Refinancings
D) Home Improvement Loans
F) Non-occupant Loans on < 5 Family Dwellings (A B C & D)
Number
Average Value
Number
Average Value
Number
Average Value
Number
Average Value
LOANS ORIGINATED
3
$42,007
4
$67,762
1
$9,650
1
$8,770
APPLICATIONS APPROVED, NOT ACCEPTED
0
$0
1
$53,220
0
$0
0
$0
APPLICATIONS DENIED
2
$21,345
3
$122,517
1
$36,550
0
$0
APPLICATIONS WITHDRAWN
0
$0
2
$58,625
0
$0
0
$0
FILES CLOSED FOR INCOMPLETENESS
0
$0
0
$0
0
$0
0
$0
Aggregated Statistics For Year 2002 (Based on 2 partial tracts)
B) Conventional Home Purchase Loans
C) Refinancings
D) Home Improvement Loans
Number
Average Value
Number
Average Value
Number
Average Value
LOANS ORIGINATED
6
$52,242
4
$59,210
1
$7,890
APPLICATIONS APPROVED, NOT ACCEPTED
0
$0
1
$126,020
0
$0
APPLICATIONS DENIED
2
$42,545
4
$37,865
0
$0
APPLICATIONS WITHDRAWN
0
$0
3
$49,903
0
$0
FILES CLOSED FOR INCOMPLETENESS
0
$0
1
$57,310
0
$0
Aggregated Statistics For Year 2001 (Based on 2 partial tracts)
A) FHA, FSA/RHS & VA Home Purchase Loans
B) Conventional Home Purchase Loans
C) Refinancings
D) Home Improvement Loans
F) Non-occupant Loans on < 5 Family Dwellings (A B C & D)
Number
Average Value
Number
Average Value
Number
Average Value
Number
Average Value
Number
Average Value
LOANS ORIGINATED
1
$51,170
3
$26,707
2
$19,005
1
$13,740
1
$4,680
APPLICATIONS APPROVED, NOT ACCEPTED
0
$0
1
$19,300
1
$41,810
0
$0
0
$0
APPLICATIONS DENIED
0
$0
2
$25,730
2
$32,020
0
$0
0
$0
APPLICATIONS WITHDRAWN
0
$0
0
$0
2
$42,835
0
$0
0
$0
FILES CLOSED FOR INCOMPLETENESS
0
$0
0
$0
0
$0
0
$0
0
$0
Aggregated Statistics For Year 2000 (Based on 2 partial tracts)
B) Conventional Home Purchase Loans
C) Refinancings
D) Home Improvement Loans
F) Non-occupant Loans on < 5 Family Dwellings (A B C & D)
Number
Average Value
Number
Average Value
Number
Average Value
Number
Average Value
LOANS ORIGINATED
3
$26,120
3
$22,710
1
$6,140
1
$8,190
APPLICATIONS APPROVED, NOT ACCEPTED
1
$38,890
1
$19,880
0
$0
0
$0
APPLICATIONS DENIED
2
$21,200
0
$0
1
$32,160
0
$0
APPLICATIONS WITHDRAWN
0
$0
0
$0
0
$0
0
$0
FILES CLOSED FOR INCOMPLETENESS
0
$0
0
$0
0
$0
0
$0
Aggregated Statistics For Year 1999 (Based on 1 partial tract)
A) FHA, FSA/RHS & VA Home Purchase Loans
B) Conventional Home Purchase Loans
C) Refinancings
D) Home Improvement Loans
F) Non-occupant Loans on < 5 Family Dwellings (A B C & D)


 Nearest zip codes: 74641, 74637, 74652, 74604, 74650, 74647.