Estimated zip code population in 2022: 1,611 Zip code population in 2010: 1,899 Zip code population in 2000: 2,063
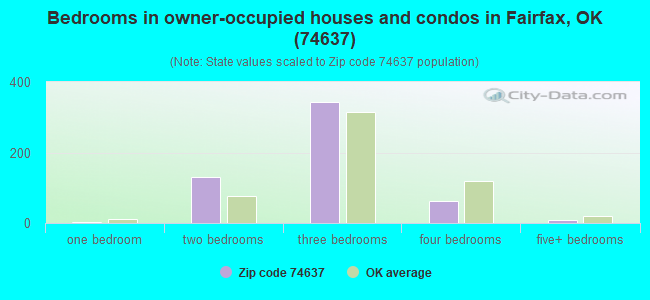
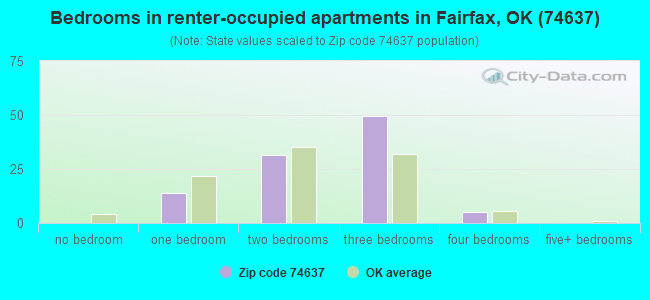
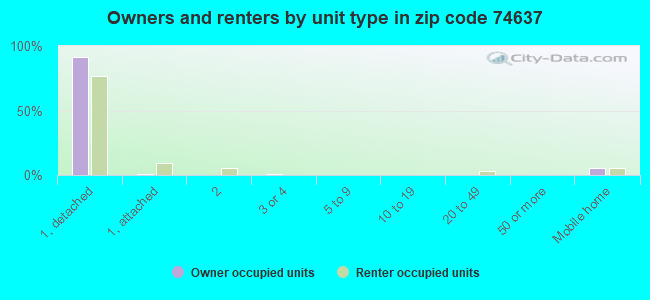
Houses and condos: 868 Renter-occupied apartments: 100
% of renters here:
15%
State:
35%
March 2022 cost of living index in zip code 74637: 76.9 (low, U.S. average is 100)
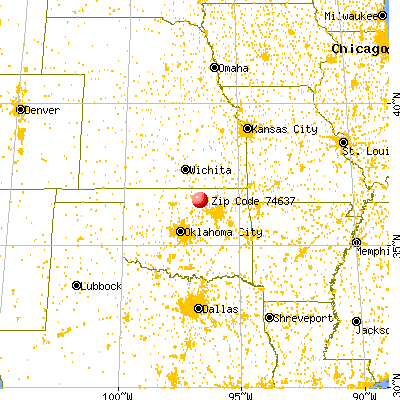
Land area: 187.4 sq. mi. Water area: 1.9 sq. mi.
Population density: 9 people per square mile
(very low).
OSM Map
General Map
Google Map
MSN Map
OSM Map
General Map
Google Map
MSN Map
OSM Map
General Map
Google Map
MSN Map
OSM Map
General Map
Google Map
MSN Map
Please wait while loading the map...
Real estate property taxes paid for housing units in 2022:
This zip code:
0.6% ($386)
Oklahoma:
0.8% ($1,501)
Median real estate property taxes paid for housing units with mortgages in 2022: $581 (0.8%) Median real estate property taxes paid for housing units with no mortgage in 2022: $306 (0.5%)
Business Search- 14 Million verified businesses
Males: 782
(48.5%)
Females: 829
(51.5%)
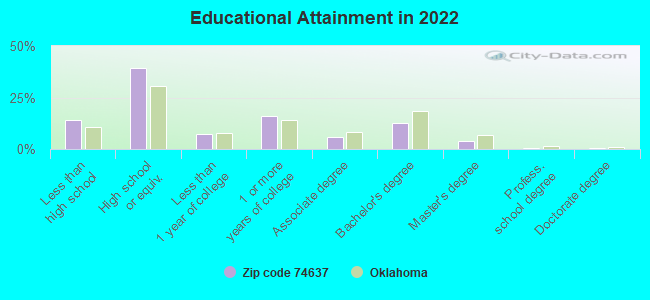
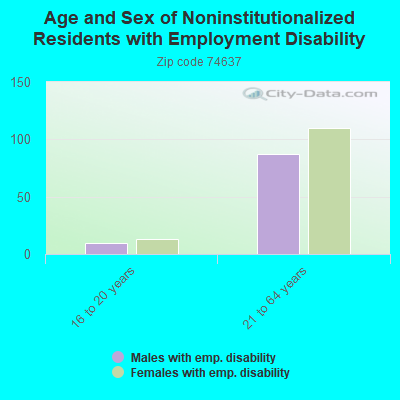
For population 25 years and over in 74637:
High school or higher: 84.3%
Bachelor's degree or higher: 16.8%
Graduate or professional degree: 4.5%
Unemployed: 9.7%
Mean travel time to work (commute): 23.9 minutes
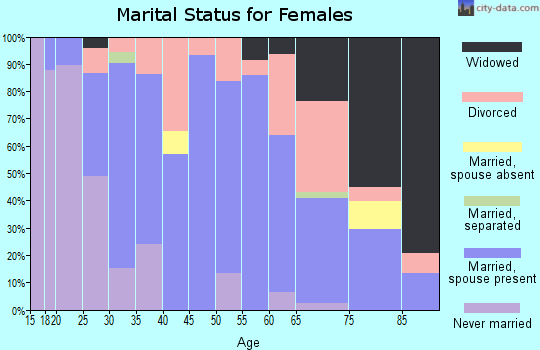
For population 15 years and over in 74637:
Never married: 22.4%
Now married: 51.1%
Separated: 2.9%
Widowed: 10.2%
Divorced: 13.4%
Zip code 74637 compared to state average:
Median house value significantly below state average.
Unemployed percentage above state average.
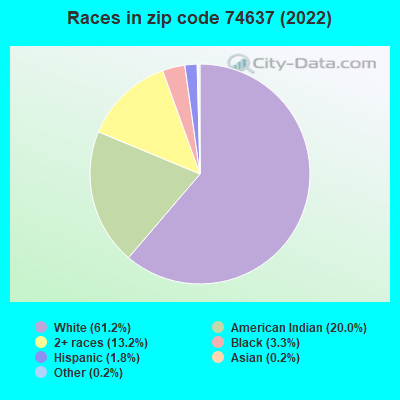
Black race population percentage below state average.
Hispanic race population percentage significantly below state average.
Median age significantly above state average.
Foreign-born population percentage significantly below state average.
Renting percentage significantly below state average.
Length of stay since moving in significantly above state average.
Averages for the 2020 tax year for zip code 74637, filed in 2021:
Average Adjusted Gross Income (AGI) in 2020: $48,181 (Individual Income Tax Returns)
Here:
$48,181
State:
$63,060
Salary/wage: $45,085 (reported on 79.7% of returns)
Here:
$45,085
State:
$52,427
(% of AGI for various income ranges: 983.7% for AGIs below $25k, 3532.1% for AGIs $25k-50k, 5924.0% for AGIs $50k-75k, 10180.0% for AGIs $75k-100k, 20900.0% for AGIs $100k-200k)
Taxable interest for individuals: $1,853 (reported on 28.8% of returns)
This zip code:
$1,853
Oklahoma:
$1,603
(% of AGI for various income ranges: 28.9% for AGIs below $25k, 101.4% for AGIs $25k-50k, 158.0% for AGIs $50k-75k, 97.5% for AGIs $100k-200k)
Ordinary dividends: $1,300 (reported on 6.8% of returns)
Here:
$1,300
State:
$7,001
(% of AGI for various income ranges: 37.1% for AGIs $25k-50k)
Net capital gain/loss in AGI: +$1,700 (reported on 8.5% of returns)
Here:
+$1,700
State:
+$19,855
(% of AGI for various income ranges: 4.2% for AGIs below $25k, 154.0% for AGIs $50k-75k)
Profit/loss from business: +$5,340 (reported on 16.9% of returns)
Here:
+$5,340
State:
+$9,904
(% of AGI for various income ranges: 171.6% for AGIs below $25k, 60.7% for AGIs $25k-50k, 410.0% for AGIs $75k-100k)
Taxable individual retirement arrangement distribution: $12,175 (reported on 6.8% of returns)
74637:
$12,175
Oklahoma:
$20,476
(% of AGI for various income ranges: 347.9% for AGIs $25k-50k)
Earned income credit: $2,435 (reported on 28.8% of returns)
Here:
$2,435
State:
$2,435
(% of AGI for various income ranges: 153.7% for AGIs below $25k, 87.1% for AGIs $25k-50k)
Percentage of individuals using paid preparers for their 2020 taxes: 93.2%
Here:
93%
State:
94%
(% for various income ranges: 91.7% for AGIs below $25k, 94.1% for AGIs $25k-50k, 100.0% for AGIs $50k-75k, 80.0% for AGIs $75k-100k, 100.0% for AGIs $100k-200k)
Averages for the 2012 tax year for zip code 74637, filed in 2013:
Average Adjusted Gross Income (AGI) in 2012: $41,495 (Individual Income Tax Returns)
Here:
$41,495
State:
$58,581
Salary/wage: $37,638 (reported on 85.9% of returns)
Here:
$37,638
State:
$45,973
(% of AGI for various income ranges: 76.1% for AGIs below $25k, 80.0% for AGIs $25k-50k, 81.6% for AGIs $50k-75k, 78.2% for AGIs $75k-100k, 74.5% for AGIs $100k-200k)
Taxable interest for individuals: $1,695 (reported on 29.7% of returns)
This zip code:
$1,695
Oklahoma:
$1,625
(% of AGI for various income ranges: 2.7% for AGIs below $25k, 2.1% for AGIs $25k-50k, 1.0% for AGIs $50k-75k, 0.4% for AGIs $75k-100k, 0.4% for AGIs $100k-200k)
Ordinary dividends: $1,217 (reported on 9.4% of returns)
Here:
$1,217
State:
$6,374
Net capital gain/loss in AGI: +$1,775 (reported on 6.2% of returns)
Here:
+$1,775
State:
+$24,023
Profit/loss from business: +$4,150 (reported on 12.5% of returns)
Here:
+$4,150
State:
+$11,913
(% of AGI for various income ranges: 2.7% for AGIs below $25k, 1.8% for AGIs $25k-50k, 2.6% for AGIs $50k-75k)
Taxable individual retirement arrangement distribution: $12,180 (reported on 7.8% of returns)
74637:
$12,180
Oklahoma:
$15,242
Total itemized deductions: $22,700 (26% of AGI, reported on 15.6% of returns)
Here:
$22,700
State:
$24,882
Here:
26.1% of AGI
State:
18.8% of AGI
(% of AGI for various income ranges: 16.7% for AGIs below $25k, 14.8% for AGIs $50k-75k, 12.5% for AGIs $100k-200k)
Charity contributions: $3,571 (reported on 10.9% of returns)
Here:
$3,571
State:
$6,591
Taxes paid: $4,110 (reported on 15.6% of returns)
74637:
$4,110
State:
$7,196
(% of AGI for various income ranges: 1.3% for AGIs below $25k, 2.8% for AGIs $50k-75k, 3.0% for AGIs $100k-200k)
Earned income credit: $2,318 (reported on 26.6% of returns)
Here:
$2,318
State:
$2,354
(% of AGI for various income ranges: 8.1% for AGIs below $25k, 1.9% for AGIs $25k-50k)
Percentage of individuals using paid preparers for their 2012 taxes: 67.2%
Here:
67%
State:
56%
(% for various income ranges: 60.7% for AGIs below $25k, 68.8% for AGIs $25k-50k, 66.7% for AGIs $50k-75k, 83.3% for AGIs $75k-100k, 80.0% for AGIs $100k-200k)
Averages for the 2004 tax year for zip code 74637, filed in 2005:
Average Adjusted Gross Income (AGI) in 2004: $28,273 (Individual Income Tax Returns)
Here:
$28,273
State:
$41,245
Salary/wage: $26,719 (reported on 83.5% of returns)
Here:
$26,719
State:
$35,318
(% of AGI for various income ranges: 148.2% for AGIs below $10k, 78.4% for AGIs $10k-25k, 80.7% for AGIs $25k-50k, 75.7% for AGIs $50k-75k, 87.4% for AGIs $75k-100k, 61.8% for AGIs over 100k)
Taxable interest for individuals: $1,345 (reported on 39.3% of returns)
This zip code:
$1,345
Oklahoma:
$1,745
(% of AGI for various income ranges: 12.3% for AGIs below $10k, 3.2% for AGIs $10k-25k, 1.4% for AGIs $25k-50k, 1.5% for AGIs $50k-75k, 0.1% for AGIs $75k-100k, 0.8% for AGIs over 100k)
Taxable dividends: $1,190 (reported on 11.0% of returns)
Here:
$1,190
State:
$2,920
(% of AGI for various income ranges: 1.4% for AGIs below $10k, 0.3% for AGIs $10k-25k, 0.2% for AGIs $25k-50k, 1.2% for AGIs $50k-75k, 0.2% for AGIs $75k-100k)
Net capital gain/loss: +$1,258 (reported on 12.4% of returns)
Here:
+$1,258
State:
+$10,653
(% of AGI for various income ranges: -3.1% for AGIs below $10k, 0.6% for AGIs $10k-25k, 0.0% for AGIs $25k-50k, 1.6% for AGIs $50k-75k, 1.4% for AGIs $75k-100k)
Profit/loss from business: +$3,983 (reported on 16.8% of returns)
Here:
+$3,983
State:
+$8,532
(% of AGI for various income ranges: -2.7% for AGIs below $10k, 4.6% for AGIs $10k-25k, 2.5% for AGIs $25k-50k, 2.4% for AGIs $50k-75k, 1.5% for AGIs over 100k)
Total itemized deductions: $14,510 (23% of AGI, reported on 14.3% of returns)
Here:
$14,510
State:
$17,093
Here:
23.5% of AGI
State:
20.5% of AGI
(% of AGI for various income ranges: 5.6% for AGIs $10k-25k, 6.9% for AGIs $25k-50k, 7.1% for AGIs $50k-75k, 9.4% for AGIs $75k-100k, 10.9% for AGIs over 100k)
Charity contributions deductions: $2,890 (4% of AGI, reported on 11.5% of returns)
Here:
$2,890
State:
$4,240
Here:
4.2% of AGI
State:
4.8% of AGI
(% of AGI for various income ranges: 1.4% for AGIs $25k-50k, 1.3% for AGIs $50k-75k, 1.5% for AGIs $75k-100k, 2.2% for AGIs over 100k)
Total tax: $3,650 (reported on 63.9% of returns)
74637:
$3,650
State:
$6,542
(% of AGI for various income ranges: 2.9% for AGIs below $10k, 3.7% for AGIs $10k-25k, 5.7% for AGIs $25k-50k, 8.9% for AGIs $50k-75k, 10.6% for AGIs $75k-100k, 18.0% for AGIs over 100k)
Earned income credit: $1,720 (reported on 25.5% of returns)
Here:
$1,720
State:
$1,830
Percentage of individuals using paid preparers for their 2004 taxes: 71.9%
Here:
72%
State:
63%
(% for various income ranges: 67.6% for AGIs below $10k, 70.1% for AGIs $10k-25k, 75.4% for AGIs $25k-50k, 73.4% for AGIs $50k-75k, 83.3% for AGIs $75k-100k, 84.2% for AGIs over 100k)
Household received Food Stamps/SNAP in the past 12 months: 120 Household did not receive Food Stamps/SNAP in the past 12 months: 540
Women who had a birth in the past 12 months: 14 (3 now married, 10 unmarried) Women who did not have a birth in the past 12 months: 263 (140 now married, 123 unmarried)
Housing units in zip code 74637 with a mortgage: 88 Median monthly owner costs for units with a mortgage: $868 Median monthly owner costs for units without a mortgage: $389
Residents with income below the poverty level in 2022:
This zip code:
18.7%
Whole state:
15.7%
Residents with income below 50% of the poverty level in 2022:
This zip code:
9.2%
Whole state:
8.3%
Median number of rooms in houses and condos:
Here:
6.1
State:
6.1
Median number of rooms in apartments:
Here:
5.5
State:
4.5
Notable locations in this zip code not listed on our city pages
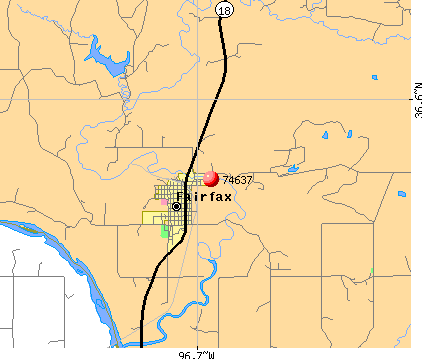
Notable locations in zip code 74637: Kah-Wah-C Golf Course (A), Little Chief Rural Fire Company (B), Grayhorse Fire Protection (C), Fairfax Volunteer Fire Department (D), Little Chief Rural Fire Company Substation (E). Display/hide their locations on the map
Churches in zip code 74637 include: Christian Church (A), First Osage Baptist Church (B), Church of Nazarene (C), First United Methodist Church (D), New Hope Christian Fellowship Church (E), Sweet Home Baptist Church (F). Display/hide their locations on the map
Reservoirs: Fairfax City Lake (A), Oknoname 113109 Reservoir (B), Oknoname 113108 Reservoir (C), Oknoname 113107 Reservoir (D), Oknoname 113106 Reservoir (E), Oknoname 13901 Reservoir (F). Display/hide their locations on the map
Creeks: Wild Horse Creek (A), Wild Creek (B), Tate Creek (C), Clear Creek (D), Solomon Creek (E), Salt Creek (F), Lucy Creek (G), Lost Man Creek (H), Little Chief Creek (I). Display/hide their locations on the map
In group quarters: 35 (-1 institutionalized population)
Size of family households: 223 2-persons, 111 3-persons, 76 4-persons, 26 5-persons, 3 6-persons, 7 7-or-more-persons
Size of nonfamily households: 184 1-person, 23 2-persons
151 married couples with children.
125 single-parent households (25 men, 100 women).
97.5% of residents of 74637 zip code speak English at home.
1.2% of residents speak Spanish at home (100% very well).
0.3% of residents speak other Indo-European language at home (100% very well).
0.2% of residents speak Asian or Pacific Island language at home (100% very well).
0.7% of residents speak other language at home (100% very well).
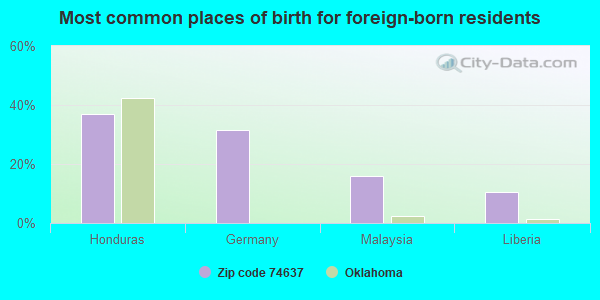
Foreign born population: 19 (1.2%) (30.1% of them are naturalized citizens)
This zip code:
1.2%
Whole state:
6.0%
37%Honduras
32%Germany
16%Malaysia
11%Liberia
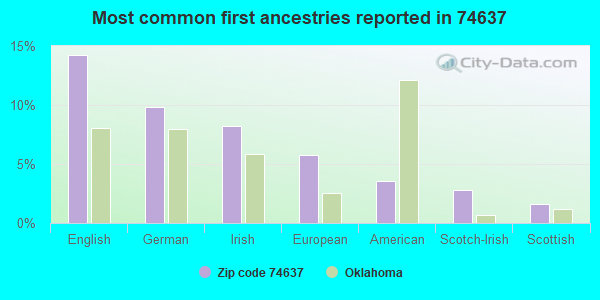
14%English
10%German
8%Irish
6%European
4%American
3%Scotch-Irish
2%Scottish
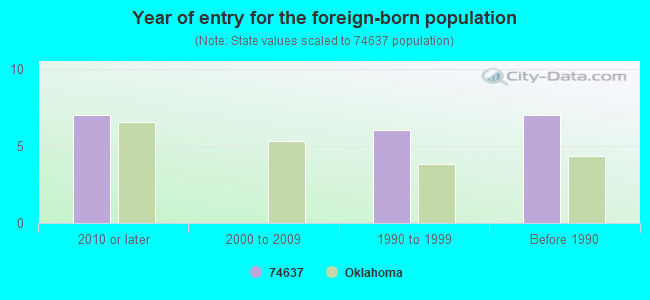
Year of entry for the foreign-born population
72010 or later
02000 to 2009
61990 to 1999
7Before 1990
Facilities with environmental interests located in this zip code:
CRH OIL CO (WELL NO. 3, OS4220, SW/4, SEC. 36, T25 N, R6 E in FAIRFAX, OK)
(Integrated Compliance Information System) - ICIS-06-2001-0031, FORMAL ENFORCEMENT ACTION, ICIS-06-2001-0178, ENFORCEMENT/COMPLIANCE ACTIVITY Business SIC classification: CRUDE PETROLEUM AND NATURAL GAS
CRH OIL CO (WELL NO. 2B, OS3625, SE/4, SEC. 2, T24 N, R6 E in FAIRFAX, OK)
(Integrated Compliance Information System) - ICIS-06-2001-0031, FORMAL ENFORCEMENT ACTION Business SIC classification: CRUDE PETROLEUM AND NATURAL GAS
D & P TANK SVC (150 W MAPLE in FAIRFAX, OK) . Tribal Land
FAIRFAX PUBLIC WORKS AUTH (150 E ELM in FAIRFAX, OK)
National Pollutant Discharge Elimination System NON-MAJOR (Tracking pollutant discharge elimination systems) - permit Business SIC classification: SEWERAGE SYSTEMS
LUMEN MIDSTREAM PAR/GRAY HORSE GAS PLT (2 MILES E OF GRAY HORSE in FAIRFAX, OK)
AIR MINOR (AIRS/AFS) Business SIC classification: NATURAL GAS LIQUIDS
Housing units lacking complete plumbing facilities: 16.6% Housing units lacking complete kitchen facilities: 15.1%
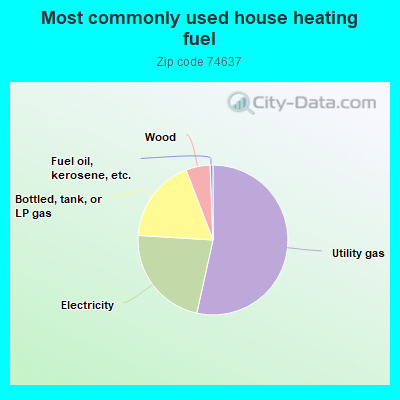
53.2%Utility gas
22.4%Electricity
18.1%Bottled, tank, or LP gas
5.2%Wood
0.6%Fuel oil, kerosene, etc.
Population in 1990: 2,307.
Place of birth for U.S.-born residents:
This state: 1,174
Northeast: 24
Midwest: 137
South: 181
West: 66
61% of the 74637 zip code residents lived in the same house 5 years ago. Out of people who lived in different houses, 67% lived in this county. Out of people who lived in different counties, 50% lived in Oklahoma.
94% of the 74637 zip code residents lived in the same house 1 year ago. Out of people who lived in different houses, 28% moved from this county. Out of people who lived in different houses, 35% moved from different county within same state. Out of people who lived in different houses, 51% moved from different state.
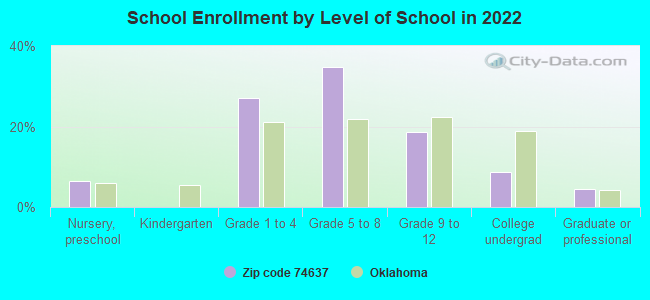
Private vs. public school enrollment:
Students in private schools in grades 1 to 8 (elementary and middle school): 17
Here:
9.7%
Oklahoma:
11.7%
Students in private schools in grades 9 to 12 (high school):
Here:
0.0%
Oklahoma:
11.7%
Students in private undergraduate colleges: 6
Here:
26.7%
Oklahoma:
19.3%
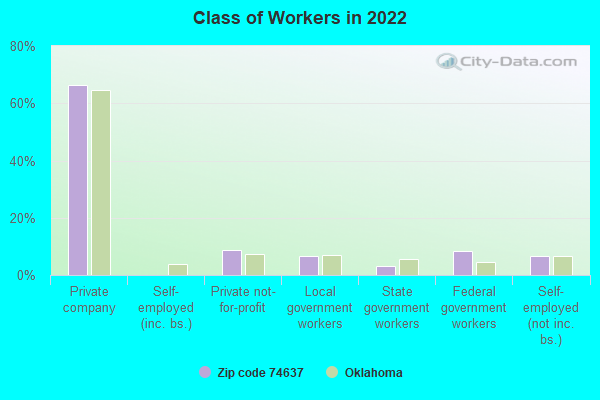
Occupation by median earnings in the past 12 months ($)
78,513Health diagnosing and treating practitioners and other technical occupations
66,891Transportation occupations
51,304Management occupations
50,466Production occupations
44,678Community and social service occupations
40,547Office and administrative support occupations
Top industries in this zip code by the number of employees in 2005:
Health Care and Social Assistance: Nursing Care Facilities (50-99 employees: 1 establishment, 1-4 employees: 1 establishment)
Finance and Insurance: Commercial Banking (20-49: 1)
Accommodation and Food Services: Full-Service Restaurants (10-19: 2, 1-4: 1)
Utilities: Electric Power Distribution (10-19: 1)
Accommodation and Food Services: Limited-Service Restaurants (5-9: 2)
Health Care and Social Assistance: Offices of Physicians (except Mental Health Specialists) (5-9: 1, 1-4: 1)
People in group quarters in 2010:
34 people in nursing facilities/skilled-nursing facilities
People in group quarters in 2000:
40 people in nursing homes
Fatal accident statistics in 2010:
Fatal accident count: 2
Vehicles involved in fatal accidents: 2
Fatal accidents caused by drunken drivers: 2
Fatalities: 2
Persons involved in fatal accidents: 2
Pedestrians involved in fatal accidents: 0
Home Mortgage Disclosure Act Aggregated Statistics For Year 2009 (Based on 2 partial tracts)
A) FHA, FSA/RHS & VA Home Purchase Loans
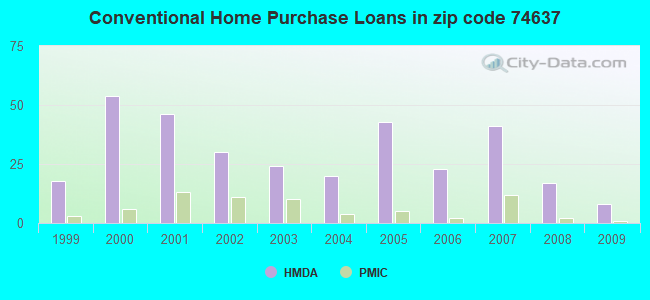
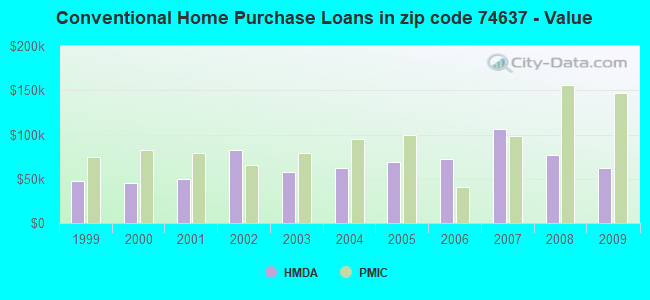
B) Conventional Home Purchase Loans
C) Refinancings
D) Home Improvement Loans
F) Non-occupant Loans on < 5 Family Dwellings (A B C & D)
G) Loans On Manufactured Home Dwelling (A B C & D)
Number
Average Value
Number
Average Value
Number
Average Value
Number
Average Value
Number
Average Value
Number
Average Value
LOANS ORIGINATED
11
$100,250
8
$62,636
40
$79,089
4
$56,240
5
$23,642
4
$63,518
APPLICATIONS APPROVED, NOT ACCEPTED
1
$191,440
1
$13,230
2
$69,695
0
$0
1
$13,230
0
$0
APPLICATIONS DENIED
3
$59,990
4
$26,688
16
$93,238
4
$27,128
0
$0
3
$79,397
APPLICATIONS WITHDRAWN
2
$87,780
3
$42,640
6
$69,253
1
$40,580
1
$27,350
2
$40,580
FILES CLOSED FOR INCOMPLETENESS
1
$57,340
0
$0
1
$44,110
0
$0
0
$0
0
$0
Aggregated Statistics For Year 2008 (Based on 2 partial tracts)
A) FHA, FSA/RHS & VA Home Purchase Loans
B) Conventional Home Purchase Loans
C) Refinancings
D) Home Improvement Loans
F) Non-occupant Loans on < 5 Family Dwellings (A B C & D)
G) Loans On Manufactured Home Dwelling (A B C & D)
Number
Average Value
Number
Average Value
Number
Average Value
Number
Average Value
Number
Average Value
Number
Average Value
LOANS ORIGINATED
7
$86,330
17
$77,218
30
$84,603
11
$42,746
3
$40,287
5
$36,700
APPLICATIONS APPROVED, NOT ACCEPTED
0
$0
3
$124,390
7
$101,327
3
$35,287
0
$0
3
$37,640
APPLICATIONS DENIED
3
$123,507
5
$62,284
28
$95,719
5
$42,522
2
$98,365
4
$68,590
APPLICATIONS WITHDRAWN
1
$178,200
0
$0
5
$96,160
3
$117,627
0
$0
0
$0
FILES CLOSED FOR INCOMPLETENESS
0
$0
1
$58,230
1
$74,990
0
$0
0
$0
0
$0
Aggregated Statistics For Year 2007 (Based on 2 partial tracts)
A) FHA, FSA/RHS & VA Home Purchase Loans
B) Conventional Home Purchase Loans
C) Refinancings
D) Home Improvement Loans
F) Non-occupant Loans on < 5 Family Dwellings (A B C & D)
G) Loans On Manufactured Home Dwelling (A B C & D)
Number
Average Value
Number
Average Value
Number
Average Value
Number
Average Value
Number
Average Value
Number
Average Value
LOANS ORIGINATED
7
$87,969
41
$106,122
23
$82,275
17
$35,184
6
$57,197
11
$79,398
APPLICATIONS APPROVED, NOT ACCEPTED
0
$0
2
$48,960
2
$36,610
4
$28,230
0
$0
1
$28,230
APPLICATIONS DENIED
0
$0
15
$66,694
19
$78,330
13
$38,545
1
$22,060
8
$57,564
APPLICATIONS WITHDRAWN
0
$0
2
$42,345
9
$105,472
4
$56,240
1
$40,580
3
$59,400
FILES CLOSED FOR INCOMPLETENESS
0
$0
1
$72,340
3
$90,280
0
$0
0
$0
0
$0
Aggregated Statistics For Year 2006 (Based on 2 partial tracts)
A) FHA, FSA/RHS & VA Home Purchase Loans
B) Conventional Home Purchase Loans
C) Refinancings
D) Home Improvement Loans
F) Non-occupant Loans on < 5 Family Dwellings (A B C & D)
G) Loans On Manufactured Home Dwelling (A B C & D)
Number
Average Value
Number
Average Value
Number
Average Value
Number
Average Value
Number
Average Value
Number
Average Value
LOANS ORIGINATED
7
$82,674
23
$72,724
27
$72,961
11
$25,183
4
$27,790
3
$58,227
APPLICATIONS APPROVED, NOT ACCEPTED
1
$56,460
4
$48,742
4
$54,698
4
$10,365
0
$0
4
$62,858
APPLICATIONS DENIED
3
$41,463
14
$60,305
34
$77,582
17
$41,152
1
$46,760
12
$83,000
APPLICATIONS WITHDRAWN
1
$95,280
3
$77,927
14
$83,746
3
$41,170
2
$30,875
0
$0
FILES CLOSED FOR INCOMPLETENESS
1
$32,640
1
$36,170
5
$74,810
0
$0
0
$0
0
$0
Aggregated Statistics For Year 2005 (Based on 2 partial tracts)
A) FHA, FSA/RHS & VA Home Purchase Loans
B) Conventional Home Purchase Loans
C) Refinancings
D) Home Improvement Loans
F) Non-occupant Loans on < 5 Family Dwellings (A B C & D)
G) Loans On Manufactured Home Dwelling (A B C & D)
Number
Average Value
Number
Average Value
Number
Average Value
Number
Average Value
Number
Average Value
Number
Average Value
LOANS ORIGINATED
3
$57,637
43
$68,750
32
$73,085
10
$15,086
11
$23,498
11
$45,313
APPLICATIONS APPROVED, NOT ACCEPTED
0
$0
8
$55,689
3
$64,693
0
$0
0
$0
6
$59,255
APPLICATIONS DENIED
1
$99,690
23
$55,809
36
$67,880
5
$21,350
0
$0
11
$46,596
APPLICATIONS WITHDRAWN
0
$0
7
$74,987
20
$92,322
3
$215,550
0
$0
1
$46,760
FILES CLOSED FOR INCOMPLETENESS
0
$0
0
$0
4
$104,320
0
$0
0
$0
0
$0
Aggregated Statistics For Year 2004 (Based on 2 partial tracts)
A) FHA, FSA/RHS & VA Home Purchase Loans
B) Conventional Home Purchase Loans
C) Refinancings
D) Home Improvement Loans
F) Non-occupant Loans on < 5 Family Dwellings (A B C & D)
G) Loans On Manufactured Home Dwelling (A B C & D)
Number
Average Value
Number
Average Value
Number
Average Value
Number
Average Value
Number
Average Value
Number
Average Value
LOANS ORIGINATED
2
$60,870
20
$61,710
46
$62,732
10
$62,372
10
$22,761
4
$68,150
APPLICATIONS APPROVED, NOT ACCEPTED
0
$0
11
$66,325
11
$60,070
0
$0
1
$31,760
8
$54,918
APPLICATIONS DENIED
1
$26,470
11
$68,972
33
$66,593
3
$14,117
4
$31,538
7
$50,411
APPLICATIONS WITHDRAWN
0
$0
4
$29,995
19
$66,815
3
$32,347
2
$46,755
1
$44,990
FILES CLOSED FOR INCOMPLETENESS
0
$0
0
$0
2
$55,580
0
$0
0
$0
0
$0
Aggregated Statistics For Year 2003 (Based on 2 partial tracts)
A) FHA, FSA/RHS & VA Home Purchase Loans
B) Conventional Home Purchase Loans
C) Refinancings
D) Home Improvement Loans
F) Non-occupant Loans on < 5 Family Dwellings (A B C & D)
Number
Average Value
Number
Average Value
Number
Average Value
Number
Average Value
Number
Average Value
LOANS ORIGINATED
5
$96,336
24
$57,233
64
$89,722
14
$21,866
4
$15,218
APPLICATIONS APPROVED, NOT ACCEPTED
0
$0
2
$29,555
17
$85,729
1
$31,760
1
$8,820
APPLICATIONS DENIED
0
$0
9
$34,798
54
$66,002
10
$17,820
5
$32,642
APPLICATIONS WITHDRAWN
3
$112,920
7
$41,967
22
$64,441
2
$30,435
0
$0
FILES CLOSED FOR INCOMPLETENESS
0
$0
0
$0
6
$75,722
1
$74,990
0
$0
Aggregated Statistics For Year 2002 (Based on 2 partial tracts)
A) FHA, FSA/RHS & VA Home Purchase Loans
B) Conventional Home Purchase Loans
C) Refinancings
D) Home Improvement Loans
F) Non-occupant Loans on < 5 Family Dwellings (A B C & D)
Number
Average Value
Number
Average Value
Number
Average Value
Number
Average Value
Number
Average Value
LOANS ORIGINATED
4
$85,132
30
$82,368
45
$75,869
7
$13,233
6
$27,937
APPLICATIONS APPROVED, NOT ACCEPTED
1
$118,210
4
$43,008
8
$124,390
1
$44,990
0
$0
APPLICATIONS DENIED
1
$109,390
12
$39,184
23
$68,658
9
$31,857
0
$0
APPLICATIONS WITHDRAWN
0
$0
2
$51,610
22
$59,508
0
$0
0
$0
FILES CLOSED FOR INCOMPLETENESS
0
$0
0
$0
4
$64,400
0
$0
0
$0
Aggregated Statistics For Year 2001 (Based on 2 partial tracts)
A) FHA, FSA/RHS & VA Home Purchase Loans
B) Conventional Home Purchase Loans
C) Refinancings
D) Home Improvement Loans
F) Non-occupant Loans on < 5 Family Dwellings (A B C & D)
Number
Average Value
Number
Average Value
Number
Average Value
Number
Average Value
Number
Average Value
LOANS ORIGINATED
4
$68,812
46
$49,346
44
$65,483
5
$13,232
5
$12,350
APPLICATIONS APPROVED, NOT ACCEPTED
0
$0
9
$38,719
1
$9,700
1
$6,180
0
$0
APPLICATIONS DENIED
0
$0
11
$35,930
17
$53,918
4
$14,778
0
$0
APPLICATIONS WITHDRAWN
0
$0
1
$105,860
18
$61,411
4
$22,275
0
$0
FILES CLOSED FOR INCOMPLETENESS
0
$0
0
$0
4
$41,022
2
$18,965
0
$0
Aggregated Statistics For Year 2000 (Based on 2 partial tracts)
A) FHA, FSA/RHS & VA Home Purchase Loans
B) Conventional Home Purchase Loans
C) Refinancings
D) Home Improvement Loans
E) Loans on Dwellings For 5+ Families
F) Non-occupant Loans on < 5 Family Dwellings (A B C & D)
Number
Average Value
Number
Average Value
Number
Average Value
Number
Average Value
Number
Average Value
Number
Average Value
LOANS ORIGINATED
2
$62,195
54
$45,678
29
$43,958
8
$12,571
1
$705,760
6
$12,498
APPLICATIONS APPROVED, NOT ACCEPTED
1
$22,940
10
$43,581
5
$51,344
3
$8,823
0
$0
0
$0
APPLICATIONS DENIED
1
$34,410
15
$38,405
14
$37,619
7
$14,620
0
$0
2
$35,730
APPLICATIONS WITHDRAWN
0
$0
1
$81,160
11
$52,130
2
$41,905
0
$0
0
$0
FILES CLOSED FOR INCOMPLETENESS
0
$0
1
$88,220
2
$59,990
0
$0
0
$0
0
$0
Aggregated Statistics For Year 1999 (Based on 1 partial tract)
A) FHA, FSA/RHS & VA Home Purchase Loans
B) Conventional Home Purchase Loans
C) Refinancings
D) Home Improvement Loans
F) Non-occupant Loans on < 5 Family Dwellings (A B C & D)
Detailed PMIC statistics for the following Tracts:0105.00
2004 - 2018 National Fire Incident Reporting System (NFIRS) incidents
According to the data from the years 2004 - 2018 the average number of fire incidents per year is 19. The highest number of fire incidents - 34 took place in 2011, and the least - 6 in 2004. The data has a rising trend.
When looking into fire subcategories, the most reports belonged to: Outside Fires (71.4%), and Other (11.8%).
Fire incident types reported to NFIRS in Zip Code 74637


 Nearest zip codes: 74650, 74633, 74058, 74652, 74084, 74035.


 According to the data from the years 2004 - 2018 the average number of fire incidents per year is 19. The highest number of fire incidents - 34 took place in 2011, and the least - 6 in 2004. The data has a rising trend.
 When looking into fire subcategories, the most reports belonged to: Outside Fires (71.4%), and Other (11.8%).