Estimated zip code population in 2022: 4,366 Zip code population in 2010: 4,639 Zip code population in 2000: 4,218
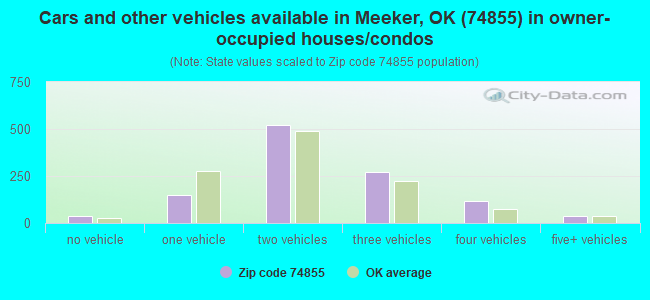
Houses and condos: 1,786 Renter-occupied apartments: 473
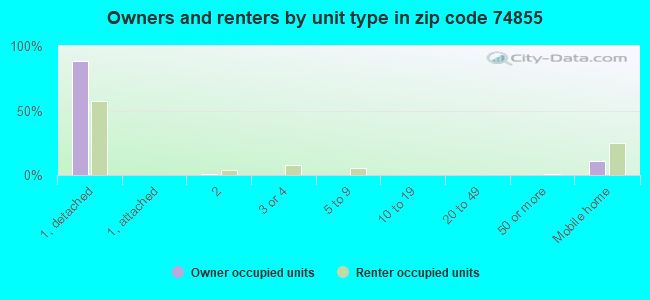
% of renters here:
29%
State:
35%
March 2022 cost of living index in zip code 74855: 79.8 (low, U.S. average is 100)
Land area: 107.1 sq. mi. Water area: 1.9 sq. mi.
Population density: 41 people per square mile
(very low).
OSM Map
General Map
Google Map
MSN Map
OSM Map
General Map
Google Map
MSN Map
OSM Map
General Map
Google Map
MSN Map
OSM Map
General Map
Google Map
MSN Map
Please wait while loading the map...
Real estate property taxes paid for housing units in 2022:
This zip code:
0.5% ($816)
Oklahoma:
0.8% ($1,501)
Median real estate property taxes paid for housing units with mortgages in 2022: $1,396 (0.6%) Median real estate property taxes paid for housing units with no mortgage in 2022: $569 (0.5%)
Business Search- 14 Million verified businesses
Males: 2,198
(50.3%)
Females: 2,168
(49.7%)
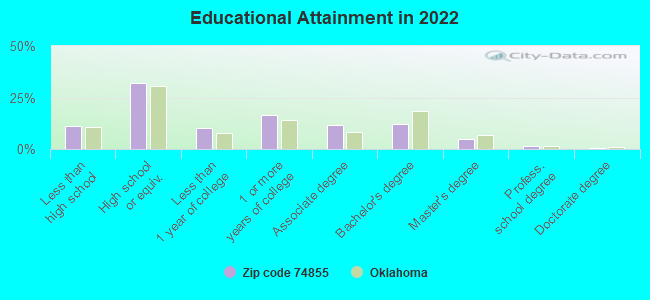
For population 25 years and over in 74855:
High school or higher: 88.1%
Bachelor's degree or higher: 18.6%
Graduate or professional degree: 6.7%
Unemployed: 1.8%
Mean travel time to work (commute): 30.3 minutes
For population 15 years and over in 74855:
Never married: 21.0%
Now married: 60.9%
Separated: 1.1%
Widowed: 5.9%
Divorced: 11.2%
Zip code 74855 compared to state average:
Unemployed percentage below state average.
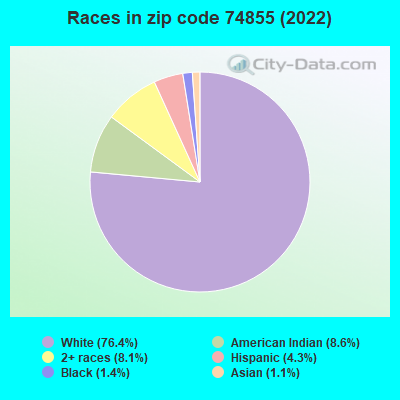
Black race population percentage significantly below state average.
Hispanic race population percentage below state average.
Median age significantly above state average.
Foreign-born population percentage significantly below state average.
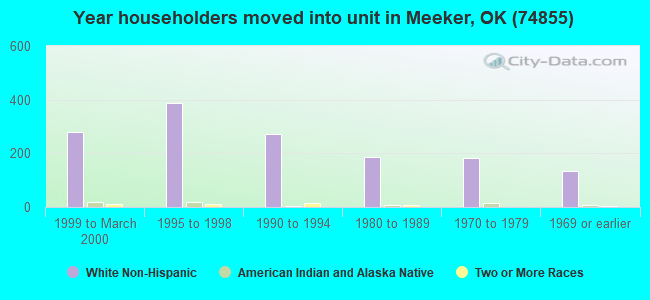
Length of stay since moving in significantly above state average.
Averages for the 2020 tax year for zip code 74855, filed in 2021:
Average Adjusted Gross Income (AGI) in 2020: $54,711 (Individual Income Tax Returns)
Here:
$54,711
State:
$63,060
Salary/wage: $50,777 (reported on 77.8% of returns)
Here:
$50,777
State:
$52,427
(% of AGI for various income ranges: 1083.8% for AGIs below $25k, 3143.3% for AGIs $25k-50k, 6123.9% for AGIs $50k-75k, 9141.3% for AGIs $75k-100k, 14951.8% for AGIs $100k-200k)
Taxable interest for individuals: $911 (reported on 30.8% of returns)
This zip code:
$911
Oklahoma:
$1,603
(% of AGI for various income ranges: 30.8% for AGIs below $25k, 17.2% for AGIs $25k-50k, 58.3% for AGIs $50k-75k, 32.7% for AGIs $75k-100k, 65.9% for AGIs $100k-200k)
Ordinary dividends: $1,833 (reported on 10.6% of returns)
Here:
$1,833
State:
$7,001
(% of AGI for various income ranges: 17.1% for AGIs below $25k, 12.1% for AGIs $25k-50k, 30.9% for AGIs $50k-75k, 28.7% for AGIs $75k-100k, 80.6% for AGIs $100k-200k)
Net capital gain/loss in AGI: +$15,805 (reported on 10.6% of returns)
Here:
+$15,805
State:
+$19,855
(% of AGI for various income ranges: 21.9% for AGIs below $25k, 31.9% for AGIs $25k-50k, 44.8% for AGIs $50k-75k, 180.0% for AGIs $75k-100k, 1590.6% for AGIs $100k-200k)
Profit/loss from business: +$8,953 (reported on 15.2% of returns)
Here:
+$8,953
State:
+$9,904
(% of AGI for various income ranges: 144.0% for AGIs below $25k, 184.0% for AGIs $25k-50k, 160.0% for AGIs $50k-75k, 106.0% for AGIs $75k-100k, 398.2% for AGIs $100k-200k)
Taxable individual retirement arrangement distribution: $14,554 (reported on 6.6% of returns)
74855:
$14,554
Oklahoma:
$20,476
(% of AGI for various income ranges: 70.8% for AGIs below $25k, 101.4% for AGIs $25k-50k, 320.9% for AGIs $50k-75k, 222.4% for AGIs $100k-200k)
Total itemized deductions: $35,014 (reported on 3.5% of returns)
Here:
$35,014
State:
$39,736
(% of AGI for various income ranges: 417.4% for AGIs $50k-75k, 877.1% for AGIs $100k-200k)
Charity contributions: $13,160 (reported on 2.5% of returns)
Here:
$13,160
State:
$17,288
(% of AGI for various income ranges: 387.1% for AGIs $100k-200k)
Taxes paid: $5,400 (reported on 3.5% of returns)
74855:
$5,400
State:
$7,046
(% of AGI for various income ranges: 36.1% for AGIs $50k-75k, 173.5% for AGIs $100k-200k)
Earned income credit: $2,294 (reported on 17.7% of returns)
Here:
$2,294
State:
$2,435
(% of AGI for various income ranges: 86.2% for AGIs below $25k, 90.5% for AGIs $25k-50k)
Percentage of individuals using paid preparers for their 2020 taxes: 94.4%
Here:
94%
State:
94%
(% for various income ranges: 93.8% for AGIs below $25k, 96.2% for AGIs $25k-50k, 93.8% for AGIs $50k-75k, 95.2% for AGIs $75k-100k, 95.8% for AGIs $100k-200k, 75.0% for AGIs over 200k)
Averages for the 2012 tax year for zip code 74855, filed in 2013:
Average Adjusted Gross Income (AGI) in 2012: $46,062 (Individual Income Tax Returns)
Here:
$46,062
State:
$58,581
Salary/wage: $41,739 (reported on 82.7% of returns)
Here:
$41,739
State:
$45,973
(% of AGI for various income ranges: 73.4% for AGIs below $25k, 77.6% for AGIs $25k-50k, 80.4% for AGIs $50k-75k, 77.4% for AGIs $75k-100k, 77.6% for AGIs $100k-200k, 46.6% for AGIs over 200k)
Taxable interest for individuals: $817 (reported on 31.9% of returns)
This zip code:
$817
Oklahoma:
$1,625
(% of AGI for various income ranges: 1.4% for AGIs below $25k, 0.8% for AGIs $25k-50k, 0.5% for AGIs $50k-75k, 0.4% for AGIs $75k-100k, 0.3% for AGIs $100k-200k)
Ordinary dividends: $1,868 (reported on 10.3% of returns)
Here:
$1,868
State:
$6,374
(% of AGI for various income ranges: 0.9% for AGIs below $25k, 0.4% for AGIs $25k-50k, 0.3% for AGIs $50k-75k, 0.3% for AGIs $75k-100k, 0.7% for AGIs $100k-200k)
Net capital gain/loss in AGI: +$3,414 (reported on 7.6% of returns)
Here:
+$3,414
State:
+$24,023
(% of AGI for various income ranges: 0.3% for AGIs below $25k, 0.5% for AGIs $50k-75k, 0.4% for AGIs $75k-100k, 1.7% for AGIs $100k-200k)
Profit/loss from business: +$10,947 (reported on 16.2% of returns)
Here:
+$10,947
State:
+$11,913
(% of AGI for various income ranges: 6.6% for AGIs below $25k, 2.9% for AGIs $25k-50k, 1.4% for AGIs $50k-75k, 3.4% for AGIs $75k-100k, 8.1% for AGIs $100k-200k)
Taxable individual retirement arrangement distribution: $17,662 (reported on 7.0% of returns)
74855:
$17,662
Oklahoma:
$15,242
(% of AGI for various income ranges: 2.5% for AGIs below $25k, 1.9% for AGIs $25k-50k, 3.4% for AGIs $50k-75k, 6.1% for AGIs $100k-200k)
Total itemized deductions: $20,491 (22% of AGI, reported on 18.9% of returns)
Here:
$20,491
State:
$24,882
Here:
22.2% of AGI
State:
18.8% of AGI
(% of AGI for various income ranges: 4.2% for AGIs below $25k, 5.8% for AGIs $25k-50k, 7.9% for AGIs $50k-75k, 10.7% for AGIs $75k-100k, 11.1% for AGIs $100k-200k, 10.9% for AGIs over 200k)
Charity contributions: $4,568 (reported on 15.1% of returns)
Here:
$4,568
State:
$6,591
(% of AGI for various income ranges: 1.4% for AGIs $25k-50k, 1.4% for AGIs $50k-75k, 2.3% for AGIs $75k-100k, 2.6% for AGIs $100k-200k)
Taxes paid: $4,826 (reported on 18.9% of returns)
74855:
$4,826
State:
$7,196
(% of AGI for various income ranges: 0.4% for AGIs below $25k, 0.8% for AGIs $25k-50k, 1.3% for AGIs $50k-75k, 2.1% for AGIs $75k-100k, 3.3% for AGIs $100k-200k, 5.2% for AGIs over 200k)
Earned income credit: $2,285 (reported on 21.6% of returns)
Here:
$2,285
State:
$2,354
(% of AGI for various income ranges: 6.7% for AGIs below $25k, 1.6% for AGIs $25k-50k)
Percentage of individuals using paid preparers for their 2012 taxes: 63.8%
Here:
64%
State:
56%
(% for various income ranges: 59.7% for AGIs below $25k, 60.8% for AGIs $25k-50k, 70.0% for AGIs $50k-75k, 68.8% for AGIs $75k-100k, 71.4% for AGIs $100k-200k, 100.0% for AGIs over 200k)
Averages for the 2004 tax year for zip code 74855, filed in 2005:
Average Adjusted Gross Income (AGI) in 2004: $33,531 (Individual Income Tax Returns)
Here:
$33,531
State:
$41,245
Salary/wage: $33,633 (reported on 83.6% of returns)
Here:
$33,633
State:
$35,318
(% of AGI for various income ranges: 125.9% for AGIs below $10k, 72.5% for AGIs $10k-25k, 84.7% for AGIs $25k-50k, 86.3% for AGIs $50k-75k, 83.6% for AGIs $75k-100k, 83.1% for AGIs over 100k)
Taxable interest for individuals: $816 (reported on 39.4% of returns)
This zip code:
$816
Oklahoma:
$1,745
(% of AGI for various income ranges: 6.1% for AGIs below $10k, 2.4% for AGIs $10k-25k, 0.9% for AGIs $25k-50k, 0.5% for AGIs $50k-75k, 0.5% for AGIs $75k-100k, 0.3% for AGIs over 100k)
Taxable dividends: $964 (reported on 12.1% of returns)
Here:
$964
State:
$2,920
(% of AGI for various income ranges: 1.8% for AGIs below $10k, 0.4% for AGIs $10k-25k, 0.4% for AGIs $25k-50k, 0.2% for AGIs $50k-75k, 0.4% for AGIs $75k-100k, 0.1% for AGIs over 100k)
Net capital gain/loss: +$2,540 (reported on 10.9% of returns)
Here:
+$2,540
State:
+$10,653
(% of AGI for various income ranges: -0.9% for AGIs below $10k, 0.5% for AGIs $10k-25k, 0.8% for AGIs $25k-50k, 0.1% for AGIs $50k-75k, 0.4% for AGIs $75k-100k, 4.5% for AGIs over 100k)
Profit/loss from business: +$3,207 (reported on 17.0% of returns)
Here:
+$3,207
State:
+$8,532
(% of AGI for various income ranges: -0.2% for AGIs below $10k, 7.0% for AGIs $10k-25k, 0.1% for AGIs $25k-50k, 2.2% for AGIs $50k-75k, 0.1% for AGIs $75k-100k, 0.0% for AGIs over 100k)
IRA payment deduction: $2,438 (reported on 0.9% of returns)
74855:
$2,438
Oklahoma:
$3,127
Total itemized deductions: $14,412 (24% of AGI, reported on 25.8% of returns)
Here:
$14,412
State:
$17,093
Here:
23.7% of AGI
State:
20.5% of AGI
(% of AGI for various income ranges: 11.2% for AGIs below $10k, 6.2% for AGIs $10k-25k, 8.5% for AGIs $25k-50k, 13.3% for AGIs $50k-75k, 13.9% for AGIs $75k-100k, 14.4% for AGIs over 100k)
Charity contributions deductions: $3,072 (5% of AGI, reported on 21.5% of returns)
Here:
$3,072
State:
$4,240
Here:
4.9% of AGI
State:
4.8% of AGI
(% of AGI for various income ranges: 1.1% for AGIs $10k-25k, 1.5% for AGIs $25k-50k, 2.4% for AGIs $50k-75k, 2.4% for AGIs $75k-100k, 3.1% for AGIs over 100k)
Total tax: $3,654 (reported on 70.5% of returns)
74855:
$3,654
State:
$6,542
(% of AGI for various income ranges: 3.6% for AGIs below $10k, 3.7% for AGIs $10k-25k, 5.8% for AGIs $25k-50k, 8.0% for AGIs $50k-75k, 10.3% for AGIs $75k-100k, 14.3% for AGIs over 100k)
Earned income credit: $1,963 (reported on 19.6% of returns)
Here:
$1,963
State:
$1,830
Percentage of individuals using paid preparers for their 2004 taxes: 68.4%
Here:
68%
State:
63%
(% for various income ranges: 58.6% for AGIs below $10k, 71.3% for AGIs $10k-25k, 70.0% for AGIs $25k-50k, 74.6% for AGIs $50k-75k, 62.9% for AGIs $75k-100k, 77.1% for AGIs over 100k)
Household received Food Stamps/SNAP in the past 12 months: 262 Household did not receive Food Stamps/SNAP in the past 12 months: 1,352
Women who had a birth in the past 12 months: 30 (27 now married, 3 unmarried) Women who did not have a birth in the past 12 months: 846 (429 now married, 416 unmarried)
Housing units in zip code 74855 with a mortgage: 499 (17 second mortgage) Houses without a mortgage: 7
Median monthly owner costs for units with a mortgage: $1,382 Median monthly owner costs for units without a mortgage: $437
Residents with income below the poverty level in 2022:
This zip code:
10.4%
Whole state:
15.7%
Residents with income below 50% of the poverty level in 2022:
This zip code:
6.6%
Whole state:
8.3%
Median number of rooms in houses and condos:
Here:
6.1
State:
6.1
Median number of rooms in apartments:
Here:
5.0
State:
4.5
Notable locations in this zip code not listed on our city pages
Churches in zip code 74855 include: Mammoth Church (A), Saint Paul Church (B), Hortons Chapel (C), Spring Branch Church (D), Nagowee Church (E), Morning Star Church (F). Display/hide their locations on the map
Cemeteries: Anderson Cemetery (1), Horton Chapel Cemetery (2), New Hope Cemetery (3), Rossville Cemetery (4), Saint Paul Cemetery (5), Sunnyside Cemetery (6). Display/hide their locations on the map
Reservoirs: Quapaw Creek Site 39 Reservoir (A), Quapaw Creek Site 34 Reservoir (B), Quapaw Creek Site 33 Reservoir (C), Quapaw Creek Site 31 Reservoir (D), Quapaw Creek Site 22 Reservoir (E), Quapaw Creek Site 10 Reservoir (F), Quapaw Creek Site 9 Reservoir (G), Quapaw Creek Site 8 Reservoir (H). Display/hide their locations on the map
Creeks: Wildhorse Creek (A), Brush Creek (B), Coon Creek (C), Squaw Creek (D), South Quapaw Creek (E), Sand Creek (F), Green Creek (G). Display/hide their locations on the map
In group quarters: 53 (-1 institutionalized population)
Size of family households: 608 2-persons, 243 3-persons, 225 4-persons, 33 5-persons, 74 6-persons, 6 7-or-more-persons
Size of nonfamily households: 355 1-person, 50 2-persons, 11 3-persons
532 married couples with children.
173 single-parent households (21 men, 152 women).
98.1% of residents of 74855 zip code speak English at home.
1.8% of residents speak Spanish at home (100% very well).
0.2% of residents speak Asian or Pacific Island language at home (88% well, 12% not at all).
0.1% of residents speak other language at home (100% very well).
Foreign born population: 54 (1.3%) (54.7% of them are naturalized citizens)
This zip code:
1.3%
Whole state:
6.0%
41%Honduras
39%Malaysia
6%Japan
6%Barbados
2%Singapore
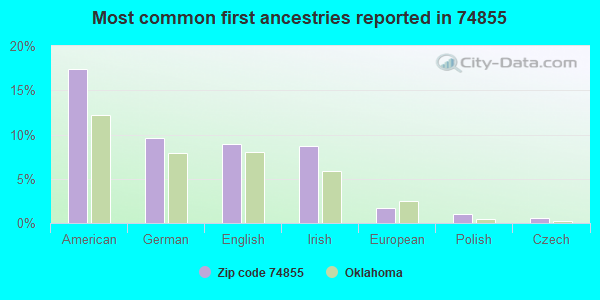
17%American
10%German
9%English
9%Irish
2%European
1%Polish
1%Czech
Year of entry for the foreign-born population
182010 or later
212000 to 2009
391990 to 1999
35Before 1990
Housing units lacking complete plumbing facilities: 5.9% Housing units lacking complete kitchen facilities: 2.9%
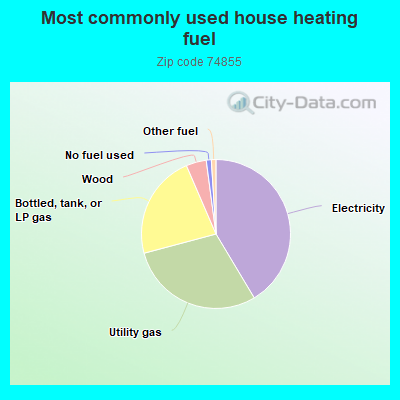
41.5%Electricity
29.5%Utility gas
22.7%Bottled, tank, or LP gas
4.4%Wood
1.1%No fuel used
1.0%Other fuel
Population in 1990: 6,180.
Place of birth for U.S.-born residents:
This state: 3,021
Northeast: 37
Midwest: 346
South: 360
West: 481
57% of the 74855 zip code residents lived in the same house 5 years ago. Out of people who lived in different houses, 47% lived in this county. Out of people who lived in different counties, 50% lived in Oklahoma.
95% of the 74855 zip code residents lived in the same house 1 year ago. Out of people who lived in different houses, 40% moved from this county. Out of people who lived in different houses, 45% moved from different county within same state. Out of people who lived in different houses, 25% moved from different state.
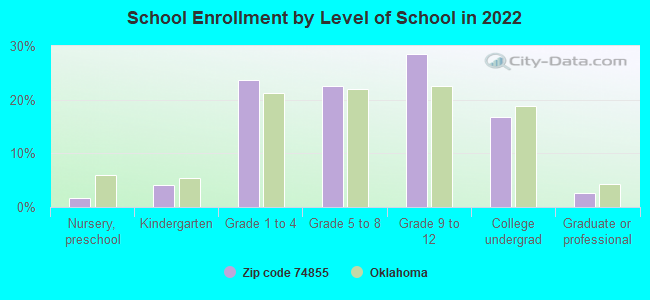
Private vs. public school enrollment:
Students in private schools in grades 1 to 8 (elementary and middle school): 14
Here:
3.3%
Oklahoma:
11.7%
Students in private schools in grades 9 to 12 (high school): 41
Here:
15.5%
Oklahoma:
11.7%
Students in private undergraduate colleges: 29
Here:
19.0%
Oklahoma:
19.3%
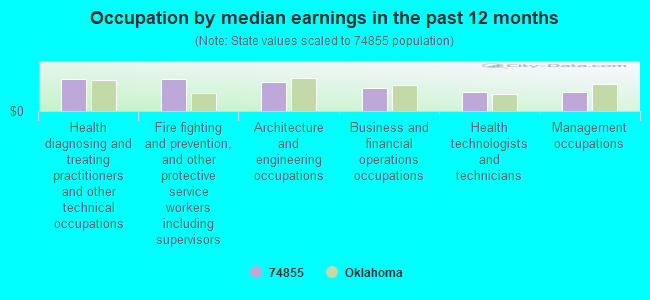
Occupation by median earnings in the past 12 months ($)
100,098Health diagnosing and treating practitioners and other technical occupations
99,425Fire fighting and prevention, and other protective service workers including supervisors
91,885Architecture and engineering occupations
72,256Business and financial operations occupations
58,575Health technologists and technicians
58,393Management occupations
Top industries in this zip code by the number of employees in 2005:
Health Care and Social Assistance: Nursing Care Facilities (50-99 employees: 1 establishment)
Construction: Oil and Gas Pipeline and Related Structures Construction (20-49: 1)
Other Services (except Public Administration): Religious Organizations (5-9: 3, 1-4: 4)
Construction: Site Preparation Contractors (10-19: 1, 5-9: 1, 1-4: 2)
Health Care and Social Assistance: Child Day Care Services (10-19: 1, 1-4: 2)
Accommodation and Food Services: Full-Service Restaurants (10-19: 1, 1-4: 1)
Wholesale Trade: Metal Service Centers and Other Metal Merchant Wholesalers (10-19: 1, 1-4: 1)
Professional, Scientific, and Technical Services: Surveying and Mapping (except Geophysical) Services (10-19: 1)
People in group quarters in 2010:
44 people in nursing facilities/skilled-nursing facilities
People in group quarters in 2000:
61 people in other noninstitutional group quarters
5 people in nursing homes
Fatal accident statistics in 2014:
Fatal accident count: 2
Vehicles involved in fatal accidents: 4
Fatal accidents caused by drunken drivers: 0
Fatalities: 3
Persons involved in fatal accidents: 5
Pedestrians involved in fatal accidents: 0
Fatal accident statistics in 2011:
Fatal accident count: 1
Vehicles involved in fatal accidents: 2
Fatal accidents caused by drunken drivers: 1
Fatalities: 1
Persons involved in fatal accidents: 3
Pedestrians involved in fatal accidents: 0
Home Mortgage Disclosure Act Aggregated Statistics For Year 2009 (Based on 2 partial tracts)
A) FHA, FSA/RHS & VA Home Purchase Loans
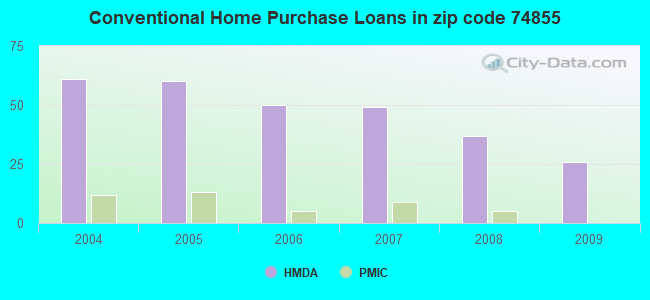
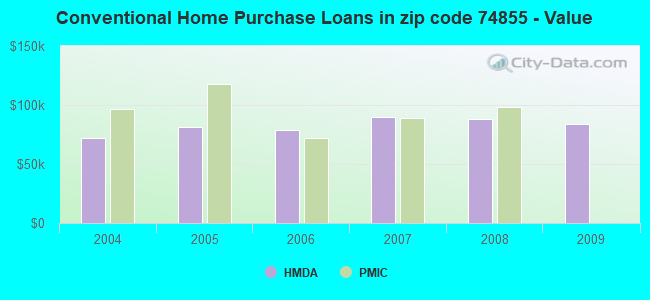
B) Conventional Home Purchase Loans
C) Refinancings
D) Home Improvement Loans
F) Non-occupant Loans on < 5 Family Dwellings (A B C & D)
G) Loans On Manufactured Home Dwelling (A B C & D)
Number
Average Value
Number
Average Value
Number
Average Value
Number
Average Value
Number
Average Value
Number
Average Value
LOANS ORIGINATED
13
$136,871
26
$83,789
79
$102,725
33
$26,534
11
$71,305
24
$39,368
APPLICATIONS APPROVED, NOT ACCEPTED
3
$62,187
4
$108,325
11
$73,310
1
$6,020
1
$49,150
2
$65,195
APPLICATIONS DENIED
2
$58,675
7
$102,020
27
$134,848
10
$29,488
2
$50,650
8
$43,004
APPLICATIONS WITHDRAWN
2
$83,750
2
$72,715
13
$74,762
4
$47,642
1
$80,240
3
$40,790
FILES CLOSED FOR INCOMPLETENESS
0
$0
0
$0
2
$152,955
0
$0
0
$0
0
$0
Aggregated Statistics For Year 2008 (Based on 2 partial tracts)
A) FHA, FSA/RHS & VA Home Purchase Loans
B) Conventional Home Purchase Loans
C) Refinancings
D) Home Improvement Loans
E) Loans on Dwellings For 5+ Families
F) Non-occupant Loans on < 5 Family Dwellings (A B C & D)
G) Loans On Manufactured Home Dwelling (A B C & D)
Number
Average Value
Number
Average Value
Number
Average Value
Number
Average Value
Number
Average Value
Number
Average Value
Number
Average Value
LOANS ORIGINATED
14
$95,571
37
$88,264
83
$85,146
38
$27,134
1
$144,430
12
$41,458
27
$48,553
APPLICATIONS APPROVED, NOT ACCEPTED
1
$189,570
11
$49,055
16
$108,324
6
$31,762
0
$0
1
$47,140
10
$53,560
APPLICATIONS DENIED
3
$85,253
18
$62,242
35
$95,314
19
$37,428
0
$0
3
$47,140
23
$56,255
APPLICATIONS WITHDRAWN
1
$137,410
6
$93,780
16
$82,434
3
$75,893
0
$0
0
$0
2
$76,230
FILES CLOSED FOR INCOMPLETENESS
1
$90,270
0
$0
7
$105,029
0
$0
0
$0
0
$0
1
$90,270
Aggregated Statistics For Year 2007 (Based on 2 partial tracts)
A) FHA, FSA/RHS & VA Home Purchase Loans
B) Conventional Home Purchase Loans
C) Refinancings
D) Home Improvement Loans
F) Non-occupant Loans on < 5 Family Dwellings (A B C & D)
G) Loans On Manufactured Home Dwelling (A B C & D)
Number
Average Value
Number
Average Value
Number
Average Value
Number
Average Value
Number
Average Value
Number
Average Value
LOANS ORIGINATED
11
$105,315
49
$89,902
60
$72,834
40
$28,510
14
$45,135
23
$44,307
APPLICATIONS APPROVED, NOT ACCEPTED
0
$0
6
$47,142
10
$84,653
5
$37,712
0
$0
5
$74,022
APPLICATIONS DENIED
1
$94,280
20
$62,788
43
$89,943
22
$34,649
4
$30,340
19
$50,519
APPLICATIONS WITHDRAWN
3
$106,317
3
$64,860
26
$98,294
4
$47,892
1
$17,050
3
$25,410
FILES CLOSED FOR INCOMPLETENESS
0
$0
1
$64,190
3
$96,287
2
$32,595
0
$0
0
$0
Aggregated Statistics For Year 2006 (Based on 2 partial tracts)
A) FHA, FSA/RHS & VA Home Purchase Loans
B) Conventional Home Purchase Loans
C) Refinancings
D) Home Improvement Loans
F) Non-occupant Loans on < 5 Family Dwellings (A B C & D)
G) Loans On Manufactured Home Dwelling (A B C & D)
Number
Average Value
Number
Average Value
Number
Average Value
Number
Average Value
Number
Average Value
Number
Average Value
LOANS ORIGINATED
16
$113,590
50
$78,996
56
$74,455
38
$24,442
11
$23,525
27
$45,098
APPLICATIONS APPROVED, NOT ACCEPTED
2
$57,170
12
$60,263
18
$88,319
0
$0
0
$0
13
$59,408
APPLICATIONS DENIED
3
$79,570
32
$58,268
51
$88,775
40
$36,208
3
$62,853
25
$45,215
APPLICATIONS WITHDRAWN
2
$72,215
5
$84,654
34
$102,955
5
$39,518
0
$0
2
$52,655
FILES CLOSED FOR INCOMPLETENESS
0
$0
1
$21,060
4
$102,055
3
$73,887
0
$0
0
$0
Aggregated Statistics For Year 2005 (Based on 2 partial tracts)
A) FHA, FSA/RHS & VA Home Purchase Loans
B) Conventional Home Purchase Loans
C) Refinancings
D) Home Improvement Loans
F) Non-occupant Loans on < 5 Family Dwellings (A B C & D)
G) Loans On Manufactured Home Dwelling (A B C & D)
Number
Average Value
Number
Average Value
Number
Average Value
Number
Average Value
Number
Average Value
Number
Average Value
LOANS ORIGINATED
13
$101,303
60
$81,494
83
$77,944
29
$23,657
7
$66,054
33
$57,627
APPLICATIONS APPROVED, NOT ACCEPTED
2
$43,130
25
$65,436
9
$104,312
0
$0
0
$0
22
$53,569
APPLICATIONS DENIED
2
$93,280
43
$64,309
70
$88,149
25
$29,488
6
$34,102
39
$44,106
APPLICATIONS WITHDRAWN
1
$125,370
12
$64,861
35
$95,342
5
$157,470
1
$108,320
6
$62,353
FILES CLOSED FOR INCOMPLETENESS
1
$88,260
1
$60,180
3
$55,833
0
$0
0
$0
1
$88,260
Aggregated Statistics For Year 2004 (Based on 2 partial tracts)
A) FHA, FSA/RHS & VA Home Purchase Loans
B) Conventional Home Purchase Loans
C) Refinancings
D) Home Improvement Loans
F) Non-occupant Loans on < 5 Family Dwellings (A B C & D)
G) Loans On Manufactured Home Dwelling (A B C & D)
Detailed PMIC statistics for the following Tracts:9814.00
2002 - 2018 National Fire Incident Reporting System (NFIRS) incidents
According to the data from the years 2002 - 2018 the average number of fire incidents per year is 51. The highest number of fires - 85 took place in 2006, and the least - 16 in 2002. The data has an increasing trend.
When looking into fire subcategories, the most incidents belonged to: Outside Fires (72.0%), and Structure Fires (17.1%).
Fire incident types reported to NFIRS in Zip Code 74855

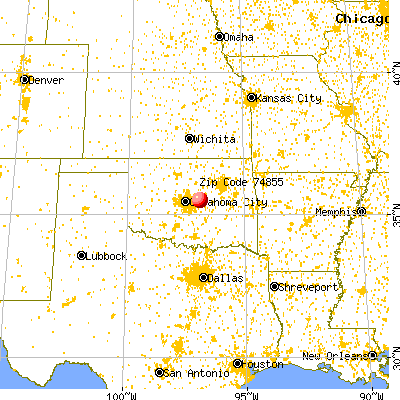


 Nearest zip codes: 74804, 74869, 74834, 74864, 74851, 74801.
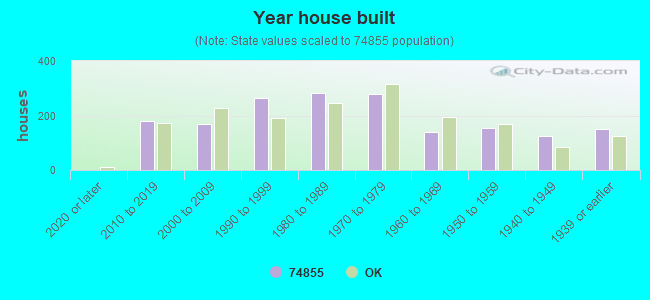


 According to the data from the years 2002 - 2018 the average number of fire incidents per year is 51. The highest number of fires - 85 took place in 2006, and the least - 16 in 2002. The data has an increasing trend.
 When looking into fire subcategories, the most incidents belonged to: Outside Fires (72.0%), and Structure Fires (17.1%).