Estimated zip code population in 2022: 10,187 Zip code population in 2010: 8,611 Zip code population in 2000: 7,699
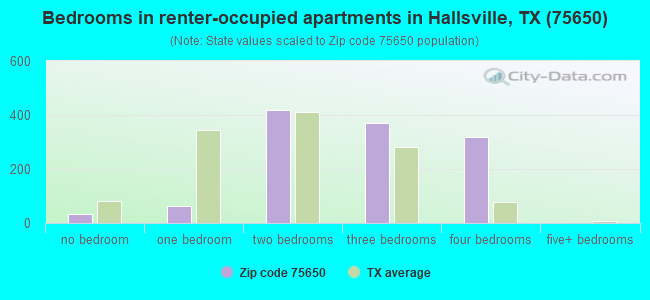
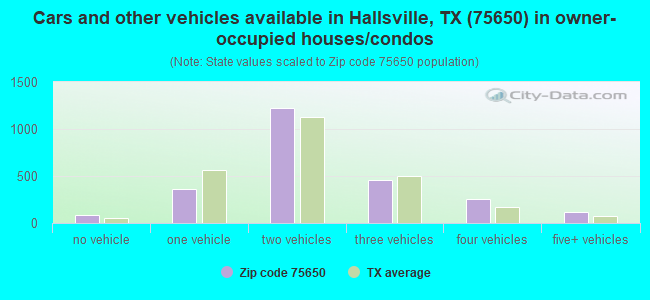
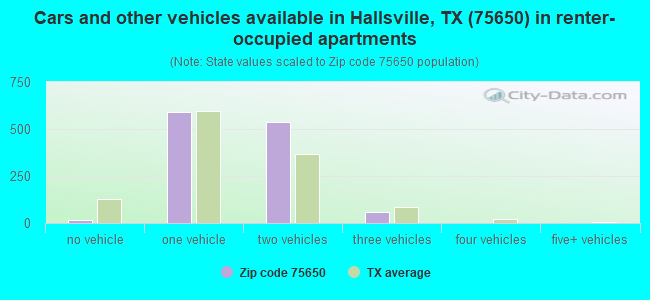
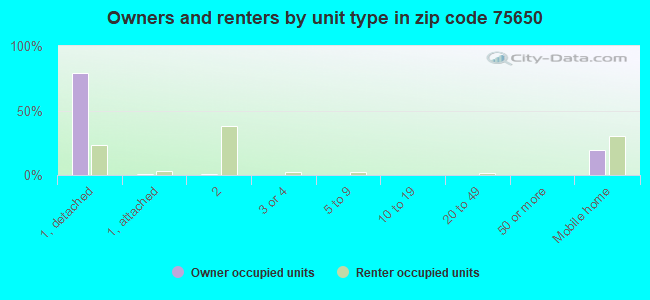
Houses and condos: 4,174 Renter-occupied apartments: 1,209
% of renters here:
33%
State:
38%
March 2022 cost of living index in zip code 75650: 79.2 (low, U.S. average is 100)
Land area: 124.2 sq. mi. Water area: 2.7 sq. mi.
Population density: 82 people per square mile
(very low).
OSM Map
General Map
Google Map
MSN Map
OSM Map
General Map
Google Map
MSN Map
OSM Map
General Map
Google Map
MSN Map
OSM Map
General Map
Google Map
MSN Map
Please wait while loading the map...
Real estate property taxes paid for housing units in 2022:
This zip code:
1.3% ($2,637)
Texas:
1.5% ($4,050)
Median real estate property taxes paid for housing units with mortgages in 2022: $2,965 (1.0%) Median real estate property taxes paid for housing units with no mortgage in 2022: $1,526 (1.3%)
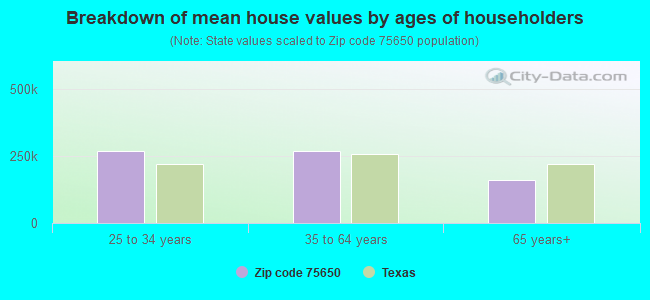
Estimated median house/condo value in 2022: $196,367
75650:
$196,367
Texas:
$275,400
According to our research of Texas and other state lists, there were 25 registered sex offenders living in 75650 zip code as of May 28, 2024. The ratio of all residents to sex offenders in zip code 75650 is 365 to 1. The ratio of registered sex offenders to all residents in this zip code is near the state average.
Median resident age:
This zip code:
35.9 years
Texas median age:
35.6 years
Average household size:
This zip code:
2.7 people
Texas:
2.6 people
Averages for the 2020 tax year for zip code 75650, filed in 2021:
Average Adjusted Gross Income (AGI) in 2020: $66,821 (Individual Income Tax Returns)
Here:
$66,821
State:
$77,054
Salary/wage: $61,043 (reported on 84.7% of returns)
Here:
$61,043
State:
$62,766
(% of AGI for various income ranges: 1169.6% for AGIs below $25k, 3448.4% for AGIs $25k-50k, 6465.5% for AGIs $50k-75k, 9459.2% for AGIs $75k-100k, 17088.5% for AGIs $100k-200k, 59647.1% for AGIs over 200k)
Taxable interest for individuals: $1,051 (reported on 30.8% of returns)
This zip code:
$1,051
Texas:
$2,665
(% of AGI for various income ranges: 12.9% for AGIs below $25k, 31.2% for AGIs $25k-50k, 52.7% for AGIs $50k-75k, 49.2% for AGIs $75k-100k, 67.3% for AGIs $100k-200k, 395.7% for AGIs over 200k)
Ordinary dividends: $6,192 (reported on 13.3% of returns)
Here:
$6,192
State:
$10,044
(% of AGI for various income ranges: 20.4% for AGIs below $25k, 25.3% for AGIs $25k-50k, 42.0% for AGIs $50k-75k, 72.2% for AGIs $75k-100k, 170.8% for AGIs $100k-200k, 2815.7% for AGIs over 200k)
Net capital gain/loss in AGI: +$14,005 (reported on 13.1% of returns)
Here:
+$14,005
State:
+$39,590
(% of AGI for various income ranges: 10.4% for AGIs below $25k, 21.6% for AGIs $25k-50k, 73.9% for AGIs $50k-75k, 138.9% for AGIs $75k-100k, 332.1% for AGIs $100k-200k, 7840.0% for AGIs over 200k)
Profit/loss from business: +$7,381 (reported on 19.0% of returns)
Here:
+$7,381
State:
+$10,888
(% of AGI for various income ranges: 90.6% for AGIs below $25k, 38.3% for AGIs $25k-50k, 103.1% for AGIs $50k-75k, 33.9% for AGIs $75k-100k, 389.4% for AGIs $100k-200k, 3527.1% for AGIs over 200k)
Taxable individual retirement arrangement distribution: $18,611 (reported on 8.0% of returns)
75650:
$18,611
Texas:
$24,740
(% of AGI for various income ranges: 51.8% for AGIs below $25k, 108.1% for AGIs $25k-50k, 140.4% for AGIs $50k-75k, 278.6% for AGIs $75k-100k, 520.8% for AGIs $100k-200k, 1371.4% for AGIs over 200k)
Total itemized deductions: $40,153 (reported on 6.6% of returns)
Here:
$40,153
State:
$40,428
(% of AGI for various income ranges: 55.0% for AGIs below $25k, 143.8% for AGIs $25k-50k, 245.3% for AGIs $50k-75k, 488.3% for AGIs $75k-100k, 834.8% for AGIs $100k-200k, 4522.9% for AGIs over 200k)
Charity contributions: $14,446 (reported on 5.3% of returns)
Here:
$14,446
State:
$18,201
(% of AGI for various income ranges: 39.1% for AGIs $25k-50k, 99.4% for AGIs $75k-100k, 275.8% for AGIs $100k-200k, 2070.0% for AGIs over 200k)
Taxes paid: $6,462 (reported on 6.4% of returns)
75650:
$6,462
State:
$7,821
(% of AGI for various income ranges: 26.9% for AGIs $25k-50k, 25.5% for AGIs $50k-75k, 62.5% for AGIs $75k-100k, 135.4% for AGIs $100k-200k, 911.4% for AGIs over 200k)
Earned income credit: $2,494 (reported on 18.4% of returns)
Here:
$2,494
State:
$2,584
(% of AGI for various income ranges: 113.4% for AGIs below $25k, 90.3% for AGIs $25k-50k)
Percentage of individuals using paid preparers for their 2020 taxes: 94.0%
Here:
94%
State:
92%
(% for various income ranges: 93.1% for AGIs below $25k, 95.0% for AGIs $25k-50k, 93.8% for AGIs $50k-75k, 93.8% for AGIs $75k-100k, 94.6% for AGIs $100k-200k, 95.0% for AGIs over 200k)
Averages for the 2012 tax year for zip code 75650, filed in 2013:
Average Adjusted Gross Income (AGI) in 2012: $61,853 (Individual Income Tax Returns)
Here:
$61,853
State:
$65,384
Salary/wage: $54,125 (reported on 88.5% of returns)
Here:
$54,125
State:
$52,524
(% of AGI for various income ranges: 78.3% for AGIs below $25k, 83.0% for AGIs $25k-50k, 86.9% for AGIs $50k-75k, 85.4% for AGIs $75k-100k, 83.0% for AGIs $100k-200k, 52.2% for AGIs over 200k)
Taxable interest for individuals: $1,075 (reported on 30.0% of returns)
This zip code:
$1,075
Texas:
$2,372
(% of AGI for various income ranges: 0.8% for AGIs below $25k, 0.6% for AGIs $25k-50k, 0.3% for AGIs $50k-75k, 0.4% for AGIs $75k-100k, 0.7% for AGIs $100k-200k, 0.4% for AGIs over 200k)
Ordinary dividends: $2,576 (reported on 13.1% of returns)
Here:
$2,576
State:
$9,721
(% of AGI for various income ranges: 0.8% for AGIs below $25k, 0.5% for AGIs $25k-50k, 0.3% for AGIs $50k-75k, 0.3% for AGIs $75k-100k, 0.4% for AGIs $100k-200k, 1.1% for AGIs over 200k)
Net capital gain/loss in AGI: +$6,962 (reported on 12.1% of returns)
Here:
+$6,962
State:
+$35,319
(% of AGI for various income ranges: 0.2% for AGIs below $25k, 0.2% for AGIs $50k-75k, 0.5% for AGIs $75k-100k, 1.0% for AGIs $100k-200k, 4.6% for AGIs over 200k)
Profit/loss from business: +$13,010 (reported on 17.4% of returns)
Here:
+$13,010
State:
+$13,732
(% of AGI for various income ranges: 7.5% for AGIs below $25k, 3.5% for AGIs $25k-50k, 3.0% for AGIs $50k-75k, 2.0% for AGIs $75k-100k, 3.0% for AGIs $100k-200k, 5.2% for AGIs over 200k)
Taxable individual retirement arrangement distribution: $14,773 (reported on 7.7% of returns)
75650:
$14,773
Texas:
$19,511
(% of AGI for various income ranges: 3.6% for AGIs below $25k, 2.5% for AGIs $25k-50k, 1.3% for AGIs $50k-75k, 1.8% for AGIs $75k-100k, 2.7% for AGIs $100k-200k)
Total itemized deductions: $22,091 (18% of AGI, reported on 25.6% of returns)
Here:
$22,091
State:
$24,724
Here:
18.1% of AGI
State:
15.9% of AGI
(% of AGI for various income ranges: 6.3% for AGIs below $25k, 7.3% for AGIs $25k-50k, 8.9% for AGIs $50k-75k, 10.9% for AGIs $75k-100k, 10.7% for AGIs $100k-200k, 8.1% for AGIs over 200k)
Charity contributions: $6,924 (reported on 19.5% of returns)
Here:
$6,924
State:
$6,808
(% of AGI for various income ranges: 0.5% for AGIs below $25k, 1.4% for AGIs $25k-50k, 1.8% for AGIs $50k-75k, 2.1% for AGIs $75k-100k, 2.8% for AGIs $100k-200k, 2.7% for AGIs over 200k)
Taxes paid: $4,920 (reported on 25.1% of returns)
75650:
$4,920
State:
$6,921
(% of AGI for various income ranges: 0.9% for AGIs below $25k, 1.3% for AGIs $25k-50k, 1.7% for AGIs $50k-75k, 2.1% for AGIs $75k-100k, 2.6% for AGIs $100k-200k, 2.1% for AGIs over 200k)
Earned income credit: $2,404 (reported on 19.0% of returns)
Here:
$2,404
State:
$2,570
(% of AGI for various income ranges: 7.9% for AGIs below $25k, 1.4% for AGIs $25k-50k)
Percentage of individuals using paid preparers for their 2012 taxes: 52.3%
Here:
52%
State:
51%
(% for various income ranges: 45.6% for AGIs below $25k, 50.6% for AGIs $25k-50k, 55.0% for AGIs $50k-75k, 57.1% for AGIs $75k-100k, 60.4% for AGIs $100k-200k, 75.0% for AGIs over 200k)
Averages for the 2004 tax year for zip code 75650, filed in 2005:
Average Adjusted Gross Income (AGI) in 2004: $40,869 (Individual Income Tax Returns)
Here:
$40,869
State:
$47,881
Salary/wage: $38,181 (reported on 88.5% of returns)
Here:
$38,181
State:
$41,947
(% of AGI for various income ranges: 113.8% for AGIs below $10k, 81.5% for AGIs $10k-25k, 88.9% for AGIs $25k-50k, 88.9% for AGIs $50k-75k, 84.9% for AGIs $75k-100k, 67.2% for AGIs over 100k)
Taxable interest for individuals: $1,076 (reported on 37.6% of returns)
This zip code:
$1,076
Texas:
$2,255
(% of AGI for various income ranges: 3.5% for AGIs below $10k, 1.1% for AGIs $10k-25k, 1.0% for AGIs $25k-50k, 0.6% for AGIs $50k-75k, 0.6% for AGIs $75k-100k, 1.4% for AGIs over 100k)
Taxable dividends: $1,334 (reported on 17.6% of returns)
Here:
$1,334
State:
$4,261
(% of AGI for various income ranges: 2.2% for AGIs below $10k, 0.3% for AGIs $10k-25k, 0.3% for AGIs $25k-50k, 0.3% for AGIs $50k-75k, 0.8% for AGIs $75k-100k, 0.8% for AGIs over 100k)
Net capital gain/loss: +$2,456 (reported on 12.4% of returns)
Here:
+$2,456
State:
+$16,110
(% of AGI for various income ranges: -1.4% for AGIs below $10k, -0.1% for AGIs $10k-25k, 0.4% for AGIs $25k-50k, 0.3% for AGIs $50k-75k, 0.2% for AGIs $75k-100k, 2.5% for AGIs over 100k)
Profit/loss from business: +$9,445 (reported on 17.4% of returns)
Here:
+$9,445
State:
+$11,013
(% of AGI for various income ranges: 0.9% for AGIs below $10k, 7.1% for AGIs $10k-25k, 2.5% for AGIs $25k-50k, 2.8% for AGIs $50k-75k, 2.6% for AGIs $75k-100k, 6.8% for AGIs over 100k)
IRA payment deduction: $2,831 (reported on 2.2% of returns)
75650:
$2,831
Texas:
$3,120
(% of AGI for various income ranges: 0.2% for AGIs $10k-25k, 0.1% for AGIs $25k-50k, 0.1% for AGIs $50k-75k, 0.4% for AGIs $75k-100k)
Self-employed pension: $13,250 (reported on 0.4% of returns)
Here:
$13,250
Texas:
$16,401
Total itemized deductions: $18,333 (24% of AGI, reported on 21.7% of returns)
Here:
$18,333
State:
$19,631
Here:
23.7% of AGI
State:
18.9% of AGI
(% of AGI for various income ranges: 14.0% for AGIs below $10k, 6.0% for AGIs $10k-25k, 6.4% for AGIs $25k-50k, 9.4% for AGIs $50k-75k, 11.0% for AGIs $75k-100k, 13.2% for AGIs over 100k)
Charity contributions deductions: $4,848 (6% of AGI, reported on 18.2% of returns)
Here:
$4,848
State:
$4,753
Here:
6.0% of AGI
State:
4.2% of AGI
(% of AGI for various income ranges: 1.0% for AGIs below $10k, 0.7% for AGIs $10k-25k, 1.2% for AGIs $25k-50k, 1.8% for AGIs $50k-75k, 2.7% for AGIs $75k-100k, 3.7% for AGIs over 100k)
Total tax: $5,540 (reported on 72.1% of returns)
75650:
$5,540
State:
$9,058
(% of AGI for various income ranges: 3.2% for AGIs below $10k, 3.7% for AGIs $10k-25k, 6.1% for AGIs $25k-50k, 8.2% for AGIs $50k-75k, 10.2% for AGIs $75k-100k, 17.3% for AGIs over 100k)
Earned income credit: $1,860 (reported on 19.9% of returns)
Here:
$1,860
State:
$2,024
Percentage of individuals using paid preparers for their 2004 taxes: 56.7%
Here:
57%
State:
57%
(% for various income ranges: 48.0% for AGIs below $10k, 59.7% for AGIs $10k-25k, 58.0% for AGIs $25k-50k, 58.2% for AGIs $50k-75k, 61.5% for AGIs $75k-100k, 59.4% for AGIs over 100k)
Likely homosexual households (counted as self-reported same-sex unmarried-partner households)
Lesbian couples: 0.4% of all households
Gay men: 0.6% of all households
Household received Food Stamps/SNAP in the past 12 months: 172 Household did not receive Food Stamps/SNAP in the past 12 months: 3,515
Women who had a birth in the past 12 months: 133 (122 now married, 12 unmarried) Women who did not have a birth in the past 12 months: 2,345 (1,419 now married, 913 unmarried)
Housing units in zip code 75650 with a mortgage: 1,443 (27 second mortgage, 29 both second mortgage and home equity loan) Median monthly owner costs for units with a mortgage: $1,914 Median monthly owner costs for units without a mortgage: $495
Residents with income below the poverty level in 2022:
This zip code:
5.6%
Whole state:
14.0%
Residents with income below 50% of the poverty level in 2022:
This zip code:
2.0%
Whole state:
7.4%
Median number of rooms in houses and condos:
Here:
6.6
State:
6.3
Median number of rooms in apartments:
Here:
4.6
State:
4.0
Notable locations in this zip code not listed on our city pages
Churches in zip code 75650 include: Rock Springs Church (A), Pleasant Hill Church (B), Atlas Church (C), Sweet Home Church (D), Hatley Memorial Church (E), Athens Church (F), Bucksville Church (G), Evergreen Church (H), Holiness Church (I). Display/hide their locations on the map
Cemeteries: Morris Cemetery (1), Mount Pleasant Cemetery (2), Springhill Cemetery (3), Scott Cemetery (4), Friendship Cemetery (5). Display/hide their locations on the map
Streams, rivers, and creeks: Moccasin Creek (A), Wards Creek (B), Gum Creek (C), Cherokee Bayou (D), Clarks Creek (E), Caney Creek (F), Rodgers Creek (G), Hatley Creek (H), Hardin Creek (I). Display/hide their locations on the map
Size of family households: 1,280 2-persons, 943 3-persons, 350 4-persons, 293 5-persons, 163 6-persons
Size of nonfamily households: 542 1-person, 78 2-persons, 45 7-or-more-persons
2,165 married couples with children.
464 single-parent households (188 men, 276 women).
95.0% of residents of 75650 zip code speak English at home.
4.5% of residents speak Spanish at home (35% very well, 32% well, 25% not well, 8% not at all).
0.2% of residents speak Asian or Pacific Island language at home (100% well).
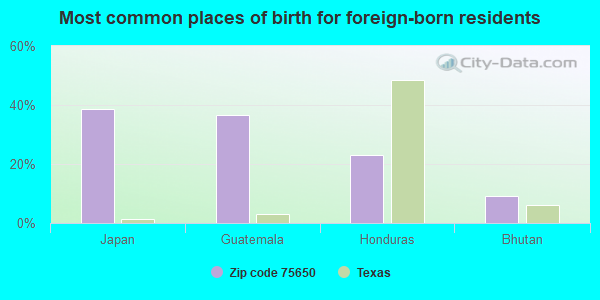
Foreign born population: 242 (2.4%) (79.1% of them are naturalized citizens)
This zip code:
2.4%
Whole state:
17.2%
39%Japan
36%Guatemala
23%Honduras
9%Bhutan
28%American
11%English
7%Irish
6%German
4%European
4%Norwegian
1%Italian
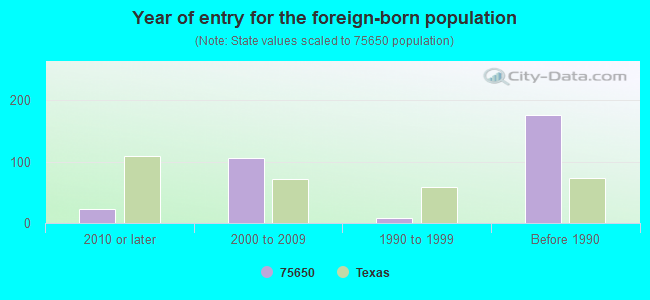
Year of entry for the foreign-born population
232010 or later
1062000 to 2009
81990 to 1999
176Before 1990
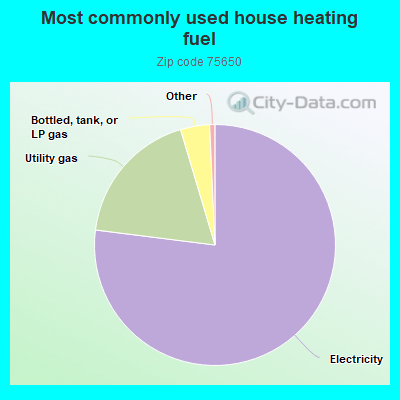
Housing units lacking complete plumbing facilities: 2.4% Housing units lacking complete kitchen facilities: 6.1%
77.0%Electricity
18.4%Utility gas
3.9%Bottled, tank, or LP gas
Population in 1990: 7,463. Population change in the 1990s: +236 (+3.2%).
Place of birth for U.S.-born residents:
This state: 7,189
Northeast: 240
Midwest: 743
South: 1,161
West: 472
52% of the 75650 zip code residents lived in the same house 5 years ago. Out of people who lived in different houses, 42% lived in this county. Out of people who lived in different counties, 50% lived in Texas.
85% of the 75650 zip code residents lived in the same house 1 year ago. Out of people who lived in different houses, 36% moved from this county. Out of people who lived in different houses, 38% moved from different county within same state. Out of people who lived in different houses, 29% moved from different state.
Private vs. public school enrollment:
Students in private schools in grades 1 to 8 (elementary and middle school): 144
Here:
11.1%
Texas:
8.8%
Students in private schools in grades 9 to 12 (high school): 25
Here:
3.5%
Texas:
8.0%
Students in private undergraduate colleges: 180
Here:
42.8%
Texas:
16.2%
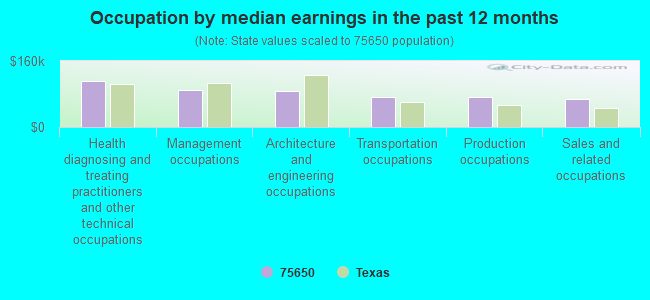
Occupation by median earnings in the past 12 months ($)
112,247Health diagnosing and treating practitioners and other technical occupations
89,971Management occupations
87,006Architecture and engineering occupations
72,742Transportation occupations
71,900Production occupations
67,122Sales and related occupations
Top industries in this zip code by the number of employees in 2005:
Finance and Insurance: Direct Health and Medical Insurance Carriers (250-499 employees: 1 establishment)
Mining: Bituminous Coal and Lignite Surface Mining (100-249: 1)
Other Services (except Public Administration): Commercial and Industrial Machinery and Equipment (except Automotive and Electronic) Repair and Maintenance (100-249: 1)
Utilities: Fossil Fuel Electric Power Generation (100-249: 1)
Other Services (except Public Administration): Religious Organizations (20-49: 2, 1-4: 3)
2002 - 2018 National Fire Incident Reporting System (NFIRS) incidents
According to the data from the years 2002 - 2018 the average number of fire incidents per year is 78. The highest number of fires - 149 took place in 2011, and the least - 6 in 2018. The data has a declining trend.
When looking into fire subcategories, the most incidents belonged to: Outside Fires (67.4%), and Structure Fires (18.8%).
Fire incident types reported to NFIRS in Zip Code 75650


 Nearest zip codes: 75602, 75641, 75670, 75651, 75601, 75605.


 According to the data from the years 2002 - 2018 the average number of fire incidents per year is 78. The highest number of fires - 149 took place in 2011, and the least - 6 in 2018. The data has a declining trend.
 When looking into fire subcategories, the most incidents belonged to: Outside Fires (67.4%), and Structure Fires (18.8%).