Estimated zip code population in 2022: 2,256 Zip code population in 2010: 2,189 Zip code population in 2000: 1,832
Houses and condos: 1,009 Renter-occupied apartments: 158
% of renters here:
18%
State:
38%
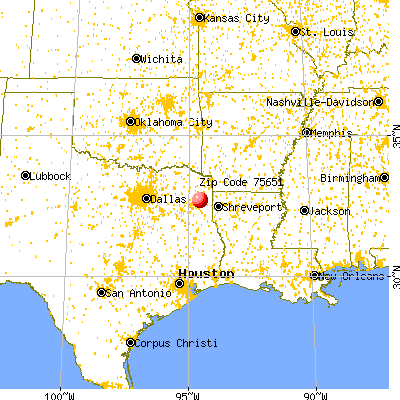
March 2022 cost of living index in zip code 75651: 79.3 (low, U.S. average is 100)
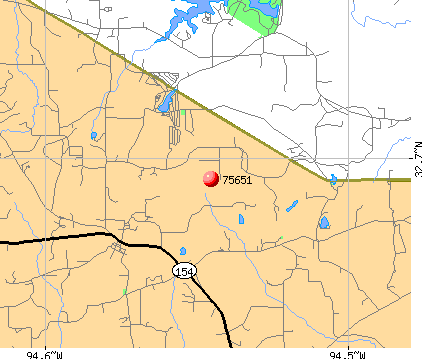
Land area: 58.7 sq. mi. Water area: 0.2 sq. mi.
Population density: 38 people per square mile
(very low).
OSM Map
General Map
Google Map
MSN Map
OSM Map
General Map
Google Map
MSN Map
OSM Map
General Map
Google Map
MSN Map
OSM Map
General Map
Google Map
MSN Map
Please wait while loading the map...
Real estate property taxes paid for housing units in 2022:
This zip code:
1.2% ($2,032)
Texas:
1.5% ($4,050)
Median real estate property taxes paid for housing units with mortgages in 2022: $3,473 (1.3%) Median real estate property taxes paid for housing units with no mortgage in 2022: $1,343 (0.9%)
Averages for the 2020 tax year for zip code 75651, filed in 2021:
Average Adjusted Gross Income (AGI) in 2020: $55,112 (Individual Income Tax Returns)
Here:
$55,112
State:
$77,054
Salary/wage: $52,472 (reported on 81.0% of returns)
Here:
$52,472
State:
$62,766
(% of AGI for various income ranges: 1257.1% for AGIs below $25k, 3167.5% for AGIs $25k-50k, 7266.4% for AGIs $50k-75k, 9687.1% for AGIs $75k-100k, 16705.5% for AGIs $100k-200k)
Taxable interest for individuals: $659 (reported on 27.0% of returns)
This zip code:
$659
Texas:
$2,665
(% of AGI for various income ranges: 13.8% for AGIs below $25k, 16.5% for AGIs $25k-50k, 53.6% for AGIs $50k-75k, 14.3% for AGIs $75k-100k, 39.1% for AGIs $100k-200k)
Ordinary dividends: $2,950 (reported on 10.0% of returns)
Here:
$2,950
State:
$10,044
(% of AGI for various income ranges: 38.8% for AGIs below $25k, 138.2% for AGIs $50k-75k, 45.5% for AGIs $100k-200k)
Net capital gain/loss in AGI: +$5,220 (reported on 10.0% of returns)
Here:
+$5,220
State:
+$39,590
(% of AGI for various income ranges: 33.8% for AGIs below $25k, 203.6% for AGIs $50k-75k, 197.3% for AGIs $100k-200k)
Profit/loss from business: +$2,179 (reported on 19.0% of returns)
Here:
+$2,179
State:
+$10,888
(% of AGI for various income ranges: 85.4% for AGIs below $25k, 126.5% for AGIs $25k-50k, 30.0% for AGIs $50k-75k, 31.4% for AGIs $75k-100k)
Taxable individual retirement arrangement distribution: $21,133 (reported on 6.0% of returns)
75651:
$21,133
Texas:
$24,740
(% of AGI for various income ranges: 109.6% for AGIs below $25k, 913.6% for AGIs $50k-75k)
Total itemized deductions: $37,400 (reported on 3.0% of returns)
Here:
$37,400
State:
$40,428
(% of AGI for various income ranges: 1020.0% for AGIs $50k-75k)
Charity contributions: $9,650 (reported on 2.0% of returns)
Here:
$9,650
State:
$18,201
(% of AGI for various income ranges: 96.5% for AGIs $25k-50k)
Taxes paid: $4,700 (reported on 3.0% of returns)
75651:
$4,700
State:
$7,821
(% of AGI for various income ranges: 128.2% for AGIs $50k-75k)
Earned income credit: $2,643 (reported on 21.0% of returns)
Here:
$2,643
State:
$2,584
(% of AGI for various income ranges: 149.2% for AGIs below $25k, 98.5% for AGIs $25k-50k)
Percentage of individuals using paid preparers for their 2020 taxes: 95.0%
Here:
95%
State:
92%
(% for various income ranges: 94.1% for AGIs below $25k, 95.8% for AGIs $25k-50k, 93.8% for AGIs $50k-75k, 90.0% for AGIs $75k-100k, 100.0% for AGIs $100k-200k)
Averages for the 2012 tax year for zip code 75651, filed in 2013:
Average Adjusted Gross Income (AGI) in 2012: $49,766 (Individual Income Tax Returns)
Here:
$49,766
State:
$65,384
Salary/wage: $47,077 (reported on 86.8% of returns)
Here:
$47,077
State:
$52,524
(% of AGI for various income ranges: 71.5% for AGIs below $25k, 81.7% for AGIs $25k-50k, 86.4% for AGIs $50k-75k, 87.9% for AGIs $75k-100k, 78.7% for AGIs $100k-200k)
Taxable interest for individuals: $648 (reported on 25.3% of returns)
This zip code:
$648
Texas:
$2,372
(% of AGI for various income ranges: 1.0% for AGIs below $25k, 0.6% for AGIs $25k-50k, 0.3% for AGIs $50k-75k, 0.1% for AGIs $75k-100k, 0.2% for AGIs $100k-200k)
Ordinary dividends: $1,400 (reported on 9.9% of returns)
Here:
$1,400
State:
$9,721
(% of AGI for various income ranges: 1.4% for AGIs below $25k, 0.6% for AGIs $25k-50k, 0.3% for AGIs $75k-100k)
Net capital gain/loss in AGI: +$1,712 (reported on 8.8% of returns)
Here:
+$1,712
State:
+$35,319
Profit/loss from business: +$6,012 (reported on 17.6% of returns)
Here:
+$6,012
State:
+$13,732
(% of AGI for various income ranges: 10.1% for AGIs below $25k, 1.8% for AGIs $25k-50k, 1.8% for AGIs $50k-75k, 2.2% for AGIs $75k-100k, 0.2% for AGIs $100k-200k)
Taxable individual retirement arrangement distribution: $9,700 (reported on 7.7% of returns)
75651:
$9,700
Texas:
$19,511
Total itemized deductions: $18,958 (22% of AGI, reported on 20.9% of returns)
Here:
$18,958
State:
$24,724
Here:
21.5% of AGI
State:
15.9% of AGI
(% of AGI for various income ranges: 8.5% for AGIs $25k-50k, 7.6% for AGIs $50k-75k, 8.5% for AGIs $75k-100k, 9.8% for AGIs $100k-200k)
Charity contributions: $5,215 (reported on 14.3% of returns)
Here:
$5,215
State:
$6,808
(% of AGI for various income ranges: 3.3% for AGIs below $25k, 1.2% for AGIs $50k-75k, 1.6% for AGIs $75k-100k, 1.9% for AGIs $100k-200k)
Taxes paid: $3,705 (reported on 20.9% of returns)
75651:
$3,705
State:
$6,921
(% of AGI for various income ranges: 1.1% for AGIs $25k-50k, 1.2% for AGIs $50k-75k, 1.5% for AGIs $75k-100k, 2.5% for AGIs $100k-200k)
Earned income credit: $2,465 (reported on 22.0% of returns)
Here:
$2,465
State:
$2,570
(% of AGI for various income ranges: 9.2% for AGIs below $25k, 1.5% for AGIs $25k-50k)
Percentage of individuals using paid preparers for their 2012 taxes: 64.8%
Here:
65%
State:
51%
(% for various income ranges: 65.7% for AGIs below $25k, 60.0% for AGIs $25k-50k, 60.0% for AGIs $50k-75k, 72.7% for AGIs $75k-100k, 70.0% for AGIs $100k-200k)
Averages for the 2004 tax year for zip code 75651, filed in 2005:
Average Adjusted Gross Income (AGI) in 2004: $34,630 (Individual Income Tax Returns)
Here:
$34,630
State:
$47,881
Salary/wage: $31,640 (reported on 85.0% of returns)
Here:
$31,640
State:
$41,947
(% of AGI for various income ranges: 95.6% for AGIs below $10k, 77.8% for AGIs $10k-25k, 84.6% for AGIs $25k-50k, 81.8% for AGIs $50k-75k, 88.9% for AGIs $75k-100k, 41.0% for AGIs over 100k)
Taxable interest for individuals: $1,135 (reported on 31.7% of returns)
This zip code:
$1,135
Texas:
$2,255
(% of AGI for various income ranges: 3.9% for AGIs below $10k, 0.6% for AGIs $10k-25k, 1.6% for AGIs $25k-50k, 0.8% for AGIs $50k-75k, 0.4% for AGIs $75k-100k, 0.8% for AGIs over 100k)
Taxable dividends: $860 (reported on 10.5% of returns)
Here:
$860
State:
$4,261
(% of AGI for various income ranges: 0.3% for AGIs $10k-25k, 0.2% for AGIs $25k-50k, 0.2% for AGIs $50k-75k, 0.7% for AGIs $75k-100k)
Net capital gain/loss: +$6,311 (reported on 9.0% of returns)
Here:
+$6,311
State:
+$16,110
(% of AGI for various income ranges: -0.2% for AGIs $10k-25k, 0.9% for AGIs $25k-50k, 1.5% for AGIs $50k-75k, 7.0% for AGIs over 100k)
Profit/loss from business: +$5,901 (reported on 18.5% of returns)
Here:
+$5,901
State:
+$11,013
(% of AGI for various income ranges: 1.3% for AGIs below $10k, 9.1% for AGIs $10k-25k, 2.8% for AGIs $25k-50k, 4.1% for AGIs $50k-75k, 0.7% for AGIs $75k-100k)
Total itemized deductions: $16,411 (26% of AGI, reported on 15.8% of returns)
Here:
$16,411
State:
$19,631
Here:
25.8% of AGI
State:
18.9% of AGI
(% of AGI for various income ranges: 5.5% for AGIs $10k-25k, 6.7% for AGIs $25k-50k, 8.4% for AGIs $50k-75k, 12.2% for AGIs $75k-100k, 5.5% for AGIs over 100k)
Charity contributions deductions: $4,602 (7% of AGI, reported on 12.0% of returns)
Here:
$4,602
State:
$4,753
Here:
6.8% of AGI
State:
4.2% of AGI
(% of AGI for various income ranges: 1.7% for AGIs $25k-50k, 1.7% for AGIs $50k-75k, 2.5% for AGIs $75k-100k, 1.9% for AGIs over 100k)
Total tax: $4,270 (reported on 70.2% of returns)
75651:
$4,270
State:
$9,058
(% of AGI for various income ranges: 3.3% for AGIs below $10k, 4.0% for AGIs $10k-25k, 5.7% for AGIs $25k-50k, 8.1% for AGIs $50k-75k, 10.0% for AGIs $75k-100k, 19.1% for AGIs over 100k)
Earned income credit: $1,698 (reported on 24.3% of returns)
Here:
$1,698
State:
$2,024
Percentage of individuals using paid preparers for their 2004 taxes: 69.6%
Here:
70%
State:
57%
(% for various income ranges: 63.0% for AGIs below $10k, 69.6% for AGIs $10k-25k, 72.8% for AGIs $25k-50k, 70.5% for AGIs $50k-75k, 64.7% for AGIs $75k-100k, 95.8% for AGIs over 100k)
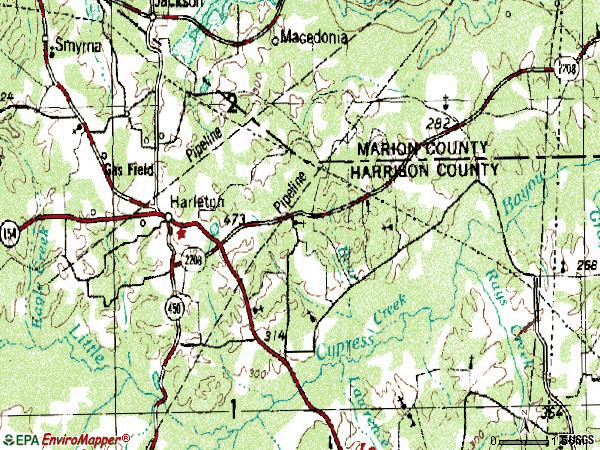
Churches in zip code 75651 include: Saint Mark Church (A), Athey Church (B), Bear Springs Church (C), Goodwill Church (D), New Hope Church (E), Oak Grove Church (F), Piney Church (G). Display/hide their locations on the map
Cemeteries: Center Cemetery (1), Eagle Creek Cemetery (2), Piney Cemetery (3), Hope Springs Cemetery (4), Liberty Cemetery (5). Display/hide their locations on the map
Size of family households: 222 2-persons, 185 3-persons, 163 4-persons, 18 6-persons
Size of nonfamily households: 244 1-person, 38 2-persons
375 married couples with children.
0 single-parent households ().
100.1% of residents of 75651 zip code speak English at home.
0.1% of residents speak Spanish at home (100% very well).
Foreign born population: 0 (0.0%)
:
0.0%
Whole state:
17.2%
47%American
21%German
5%English
4%European
1%Czechoslovakian
Year of entry for the foreign-born population
02010 or later
02000 to 2009
01990 to 1999
28Before 1990
Housing units lacking complete kitchen facilities: 2.8%
79.5%Electricity
8.9%Utility gas
8.1%Bottled, tank, or LP gas
1.7%Other fuel
1.3%Wood
0.7%Solar energy
Population in 1990: 2,609.
Place of birth for U.S.-born residents:
This state: 1,651
Northeast: 164
Midwest: 80
South: 275
West: 38
62% of the 75651 zip code residents lived in the same house 5 years ago. Out of people who lived in different houses, 53% lived in this county. Out of people who lived in different counties, 50% lived in Texas.
97% of the 75651 zip code residents lived in the same house 1 year ago. Out of people who lived in different houses, 21% moved from this county. Out of people who lived in different houses, 90% moved from different county within same state.
Private vs. public school enrollment:
Students in private schools in grades 1 to 8 (elementary and middle school):
Here:
0.0%
Texas:
8.8%
Students in private schools in grades 9 to 12 (high school): 5
Here:
7.2%
Texas:
8.0%
Students in private undergraduate colleges:
Here:
0.0%
Texas:
16.2%
Occupation by median earnings in the past 12 months ($)
130,325Management occupations
83,361Health diagnosing and treating practitioners and other technical occupations
78,322Business and financial operations occupations
75,324Fire fighting and prevention, and other protective service workers including supervisors
41,846Sales and related occupations
23,378Construction and extraction occupations
Companies with federal contracts located in this zip code:
A R & E CONTRACTING (2536 POPE RD in HARLETON, TX; small business) : $92,700 in 6 contractsfrom 2004 to 2005
Contracts for Construction of Structures and Facilities -- Miscellaneous Buildings, Maintenance, Repair or Alteration of Real Property -- Miscellaneous Buildings by Army, U.S. Army Corps of Engineers - civil program financing only Signed by year:2000: $0; 2001: $0; 2002: $0; 2003: $0; 2004: $95,000; 2005: -$2,300; 2006: $0.
Biggest contracts:
$95,000 with Army for Construction of Structures and Facilities -- Miscellaneous Buildings. Signed on 2004-04-26. Completion date: 2004-07-25.
$93,000 with U.S. Army Corps of Engineers - civil program financing only for Maintenance, Repair or Alteration of Real Property -- Miscellaneous Buildings. Signed on 2004-07-15. Completion date: 2004-10-11.
$93,000 with Army for Maintenance, Repair or Alteration of Real Property -- Miscellaneous Buildings. Signed on 2004-07-15. Completion date: 2004-10-11.
-$2,300 with Army for Construction of Structures and Facilities -- Miscellaneous Buildings. Signed on 2005-03-15. Completion date: 2004-07-25.
MCINTOSH, NESBIT (203 FREED RD in HARLETON, TX; small business) : $37,757 in 2 contractsfrom 2004 to 2005
$39,550 with Army for Custodial Janitorial Services. Signed on 2005-04-04. Completion date: 2009-09-30.
-$1,793 with Army for Other Housekeeping Services. Signed on 2004-10-14. Completion date: 2004-12-31.
CYNTHIA A MCINTOSH (203 FREED RD in HARLETON, TX; small business) : $27,651 in 7 contractsfrom 2003 to 2006
Contracts for Recreational Services by Army Signed by year:2000: $0; 2001: $0; 2002: $0; 2003: $3,240; 2004: $0; 2005: $32,340; 2006: -$7,929.
Biggest contracts:
$21,960 with Army for Recreational Services. Signed on 2005-08-31. Completion date: 2006-09-30.
$10,380, same as above.Signed on 2005-01-25. Completion date: 2005-09-30.
$1,200, same as above.Signed on 2003-12-11. Completion date: 2004-02-29.
$1,080, same as above.Signed on 2003-10-15. Completion date: 2004-02-29.
Top industries in this zip code by the number of employees in 2005:
Other Services (except Public Administration): Religious Organizations (5-9 employees: 2 establishments, 1-4 employees: 2 establishments)
Mining: Crude Petroleum and Natural Gas Extraction (5-9: 2, 1-4: 1)
Construction: Poured Concrete Foundation and Structure Contractors (10-19: 1)
Other Services (except Public Administration): Commercial and Industrial Machinery and Equipment (except Automotive and Electronic) Repair and Maintenance (5-9: 1)
Construction: Structural Steel and Precast Concrete Contractors (5-9: 1)
Health Care and Social Assistance: Child Day Care Services (5-9: 1)
Wholesale Trade: Metal Service Centers and Other Metal Merchant Wholesalers (1-4: 1)
Utilities: Water Supply and Irrigation Systems (1-4: 1)
Other Services (except Public Administration): Drycleaning and Laundry Services (except Coin-Operated) (1-4: 1)
Home Mortgage Disclosure Act Aggregated Statistics For Year 2003 (Based on 2 partial tracts)
A) FHA, FSA/RHS & VA Home Purchase Loans
B) Conventional Home Purchase Loans
C) Refinancings
D) Home Improvement Loans
F) Non-occupant Loans on < 5 Family Dwellings (A B C & D)
Number
Average Value
Number
Average Value
Number
Average Value
Number
Average Value
Number
Average Value
LOANS ORIGINATED
5
$84,962
36
$64,313
38
$77,724
8
$39,859
4
$67,312
APPLICATIONS APPROVED, NOT ACCEPTED
0
$0
17
$52,501
12
$77,563
1
$21,190
2
$73,385
APPLICATIONS DENIED
1
$24,290
41
$54,037
30
$68,080
6
$23,945
3
$98,880
APPLICATIONS WITHDRAWN
0
$0
1
$22,220
23
$79,407
1
$97,160
0
$0
FILES CLOSED FOR INCOMPLETENESS
0
$0
1
$48,580
1
$51,680
0
$0
1
$7,750
Aggregated Statistics For Year 1999 (Based on 1 partial tract)
A) FHA, FSA/RHS & VA Home Purchase Loans
B) Conventional Home Purchase Loans
C) Refinancings
D) Home Improvement Loans
F) Non-occupant Loans on < 5 Family Dwellings (A B C & D)


 Nearest zip codes: 75650, 75640, 75670, 75630, 75605, 75601.


 : $92,700 in 6 contracts from 2004 to 2005


