Estimated zip code population in 2022: 4,669 Zip code population in 2010: 4,219 Zip code population in 2000: 3,687
Houses and condos: 2,078 Renter-occupied apartments: 443
% of renters here:
25%
State:
38%
March 2022 cost of living index in zip code 75691: 78.8 (low, U.S. average is 100)
Land area: 93.0 sq. mi. Water area: 7.2 sq. mi.
Population density: 50 people per square mile
(very low).
OSM Map
General Map
Google Map
MSN Map
OSM Map
General Map
Google Map
MSN Map
OSM Map
General Map
Google Map
MSN Map
OSM Map
General Map
Google Map
MSN Map
Please wait while loading the map...
Real estate property taxes paid for housing units in 2022:
This zip code:
1.0% ($1,709)
Texas:
1.5% ($4,050)
Median real estate property taxes paid for housing units with mortgages in 2022: $2,141 (1.0%) Median real estate property taxes paid for housing units with no mortgage in 2022: $1,093 (0.7%)
Business Search- 14 Million verified businesses
Males: 2,435
(52.2%)
Females: 2,234
(47.8%)
For population 25 years and over in 75691:
High school or higher: 91.4%
Bachelor's degree or higher: 15.2%
Graduate or professional degree: 4.3%
Unemployed: 2.9%
Mean travel time to work (commute): 29.3 minutes
For population 15 years and over in 75691:
Never married: 30.7%
Now married: 48.6%
Separated: 1.4%
Widowed: 6.3%
Divorced: 13.0%
Zip code 75691 compared to state average:
Median house value below state average.
Hispanic race population percentage significantly below state average.
Foreign-born population percentage significantly below state average.
Length of stay since moving in significantly above state average.
Percentage of population with a bachelor's degree or higher below state average.
Averages for the 2020 tax year for zip code 75691, filed in 2021:
Average Adjusted Gross Income (AGI) in 2020: $54,370 (Individual Income Tax Returns)
Here:
$54,370
State:
$77,054
Salary/wage: $49,463 (reported on 86.4% of returns)
Here:
$49,463
State:
$62,766
(% of AGI for various income ranges: 1304.4% for AGIs below $25k, 3616.7% for AGIs $25k-50k, 6145.8% for AGIs $50k-75k, 8961.5% for AGIs $75k-100k, 16754.4% for AGIs $100k-200k, 34335.0% for AGIs over 200k)
Taxable interest for individuals: $714 (reported on 23.0% of returns)
This zip code:
$714
Texas:
$2,665
(% of AGI for various income ranges: 7.7% for AGIs below $25k, 24.1% for AGIs $25k-50k, 26.7% for AGIs $50k-75k, 23.8% for AGIs $75k-100k, 36.9% for AGIs $100k-200k, 110.0% for AGIs over 200k)
Ordinary dividends: $3,161 (reported on 9.4% of returns)
Here:
$3,161
State:
$10,044
(% of AGI for various income ranges: 6.8% for AGIs below $25k, 4.6% for AGIs $25k-50k, 27.5% for AGIs $50k-75k, 32.3% for AGIs $75k-100k, 168.1% for AGIs $100k-200k, 675.0% for AGIs over 200k)
Net capital gain/loss in AGI: +$9,326 (reported on 9.9% of returns)
Here:
+$9,326
State:
+$39,590
(% of AGI for various income ranges: 0.2% for AGIs below $25k, 10.5% for AGIs $25k-50k, 86.2% for AGIs $50k-75k, 90.8% for AGIs $75k-100k, 208.8% for AGIs $100k-200k, 5355.0% for AGIs over 200k)
Profit/loss from business: +$2,946 (reported on 19.4% of returns)
Here:
+$2,946
State:
+$10,888
(% of AGI for various income ranges: 13.2% for AGIs below $25k, 47.7% for AGIs $25k-50k, 108.5% for AGIs $75k-100k, 482.5% for AGIs $100k-200k)
Taxable individual retirement arrangement distribution: $16,538 (reported on 6.8% of returns)
75691:
$16,538
Texas:
$24,740
(% of AGI for various income ranges: 31.1% for AGIs below $25k, 74.1% for AGIs $25k-50k, 166.2% for AGIs $50k-75k, 470.8% for AGIs $75k-100k, 420.6% for AGIs $100k-200k)
Total itemized deductions: $35,854 (reported on 6.8% of returns)
Here:
$35,854
State:
$40,428
(% of AGI for various income ranges: 149.7% for AGIs $25k-50k, 288.3% for AGIs $50k-75k, 546.2% for AGIs $75k-100k, 1671.9% for AGIs $100k-200k)
Charity contributions: $14,930 (reported on 5.2% of returns)
Here:
$14,930
State:
$18,201
(% of AGI for various income ranges: 23.9% for AGIs below $25k, 141.7% for AGIs $50k-75k, 635.6% for AGIs $100k-200k)
Taxes paid: $5,345 (reported on 5.8% of returns)
75691:
$5,345
State:
$7,821
(% of AGI for various income ranges: 12.8% for AGIs below $25k, 56.7% for AGIs $50k-75k, 236.9% for AGIs $100k-200k)
Earned income credit: $2,498 (reported on 21.5% of returns)
Here:
$2,498
State:
$2,584
(% of AGI for various income ranges: 118.6% for AGIs below $25k, 89.2% for AGIs $25k-50k)
Percentage of individuals using paid preparers for their 2020 taxes: 94.2%
Here:
94%
State:
92%
(% for various income ranges: 94.2% for AGIs below $25k, 91.5% for AGIs $25k-50k, 96.7% for AGIs $50k-75k, 94.1% for AGIs $75k-100k, 95.8% for AGIs $100k-200k, 100.0% for AGIs over 200k)
Averages for the 2012 tax year for zip code 75691, filed in 2013:
Average Adjusted Gross Income (AGI) in 2012: $51,019 (Individual Income Tax Returns)
Here:
$51,019
State:
$65,384
Salary/wage: $46,204 (reported on 89.2% of returns)
Here:
$46,204
State:
$52,524
(% of AGI for various income ranges: 82.5% for AGIs below $25k, 85.7% for AGIs $25k-50k, 85.9% for AGIs $50k-75k, 87.5% for AGIs $75k-100k, 82.2% for AGIs $100k-200k, 43.3% for AGIs over 200k)
Taxable interest for individuals: $837 (reported on 26.5% of returns)
This zip code:
$837
Texas:
$2,372
(% of AGI for various income ranges: 0.5% for AGIs below $25k, 0.2% for AGIs $25k-50k, 0.4% for AGIs $50k-75k, 0.4% for AGIs $75k-100k, 0.3% for AGIs $100k-200k, 1.4% for AGIs over 200k)
Ordinary dividends: $2,467 (reported on 8.1% of returns)
Here:
$2,467
State:
$9,721
(% of AGI for various income ranges: 0.6% for AGIs below $25k, 0.2% for AGIs $50k-75k, 0.7% for AGIs $75k-100k, 0.6% for AGIs $100k-200k)
Net capital gain/loss in AGI: +$12,545 (reported on 5.9% of returns)
Here:
+$12,545
State:
+$35,319
(% of AGI for various income ranges: 0.3% for AGIs $25k-50k, 0.8% for AGIs $75k-100k, 4.8% for AGIs $100k-200k)
Profit/loss from business: +$8,263 (reported on 14.6% of returns)
Here:
+$8,263
State:
+$13,732
(% of AGI for various income ranges: 4.0% for AGIs below $25k, 3.1% for AGIs $25k-50k, 2.2% for AGIs $50k-75k, 1.4% for AGIs $75k-100k, 3.0% for AGIs $100k-200k)
Taxable individual retirement arrangement distribution: $15,731 (reported on 7.0% of returns)
75691:
$15,731
Texas:
$19,511
(% of AGI for various income ranges: 2.2% for AGIs below $25k, 1.7% for AGIs $25k-50k, 2.4% for AGIs $50k-75k, 2.0% for AGIs $75k-100k, 3.2% for AGIs $100k-200k)
Total itemized deductions: $20,239 (23% of AGI, reported on 22.2% of returns)
Here:
$20,239
State:
$24,724
Here:
23.3% of AGI
State:
15.9% of AGI
(% of AGI for various income ranges: 5.7% for AGIs below $25k, 7.5% for AGIs $25k-50k, 10.9% for AGIs $50k-75k, 9.4% for AGIs $75k-100k, 12.0% for AGIs $100k-200k)
Charity contributions: $5,491 (reported on 17.8% of returns)
Here:
$5,491
State:
$6,808
(% of AGI for various income ranges: 0.9% for AGIs below $25k, 1.5% for AGIs $25k-50k, 2.2% for AGIs $50k-75k, 1.7% for AGIs $75k-100k, 3.1% for AGIs $100k-200k)
Taxes paid: $3,422 (reported on 21.6% of returns)
75691:
$3,422
State:
$6,921
(% of AGI for various income ranges: 0.7% for AGIs below $25k, 0.7% for AGIs $25k-50k, 1.5% for AGIs $50k-75k, 1.6% for AGIs $75k-100k, 2.6% for AGIs $100k-200k)
Earned income credit: $2,440 (reported on 21.6% of returns)
Here:
$2,440
State:
$2,570
(% of AGI for various income ranges: 8.5% for AGIs below $25k, 1.3% for AGIs $25k-50k)
Percentage of individuals using paid preparers for their 2012 taxes: 62.2%
Here:
62%
State:
51%
(% for various income ranges: 57.7% for AGIs below $25k, 62.2% for AGIs $25k-50k, 64.3% for AGIs $50k-75k, 68.4% for AGIs $75k-100k, 68.4% for AGIs $100k-200k, 66.7% for AGIs over 200k)
Averages for the 2004 tax year for zip code 75691, filed in 2005:
Average Adjusted Gross Income (AGI) in 2004: $35,055 (Individual Income Tax Returns)
Here:
$35,055
State:
$47,881
Salary/wage: $33,252 (reported on 88.5% of returns)
Here:
$33,252
State:
$41,947
(% of AGI for various income ranges: 93.1% for AGIs below $10k, 83.6% for AGIs $10k-25k, 86.0% for AGIs $25k-50k, 88.2% for AGIs $50k-75k, 82.6% for AGIs $75k-100k, 72.6% for AGIs over 100k)
Taxable interest for individuals: $1,360 (reported on 28.5% of returns)
This zip code:
$1,360
Texas:
$2,255
(% of AGI for various income ranges: 0.6% for AGIs below $10k, 1.2% for AGIs $10k-25k, 0.9% for AGIs $25k-50k, 1.5% for AGIs $50k-75k, 0.8% for AGIs $75k-100k, 1.0% for AGIs over 100k)
Taxable dividends: $1,365 (reported on 12.6% of returns)
Here:
$1,365
State:
$4,261
(% of AGI for various income ranges: 1.4% for AGIs below $10k, 0.2% for AGIs $10k-25k, 0.7% for AGIs $25k-50k, 0.1% for AGIs $50k-75k, 0.7% for AGIs $75k-100k, 0.6% for AGIs over 100k)
Net capital gain/loss: +$847 (reported on 9.2% of returns)
Here:
+$847
State:
+$16,110
(% of AGI for various income ranges: 1.2% for AGIs below $10k, -0.1% for AGIs $10k-25k, 0.3% for AGIs $25k-50k, 0.1% for AGIs $50k-75k, 0.4% for AGIs $75k-100k, 0.2% for AGIs over 100k)
Profit/loss from business: +$3,427 (reported on 14.5% of returns)
Here:
+$3,427
State:
+$11,013
(% of AGI for various income ranges: 8.3% for AGIs below $10k, 4.1% for AGIs $10k-25k, 2.1% for AGIs $25k-50k, -0.2% for AGIs $50k-75k, 0.5% for AGIs $75k-100k)
IRA payment deduction: $2,133 (reported on 1.0% of returns)
75691:
$2,133
Texas:
$3,120
Total itemized deductions: $16,058 (24% of AGI, reported on 14.4% of returns)
Here:
$16,058
State:
$19,631
Here:
24.4% of AGI
State:
18.9% of AGI
(% of AGI for various income ranges: 3.8% for AGIs $10k-25k, 6.3% for AGIs $25k-50k, 7.3% for AGIs $50k-75k, 7.0% for AGIs $75k-100k, 9.6% for AGIs over 100k)
Charity contributions deductions: $4,034 (6% of AGI, reported on 11.5% of returns)
Here:
$4,034
State:
$4,753
Here:
6.1% of AGI
State:
4.2% of AGI
(% of AGI for various income ranges: 0.7% for AGIs $10k-25k, 1.1% for AGIs $25k-50k, 1.5% for AGIs $50k-75k, 1.4% for AGIs $75k-100k, 2.4% for AGIs over 100k)
Total tax: $4,324 (reported on 67.2% of returns)
75691:
$4,324
State:
$9,058
(% of AGI for various income ranges: 3.0% for AGIs below $10k, 3.2% for AGIs $10k-25k, 5.5% for AGIs $25k-50k, 8.0% for AGIs $50k-75k, 11.4% for AGIs $75k-100k, 17.1% for AGIs over 100k)
Earned income credit: $1,962 (reported on 26.7% of returns)
Here:
$1,962
State:
$2,024
Percentage of individuals using paid preparers for their 2004 taxes: 68.8%
Here:
69%
State:
57%
(% for various income ranges: 56.8% for AGIs below $10k, 70.0% for AGIs $10k-25k, 74.3% for AGIs $25k-50k, 70.3% for AGIs $50k-75k, 72.1% for AGIs $75k-100k, 70.4% for AGIs over 100k)
Household received Food Stamps/SNAP in the past 12 months: 267 Household did not receive Food Stamps/SNAP in the past 12 months: 1,492
Women who had a birth in the past 12 months: 12 (0 now married, 11 unmarried) Women who did not have a birth in the past 12 months: 971 (398 now married, 574 unmarried)
Housing units in zip code 75691 with a mortgage: 693 (14 second mortgage, 15 both second mortgage and home equity loan) Median monthly owner costs for units with a mortgage: $1,610 Median monthly owner costs for units without a mortgage: $513
Residents with income below the poverty level in 2022:
This zip code:
16.7%
Whole state:
14.0%
Residents with income below 50% of the poverty level in 2022:
This zip code:
13.2%
Whole state:
7.4%
Median number of rooms in houses and condos:
Here:
5.7
State:
6.3
Median number of rooms in apartments:
Here:
4.7
State:
4.0
Notable locations in this zip code not listed on our city pages
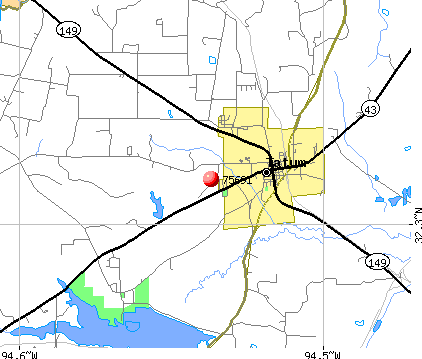
Notable locations in zip code 75691: Tatum on the Santa Fe Museum (A), Tatum Volunteer Fire Department - First Responders (B). Display/hide their locations on the map
Churches in zip code 75691 include: Springfield Church (A), Bethel Church (B), Center Point Church (C), Crystal Farms Church (D), Friendship Church (E), Smith Chapel (F), Chapel Hill Church (G), Zion Hill Church (H), First Baptist Church (I). Display/hide their locations on the map
Lakes and reservoirs: Old River Lakes (A), Hendricks Lakes (B), Doc Young Pond (C), Williams Lake (D), Swiley Lake (E), Martin Lake (F). Display/hide their locations on the map
Streams, rivers, and creeks: Brandy Branch (A), Black Slough (B), Alder Branch (C), Weir Creek (D), Dry Creek (E), Watson Branch (F), Wright Branch (G), Wasson Branch (H), Tenny Lewis Branch (I). Display/hide their locations on the map
Size of family households: 615 2-persons, 187 3-persons, 378 4-persons, 50 5-persons, 72 6-persons
Size of nonfamily households: 306 1-person, 143 2-persons
402 married couples with children.
499 single-parent households (17 men, 482 women).
91.6% of residents of 75691 zip code speak English at home.
8.4% of residents speak Spanish at home (90% very well, 8% well, 1% not well).
0.1% of residents speak Asian or Pacific Island language at home (100% very well).
Foreign born population: 128 (2.8%) (68.5% of them are naturalized citizens)
This zip code:
2.8%
Whole state:
17.2%
86%Honduras
5%France
30%American
5%Irish
4%English
3%French
3%German
3%Scotch-Irish
1%Scottish
Year of entry for the foreign-born population
282010 or later
02000 to 2009
481990 to 1999
81Before 1990
Facilities with environmental interests located in this zip code:
ADAMS AUTO SALVAGE (STATE HWY 43, RT. 1, BOX 172 in TATUM, TX)
(Integrated Compliance Information System) - ICIS-06-2000-0141, FORMAL ENFORCEMENT ACTION Business SIC classification: MOTOR VEHICLE PARTS, USED
Housing units lacking complete plumbing facilities: 2.2% Housing units lacking complete kitchen facilities: 2.8%
87.9%Electricity
9.9%Utility gas
1.9%Bottled, tank, or LP gas
Population in 1990: 4,679.
Place of birth for U.S.-born residents:
This state: 3,209
Northeast: 78
Midwest: 216
South: 648
West: 340
65% of the 75691 zip code residents lived in the same house 5 years ago. Out of people who lived in different houses, 42% lived in this county. Out of people who lived in different counties, 50% lived in Texas.
99% of the 75691 zip code residents lived in the same house 1 year ago. Out of people who lived in different houses, 19% moved from this county. Out of people who lived in different houses, 100% moved from different county within same state. Out of people who lived in different houses, 6% moved from different state.
Private vs. public school enrollment:
Students in private schools in grades 1 to 8 (elementary and middle school): 13
Here:
2.4%
Texas:
8.8%
Students in private schools in grades 9 to 12 (high school): 2
Here:
1.5%
Texas:
8.0%
Students in private undergraduate colleges:
Here:
0.0%
Texas:
16.2%
Occupation by median earnings in the past 12 months ($)
111,771Healthcare support occupations
96,859Business and financial operations occupations
94,276Management occupations
88,216Transportation occupations
66,224Health diagnosing and treating practitioners and other technical occupations
57,631Education, training, and library occupations
Top industries in this zip code by the number of employees in 2005:
Utilities: Electric Power Distribution (250-499 employees: 1 establishment, 5-9 employees: 1 establishment)
Mining: Bituminous Coal and Lignite Surface Mining (250-499: 1)
Utilities: Fossil Fuel Electric Power Generation (100-249: 1, 50-99: 1, 20-49: 1, 5-9: 1)
Accommodation and Food Services: Limited-Service Restaurants (20-49: 1, 1-4: 1)
Construction: Oil and Gas Pipeline and Related Structures Construction (20-49: 1)
Accommodation and Food Services: Full-Service Restaurants (10-19: 1, 5-9: 1)
Finance and Insurance: Commercial Banking (10-19: 1, 1-4: 1)
Fatal accident statistics in 2014:
Fatal accident count: 2
Vehicles involved in fatal accidents: 3
Fatal accidents caused by drunken drivers: 1
Fatalities: 2
Persons involved in fatal accidents: 3
Pedestrians involved in fatal accidents: 0
Fatal accident statistics in 2013:
Fatal accident count: 1
Vehicles involved in fatal accidents: 2
Fatal accidents caused by drunken drivers: 0
Fatalities: 1
Persons involved in fatal accidents: 3
Pedestrians involved in fatal accidents: 0
Home Mortgage Disclosure Act Aggregated Statistics For Year 2009 (Based on 4 partial tracts)
A) FHA, FSA/RHS & VA Home Purchase Loans
B) Conventional Home Purchase Loans
C) Refinancings
D) Home Improvement Loans
F) Non-occupant Loans on < 5 Family Dwellings (A B C & D)
G) Loans On Manufactured Home Dwelling (A B C & D)
Number
Average Value
Number
Average Value
Number
Average Value
Number
Average Value
Number
Average Value
Number
Average Value
LOANS ORIGINATED
10
$173,463
38
$134,915
32
$140,391
38
$41,076
10
$99,415
18
$41,715
APPLICATIONS APPROVED, NOT ACCEPTED
0
$0
5
$124,346
1
$150,420
3
$20,410
2
$70,680
2
$36,775
APPLICATIONS DENIED
2
$116,245
17
$79,014
12
$124,414
5
$10,394
0
$0
13
$41,937
APPLICATIONS WITHDRAWN
2
$124,850
1
$74,290
5
$148,478
3
$78,073
1
$74,290
1
$83,580
FILES CLOSED FOR INCOMPLETENESS
0
$0
0
$0
3
$115,907
0
$0
0
$0
0
$0
Aggregated Statistics For Year 2008 (Based on 4 partial tracts)
A) FHA, FSA/RHS & VA Home Purchase Loans
B) Conventional Home Purchase Loans
C) Refinancings
D) Home Improvement Loans
F) Non-occupant Loans on < 5 Family Dwellings (A B C & D)
G) Loans On Manufactured Home Dwelling (A B C & D)
Number
Average Value
Number
Average Value
Number
Average Value
Number
Average Value
Number
Average Value
Number
Average Value
LOANS ORIGINATED
10
$141,507
56
$158,176
29
$97,512
28
$44,434
18
$122,483
17
$54,661
APPLICATIONS APPROVED, NOT ACCEPTED
0
$0
9
$53,744
7
$107,443
3
$48,150
2
$42,820
6
$52,348
APPLICATIONS DENIED
0
$0
13
$112,685
12
$81,337
6
$28,125
1
$52,070
7
$65,339
APPLICATIONS WITHDRAWN
0
$0
2
$140,505
8
$118,344
1
$7,460
0
$0
3
$75,113
FILES CLOSED FOR INCOMPLETENESS
0
$0
0
$0
0
$0
0
$0
0
$0
0
$0
Aggregated Statistics For Year 2007 (Based on 4 partial tracts)
A) FHA, FSA/RHS & VA Home Purchase Loans
B) Conventional Home Purchase Loans
C) Refinancings
D) Home Improvement Loans
F) Non-occupant Loans on < 5 Family Dwellings (A B C & D)
G) Loans On Manufactured Home Dwelling (A B C & D)
Number
Average Value
Number
Average Value
Number
Average Value
Number
Average Value
Number
Average Value
Number
Average Value
LOANS ORIGINATED
9
$131,591
52
$109,210
28
$94,741
22
$34,266
17
$129,311
17
$51,549
APPLICATIONS APPROVED, NOT ACCEPTED
0
$0
12
$81,888
4
$104,872
2
$23,215
0
$0
8
$57,910
APPLICATIONS DENIED
4
$135,682
14
$75,019
15
$139,071
11
$35,512
1
$141,190
13
$62,299
APPLICATIONS WITHDRAWN
0
$0
3
$144,470
7
$107,973
2
$72,740
1
$52,620
1
$53,610
FILES CLOSED FOR INCOMPLETENESS
0
$0
4
$162,225
3
$152,407
1
$156,830
0
$0
0
$0
Aggregated Statistics For Year 2006 (Based on 4 partial tracts)
A) FHA, FSA/RHS & VA Home Purchase Loans
B) Conventional Home Purchase Loans
C) Refinancings
D) Home Improvement Loans
F) Non-occupant Loans on < 5 Family Dwellings (A B C & D)
G) Loans On Manufactured Home Dwelling (A B C & D)
Number
Average Value
Number
Average Value
Number
Average Value
Number
Average Value
Number
Average Value
Number
Average Value
LOANS ORIGINATED
8
$120,350
61
$120,354
31
$101,847
34
$40,164
17
$162,081
18
$65,627
APPLICATIONS APPROVED, NOT ACCEPTED
1
$37,140
11
$56,455
2
$62,075
4
$31,722
0
$0
11
$45,722
APPLICATIONS DENIED
1
$117,630
42
$57,215
19
$72,878
4
$56,962
1
$83,370
33
$44,658
APPLICATIONS WITHDRAWN
0
$0
3
$53,433
24
$77,956
0
$0
3
$36,837
1
$87,810
FILES CLOSED FOR INCOMPLETENESS
0
$0
0
$0
3
$96,300
0
$0
0
$0
0
$0
Aggregated Statistics For Year 2005 (Based on 4 partial tracts)
A) FHA, FSA/RHS & VA Home Purchase Loans
B) Conventional Home Purchase Loans
C) Refinancings
D) Home Improvement Loans
F) Non-occupant Loans on < 5 Family Dwellings (A B C & D)
G) Loans On Manufactured Home Dwelling (A B C & D)
Number
Average Value
Number
Average Value
Number
Average Value
Number
Average Value
Number
Average Value
Number
Average Value
LOANS ORIGINATED
3
$112,123
71
$103,097
21
$66,463
25
$36,945
10
$124,964
19
$49,716
APPLICATIONS APPROVED, NOT ACCEPTED
1
$56,750
20
$57,686
3
$59,183
1
$11,350
1
$91,830
18
$50,098
APPLICATIONS DENIED
1
$137,230
32
$72,972
30
$75,701
9
$29,986
1
$52,080
29
$56,771
APPLICATIONS WITHDRAWN
0
$0
9
$114,696
4
$93,445
4
$188,882
2
$170,715
0
$0
FILES CLOSED FOR INCOMPLETENESS
1
$100,080
5
$59,638
9
$88,102
0
$0
0
$0
0
$0
Aggregated Statistics For Year 2004 (Based on 4 partial tracts)
A) FHA, FSA/RHS & VA Home Purchase Loans
B) Conventional Home Purchase Loans
C) Refinancings
D) Home Improvement Loans
F) Non-occupant Loans on < 5 Family Dwellings (A B C & D)
G) Loans On Manufactured Home Dwelling (A B C & D)
Detailed PMIC statistics for the following Tracts:9501.00
, 9506.00
2003 - 2018 National Fire Incident Reporting System (NFIRS) incidents
According to the data from the years 2003 - 2018 the average number of fires per year is 24. The highest number of reported fires - 63 took place in 2015, and the least - 5 in 2007. The data has a growing trend.
When looking into fire subcategories, the most reports belonged to: Outside Fires (56.8%), and Structure Fires (23.9%).
Fire incident types reported to NFIRS in Zip Code 75691

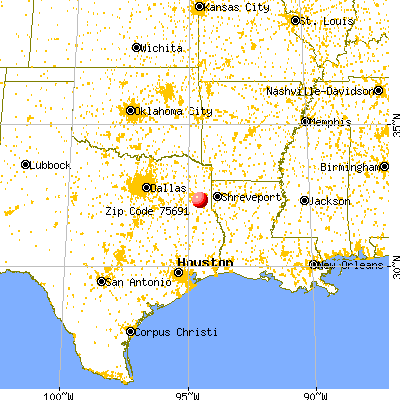


 Nearest zip codes: 75641, 75631, 75602, 75603, 75652, 75650.


 According to the data from the years 2003 - 2018 the average number of fires per year is 24. The highest number of reported fires - 63 took place in 2015, and the least - 5 in 2007. The data has a growing trend.
 When looking into fire subcategories, the most reports belonged to: Outside Fires (56.8%), and Structure Fires (23.9%).