Estimated zip code population in 2022: 8,157 Zip code population in 2010: 7,607 Zip code population in 2000: 4,535
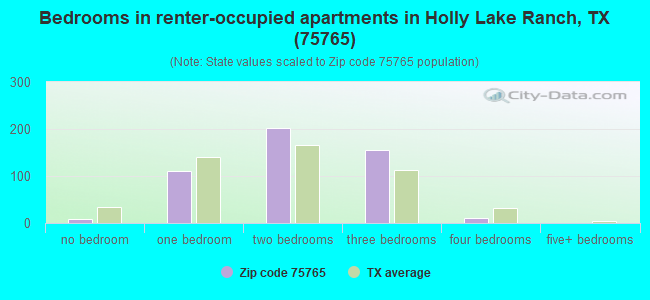
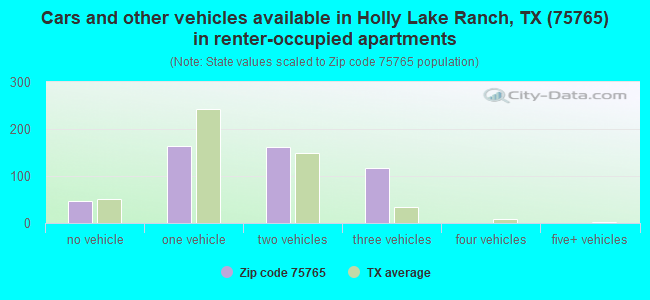
Houses and condos: 4,437 Renter-occupied apartments: 493
% of renters here:
15%
State:
38%
March 2022 cost of living index in zip code 75765: 79.8 (low, U.S. average is 100)
Land area: 102.1 sq. mi. Water area: 3.4 sq. mi.
Population density: 80 people per square mile
(very low).
OSM Map
General Map
Google Map
MSN Map
OSM Map
General Map
Google Map
MSN Map
OSM Map
General Map
Google Map
MSN Map
OSM Map
General Map
Google Map
MSN Map
Please wait while loading the map...
Real estate property taxes paid for housing units in 2022:
This zip code:
1.1% ($2,048)
Texas:
1.5% ($4,050)
Median real estate property taxes paid for housing units with mortgages in 2022: $2,585 (1.1%) Median real estate property taxes paid for housing units with no mortgage in 2022: $1,699 (1.1%)
Business Search- 14 Million verified businesses
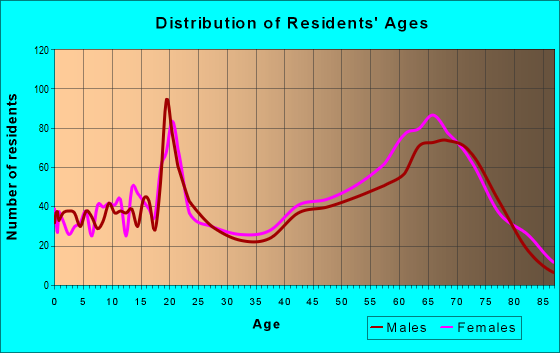
Males: 3,795
(46.5%)
Females: 4,362
(53.5%)
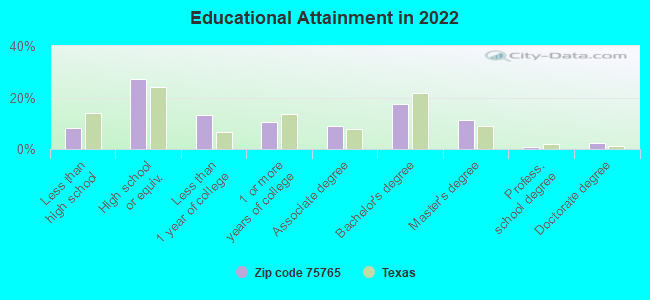
For population 25 years and over in 75765:
High school or higher: 93.0%
Bachelor's degree or higher: 32.5%
Graduate or professional degree: 14.6%
Unemployed: 7.5%
Mean travel time to work (commute): 32.0 minutes
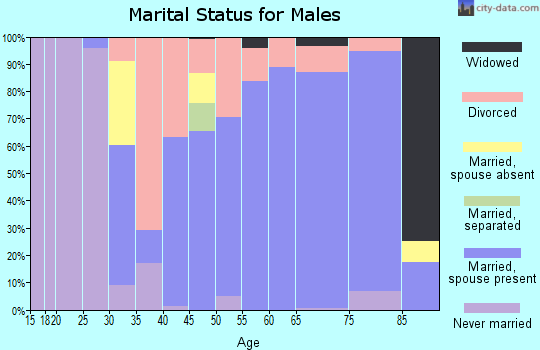
For population 15 years and over in 75765:
Never married: 27.8%
Now married: 54.0%
Separated: 1.3%
Widowed: 7.6%
Divorced: 9.3%
Zip code 75765 compared to state average:
Unemployed percentage above state average.
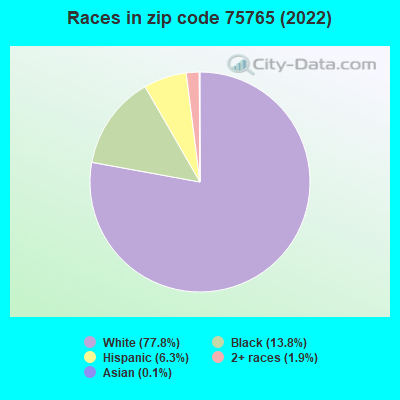
Hispanic race population percentage significantly below state average.
Median age significantly above state average.
Foreign-born population percentage significantly below state average.
Renting percentage significantly below state average.
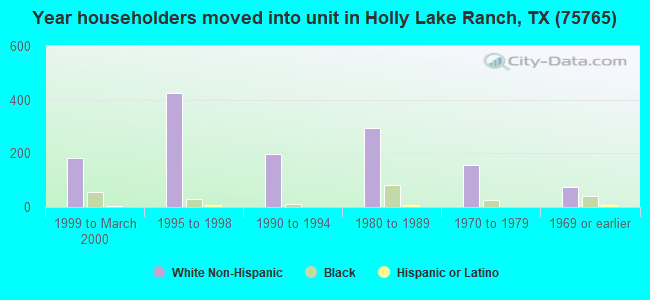
Length of stay since moving in significantly above state average.
Averages for the 2020 tax year for zip code 75765, filed in 2021:
Average Adjusted Gross Income (AGI) in 2020: $60,080 (Individual Income Tax Returns)
Here:
$60,080
State:
$77,054
Salary/wage: $50,241 (reported on 67.4% of returns)
Here:
$50,241
State:
$62,766
(% of AGI for various income ranges: 969.4% for AGIs below $25k, 2890.2% for AGIs $25k-50k, 4844.4% for AGIs $50k-75k, 7205.0% for AGIs $75k-100k, 13296.4% for AGIs $100k-200k, 48582.5% for AGIs over 200k)
Taxable interest for individuals: $1,258 (reported on 36.9% of returns)
This zip code:
$1,258
Texas:
$2,665
(% of AGI for various income ranges: 40.5% for AGIs below $25k, 32.2% for AGIs $25k-50k, 56.9% for AGIs $50k-75k, 110.0% for AGIs $75k-100k, 140.7% for AGIs $100k-200k, 542.5% for AGIs over 200k)
Ordinary dividends: $5,305 (reported on 19.0% of returns)
Here:
$5,305
State:
$10,044
(% of AGI for various income ranges: 34.0% for AGIs below $25k, 48.1% for AGIs $25k-50k, 124.4% for AGIs $50k-75k, 200.9% for AGIs $75k-100k, 385.0% for AGIs $100k-200k, 2285.0% for AGIs over 200k)
Net capital gain/loss in AGI: +$10,790 (reported on 17.9% of returns)
Here:
+$10,790
State:
+$39,590
(% of AGI for various income ranges: 30.6% for AGIs $25k-50k, 62.6% for AGIs $50k-75k, 183.2% for AGIs $75k-100k, 1007.1% for AGIs $100k-200k, 7662.5% for AGIs over 200k)
Profit/loss from business: +$11,259 (reported on 17.6% of returns)
Here:
+$11,259
State:
+$10,888
(% of AGI for various income ranges: 97.1% for AGIs below $25k, 141.9% for AGIs $25k-50k, 260.0% for AGIs $50k-75k, 407.3% for AGIs $75k-100k, 856.1% for AGIs $100k-200k, 2177.5% for AGIs over 200k)
Taxable individual retirement arrangement distribution: $22,657 (reported on 16.7% of returns)
75765:
$22,657
Texas:
$24,740
(% of AGI for various income ranges: 98.9% for AGIs below $25k, 269.8% for AGIs $25k-50k, 590.0% for AGIs $50k-75k, 879.1% for AGIs $75k-100k, 1877.9% for AGIs $100k-200k, 2842.5% for AGIs over 200k)
Total itemized deductions: $35,862 (reported on 4.6% of returns)
Here:
$35,862
State:
$40,428
(% of AGI for various income ranges: 149.5% for AGIs $25k-50k, 154.4% for AGIs $50k-75k, 454.5% for AGIs $75k-100k, 668.9% for AGIs $100k-200k, 3302.5% for AGIs over 200k)
Charity contributions: $13,317 (reported on 3.5% of returns)
Here:
$13,317
State:
$18,201
(% of AGI for various income ranges: 32.9% for AGIs $25k-50k, 129.1% for AGIs $75k-100k, 235.0% for AGIs $100k-200k, 1122.5% for AGIs over 200k)
Taxes paid: $5,194 (reported on 4.6% of returns)
75765:
$5,194
State:
$7,821
(% of AGI for various income ranges: 26.0% for AGIs $25k-50k, 37.3% for AGIs $75k-100k, 128.2% for AGIs $100k-200k, 565.0% for AGIs over 200k)
Earned income credit: $2,298 (reported on 15.0% of returns)
Here:
$2,298
State:
$2,584
(% of AGI for various income ranges: 88.4% for AGIs below $25k, 74.6% for AGIs $25k-50k)
Percentage of individuals using paid preparers for their 2020 taxes: 92.2%
Here:
92%
State:
92%
(% for various income ranges: 91.4% for AGIs below $25k, 93.8% for AGIs $25k-50k, 91.1% for AGIs $50k-75k, 91.4% for AGIs $75k-100k, 94.0% for AGIs $100k-200k, 90.0% for AGIs over 200k)
Averages for the 2012 tax year for zip code 75765, filed in 2013:
Average Adjusted Gross Income (AGI) in 2012: $51,966 (Individual Income Tax Returns)
Here:
$51,966
State:
$65,384
Salary/wage: $43,229 (reported on 69.7% of returns)
Here:
$43,229
State:
$52,524
(% of AGI for various income ranges: 57.5% for AGIs below $25k, 62.6% for AGIs $25k-50k, 57.8% for AGIs $50k-75k, 56.6% for AGIs $75k-100k, 56.6% for AGIs $100k-200k, 56.8% for AGIs over 200k)
Taxable interest for individuals: $1,155 (reported on 39.8% of returns)
This zip code:
$1,155
Texas:
$2,372
(% of AGI for various income ranges: 1.4% for AGIs below $25k, 1.0% for AGIs $25k-50k, 0.8% for AGIs $50k-75k, 0.6% for AGIs $75k-100k, 0.8% for AGIs $100k-200k, 1.0% for AGIs over 200k)
Ordinary dividends: $4,654 (reported on 19.4% of returns)
Here:
$4,654
State:
$9,721
(% of AGI for various income ranges: 2.4% for AGIs below $25k, 1.3% for AGIs $25k-50k, 1.4% for AGIs $50k-75k, 1.5% for AGIs $75k-100k, 1.9% for AGIs $100k-200k, 2.3% for AGIs over 200k)
Net capital gain/loss in AGI: +$5,372 (reported on 17.4% of returns)
Here:
+$5,372
State:
+$35,319
(% of AGI for various income ranges: 0.4% for AGIs $25k-50k, 0.5% for AGIs $50k-75k, 1.5% for AGIs $75k-100k, 2.1% for AGIs $100k-200k, 7.2% for AGIs over 200k)
Profit/loss from business: +$10,107 (reported on 18.1% of returns)
Here:
+$10,107
State:
+$13,732
(% of AGI for various income ranges: 7.5% for AGIs below $25k, 3.6% for AGIs $25k-50k, 3.1% for AGIs $50k-75k, 2.8% for AGIs $75k-100k, 4.6% for AGIs $100k-200k)
Taxable individual retirement arrangement distribution: $17,838 (reported on 22.4% of returns)
75765:
$17,838
Texas:
$19,511
(% of AGI for various income ranges: 9.1% for AGIs below $25k, 7.6% for AGIs $25k-50k, 7.6% for AGIs $50k-75k, 7.8% for AGIs $75k-100k, 8.6% for AGIs $100k-200k, 4.9% for AGIs over 200k)
Total itemized deductions: $20,359 (23% of AGI, reported on 24.7% of returns)
Here:
$20,359
State:
$24,724
Here:
22.5% of AGI
State:
15.9% of AGI
(% of AGI for various income ranges: 11.2% for AGIs below $25k, 9.6% for AGIs $25k-50k, 8.9% for AGIs $50k-75k, 10.2% for AGIs $75k-100k, 10.6% for AGIs $100k-200k, 7.2% for AGIs over 200k)
Charity contributions: $6,244 (reported on 20.7% of returns)
Here:
$6,244
State:
$6,808
(% of AGI for various income ranges: 1.5% for AGIs below $25k, 1.8% for AGIs $25k-50k, 2.1% for AGIs $50k-75k, 2.3% for AGIs $75k-100k, 3.5% for AGIs $100k-200k, 3.0% for AGIs over 200k)
Taxes paid: $4,335 (reported on 24.3% of returns)
75765:
$4,335
State:
$6,921
(% of AGI for various income ranges: 1.9% for AGIs below $25k, 1.6% for AGIs $25k-50k, 1.8% for AGIs $50k-75k, 2.2% for AGIs $75k-100k, 2.6% for AGIs $100k-200k, 1.7% for AGIs over 200k)
Earned income credit: $2,173 (reported on 17.1% of returns)
Here:
$2,173
State:
$2,570
(% of AGI for various income ranges: 5.9% for AGIs below $25k, 1.0% for AGIs $25k-50k)
Percentage of individuals using paid preparers for their 2012 taxes: 50.7%
Here:
51%
State:
51%
(% for various income ranges: 45.1% for AGIs below $25k, 47.4% for AGIs $25k-50k, 55.3% for AGIs $50k-75k, 54.8% for AGIs $75k-100k, 63.3% for AGIs $100k-200k, 80.0% for AGIs over 200k)
Averages for the 2004 tax year for zip code 75765, filed in 2005:
Average Adjusted Gross Income (AGI) in 2004: $35,738 (Individual Income Tax Returns)
Here:
$35,738
State:
$47,881
Salary/wage: $30,505 (reported on 80.2% of returns)
Here:
$30,505
State:
$41,947
(% of AGI for various income ranges: 152.5% for AGIs below $10k, 73.1% for AGIs $10k-25k, 76.2% for AGIs $25k-50k, 75.6% for AGIs $50k-75k, 66.8% for AGIs $75k-100k, 45.2% for AGIs over 100k)
Taxable interest for individuals: $1,641 (reported on 36.0% of returns)
This zip code:
$1,641
Texas:
$2,255
(% of AGI for various income ranges: 6.0% for AGIs below $10k, 2.2% for AGIs $10k-25k, 1.4% for AGIs $25k-50k, 1.3% for AGIs $50k-75k, 1.6% for AGIs $75k-100k, 1.7% for AGIs over 100k)
Taxable dividends: $3,973 (reported on 15.9% of returns)
Here:
$3,973
State:
$4,261
(% of AGI for various income ranges: 4.4% for AGIs below $10k, 2.8% for AGIs $10k-25k, 0.7% for AGIs $25k-50k, 2.0% for AGIs $50k-75k, 1.3% for AGIs $75k-100k, 2.2% for AGIs over 100k)
Net capital gain/loss: +$6,796 (reported on 14.9% of returns)
Here:
+$6,796
State:
+$16,110
(% of AGI for various income ranges: 0.6% for AGIs below $10k, -0.4% for AGIs $10k-25k, 0.7% for AGIs $25k-50k, 1.6% for AGIs $50k-75k, 3.2% for AGIs $75k-100k, 8.4% for AGIs over 100k)
Profit/loss from business: +$6,262 (reported on 20.7% of returns)
Here:
+$6,262
State:
+$11,013
(% of AGI for various income ranges: 8.9% for AGIs below $10k, 6.4% for AGIs $10k-25k, 4.1% for AGIs $25k-50k, 1.9% for AGIs $50k-75k, 3.8% for AGIs $75k-100k, 2.7% for AGIs over 100k)
IRA payment deduction: $3,000 (reported on 2.3% of returns)
75765:
$3,000
Texas:
$3,120
(% of AGI for various income ranges: 1.7% for AGIs below $10k, 0.1% for AGIs $25k-50k, 0.2% for AGIs $50k-75k, 0.7% for AGIs $75k-100k)
Total itemized deductions: $18,036 (25% of AGI, reported on 17.5% of returns)
Here:
$18,036
State:
$19,631
Here:
25.1% of AGI
State:
18.9% of AGI
(% of AGI for various income ranges: 23.0% for AGIs below $10k, 6.3% for AGIs $10k-25k, 7.3% for AGIs $25k-50k, 10.0% for AGIs $50k-75k, 10.9% for AGIs $75k-100k, 8.9% for AGIs over 100k)
Charity contributions deductions: $4,647 (6% of AGI, reported on 15.2% of returns)
Here:
$4,647
State:
$4,753
Here:
6.1% of AGI
State:
4.2% of AGI
(% of AGI for various income ranges: 0.9% for AGIs $10k-25k, 1.3% for AGIs $25k-50k, 2.3% for AGIs $50k-75k, 2.2% for AGIs $75k-100k, 3.1% for AGIs over 100k)
Total tax: $5,183 (reported on 70.3% of returns)
75765:
$5,183
State:
$9,058
(% of AGI for various income ranges: 6.9% for AGIs below $10k, 3.5% for AGIs $10k-25k, 6.8% for AGIs $25k-50k, 8.4% for AGIs $50k-75k, 11.0% for AGIs $75k-100k, 19.5% for AGIs over 100k)
Earned income credit: $1,824 (reported on 22.1% of returns)
Here:
$1,824
State:
$2,024
Percentage of individuals using paid preparers for their 2004 taxes: 59.7%
Here:
60%
State:
57%
(% for various income ranges: 56.5% for AGIs below $10k, 61.7% for AGIs $10k-25k, 59.2% for AGIs $25k-50k, 58.3% for AGIs $50k-75k, 63.4% for AGIs $75k-100k, 66.7% for AGIs over 100k)
Household received Food Stamps/SNAP in the past 12 months: 282 Household did not receive Food Stamps/SNAP in the past 12 months: 3,008
Women who had a birth in the past 12 months: 33 (21 now married, 11 unmarried) Women who did not have a birth in the past 12 months: 1,502 (698 now married, 803 unmarried)
Housing units in zip code 75765 with a mortgage: 1,212 (55 second mortgage, 38 both second mortgage and home equity loan) Houses without a mortgage: 15
Median monthly owner costs for units with a mortgage: $1,401 Median monthly owner costs for units without a mortgage: $544
Residents with income below the poverty level in 2022:
This zip code:
10.2%
Whole state:
14.0%
Residents with income below 50% of the poverty level in 2022:
This zip code:
5.4%
Whole state:
7.4%
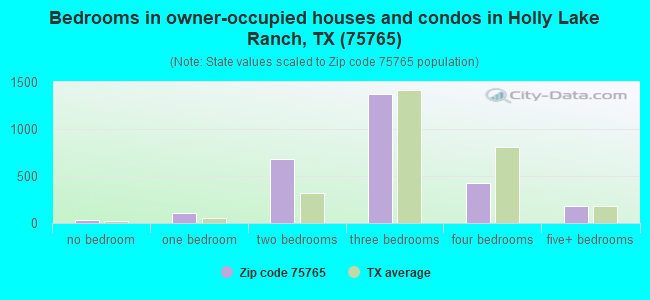
Median number of rooms in houses and condos:
Here:
5.7
State:
6.3
Median number of rooms in apartments:
Here:
4.4
State:
4.0
Notable locations in this zip code not listed on our city pages
Notable locations in zip code 75765: Clonts Ranch (A), Hawkins Camp (B), Brookhaven Lodge (C), Galena Park Branch Library (D), Flores Branch Library (E), Fairmont Branch Library (F), Kingwood Branch Library (G), Jacinto City Branch Library (H), Hawkins Volunteer Fire Department (I), Holly Lake Volunteer Fire Department (J). Display/hide their locations on the map
Churches in zip code 75765 include: Stagner Church (A), Bethlehem Church (B), Liberty Church (C), Maple Springs Church (D), Peron Church (E). Display/hide their locations on the map
Cemeteries: Old Fouke Cemetery (1), Fouke Cemetery (2), Gentry Cemetery (3), Haney Cemetery (4), Ray Cemetery (5), Jarvis College Cemetery (6), Kay Cemetery (7). Display/hide their locations on the map
Lakes, reservoirs, and swamps: Wisenbaker Lake (A), Moore Lake (B), Deep Eddy (C), Lake Greenbriar (D), Glaspy Lake (E), Childress Pond (F), Bradford Lake (G), West Lakes (H). Display/hide their locations on the map
Streams, rivers, and creeks: White Oak Creek (A), Stagner Branch (B), Sand Branch (C), Red Branch (D), Poley Branch (E), Peron Branch (F), Parker Branch (G), Nichols Branch (H), Mulberry Creek (I). Display/hide their locations on the map
In group quarters: 548 (-1 institutionalized population)
Size of family households: 1,234 2-persons, 439 3-persons, 169 4-persons, 155 5-persons, 105 6-persons, 31 7-or-more-persons
Size of nonfamily households: 1,046 1-person, 134 2-persons
898 married couples with children.
294 single-parent households (25 men, 269 women).
94.4% of residents of 75765 zip code speak English at home.
5.1% of residents speak Spanish at home (88% very well, 7% well, 5% not well).
1.0% of residents speak other Indo-European language at home (79% very well, 14% well, 7% not well).
0.1% of residents speak Asian or Pacific Island language at home (100% very well).
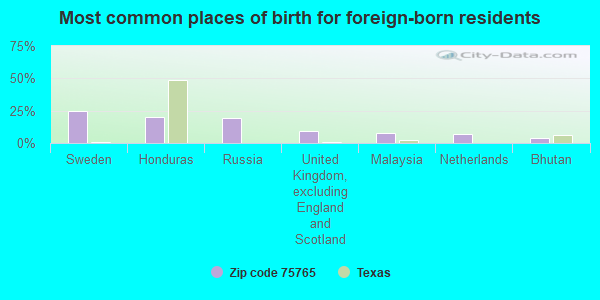
Foreign born population: 148 (1.8%) (41.4% of them are naturalized citizens)
This zip code:
1.8%
Whole state:
17.2%
25%Sweden
20%Honduras
19%Russia
9%United Kingdom, excluding England and Scotland
8%Malaysia
7%Netherlands
4%Bhutan
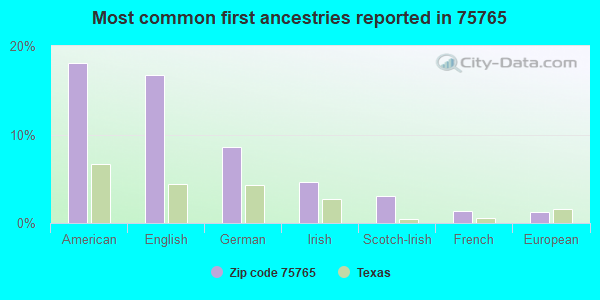
18%American
17%English
9%German
5%Irish
3%Scotch-Irish
1%French
1%European
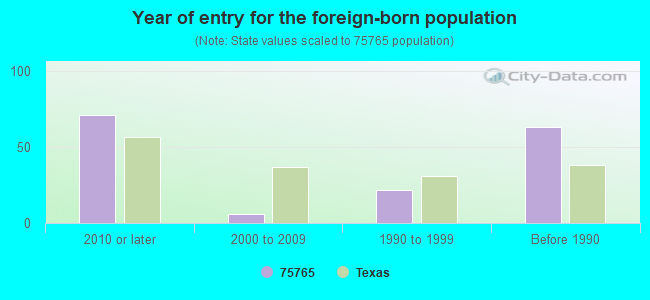
Year of entry for the foreign-born population
712010 or later
62000 to 2009
221990 to 1999
63Before 1990
Facilities with environmental interests located in this zip code:
AGROPLUS, INC. (5420 S. FM 14 in HAWKINS, TX)
(Integrated Compliance Information System) - ICIS-06-2003-0357, FORMAL ENFORCEMENT ACTION
AIR SEPARATION FACILITY (HAWKINS in HAWKINS, TX)
CRITERIA AND HAZARDOUS AIR POLLUTANT INVENTORY (Inventory of air pollution sources) Business SIC classification: INDUSTRIAL GASES
Housing units lacking complete plumbing facilities: 8.4% Housing units lacking complete kitchen facilities: 1.5%
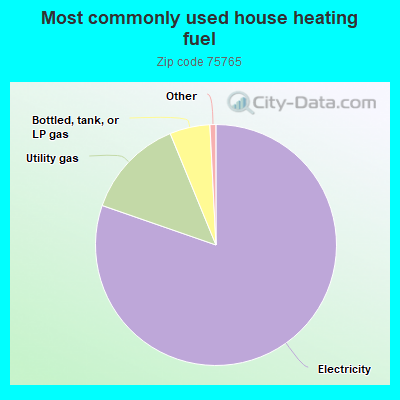
80.4%Electricity
13.5%Utility gas
5.4%Bottled, tank, or LP gas
Population in 1990: 4,968.
Place of birth for U.S.-born residents:
This state: 4,867
Northeast: 588
Midwest: 699
South: 877
West: 986
56% of the 75765 zip code residents lived in the same house 5 years ago. Out of people who lived in different houses, 38% lived in this county. Out of people who lived in different counties, 50% lived in Texas.
89% of the 75765 zip code residents lived in the same house 1 year ago. Out of people who lived in different houses, 27% moved from this county. Out of people who lived in different houses, 53% moved from different county within same state. Out of people who lived in different houses, 24% moved from different state.
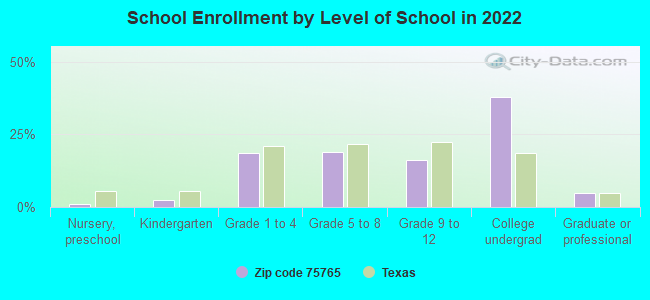
Private vs. public school enrollment:
Students in private schools in grades 1 to 8 (elementary and middle school): 109
Here:
15.9%
Texas:
8.8%
Students in private schools in grades 9 to 12 (high school): 68
Here:
23.0%
Texas:
8.0%
Students in private undergraduate colleges: 132
Here:
19.1%
Texas:
16.2%
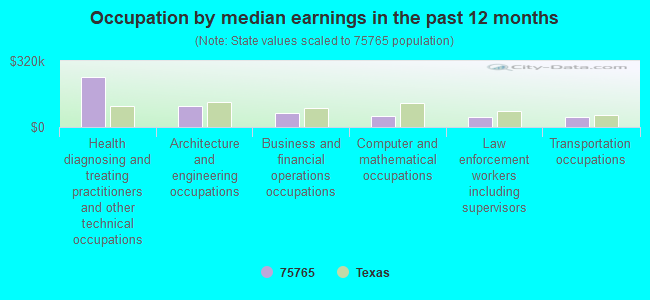
Occupation by median earnings in the past 12 months ($)
243,769Health diagnosing and treating practitioners and other technical occupations
103,982Architecture and engineering occupations
66,145Business and financial operations occupations
54,830Computer and mathematical occupations
50,185Law enforcement workers including supervisors
46,426Transportation occupations
Top industries in this zip code by the number of employees in 2005:
Educational Services: Colleges, Universities, and Professional Schools (100-249 employees: 1 establishment)
Mining: Natural Gas Liquid Extraction (50-99: 1)
Accommodation and Food Services: Limited-Service Restaurants (20-49: 2)
Accommodation and Food Services: Full-Service Restaurants (20-49: 1, 10-19: 1)
Other Services (except Public Administration): Religious Organizations (10-19: 1, 5-9: 4)
Other Services (except Public Administration): Civic and Social Organizations (20-49: 1)
Real Estate and Rental and Leasing: Residential Property Managers (20-49: 1)
People in group quarters in 2010:
427 people in college/university student housing
31 people in group homes intended for adults
27 people in residential treatment centers for juveniles (non-correctional)
People in group quarters in 2000:
373 people in college dormitories (includes college quarters off campus)
42 people in other noninstitutional group quarters
30 people in nursing homes
Fatal accident statistics in 2014:
Fatal accident count: 1
Vehicles involved in fatal accidents: 2
Fatal accidents caused by drunken drivers: 0
Fatalities: 1
Persons involved in fatal accidents: 2
Pedestrians involved in fatal accidents: 0
Fatal accident statistics in 2013:
Fatal accident count: 3
Vehicles involved in fatal accidents: 3
Fatal accidents caused by drunken drivers: 0
Fatalities: 3
Persons involved in fatal accidents: 5
Pedestrians involved in fatal accidents: 0
2003 - 2018 National Fire Incident Reporting System (NFIRS) incidents
According to the data from the years 2003 - 2018 the average number of fire incidents per year is 43. The highest number of fire incidents - 154 took place in 2006, and the least - 4 in 2013. The data has a growing trend.
When looking into fire subcategories, the most reports belonged to: Outside Fires (69.0%), and Structure Fires (24.6%).
Fire incident types reported to NFIRS in Zip Code 75765


 Nearest zip codes: 75755, 75706, 75792, 75773, 75708, 75771.
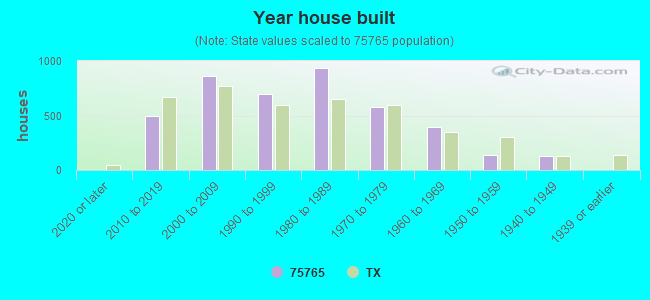


 According to the data from the years 2003 - 2018 the average number of fire incidents per year is 43. The highest number of fire incidents - 154 took place in 2006, and the least - 4 in 2013. The data has a growing trend.
 When looking into fire subcategories, the most reports belonged to: Outside Fires (69.0%), and Structure Fires (24.6%).