Estimated zip code population in 2022: 5,290 Zip code population in 2010: 5,386 Zip code population in 2000: 4,819
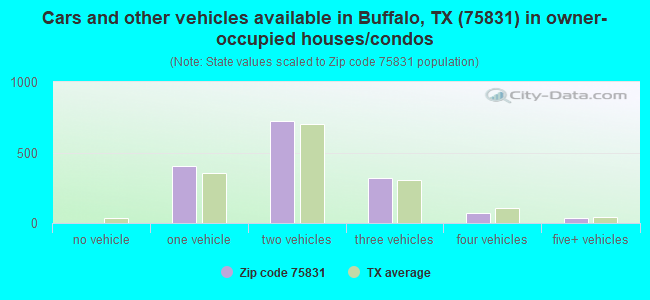
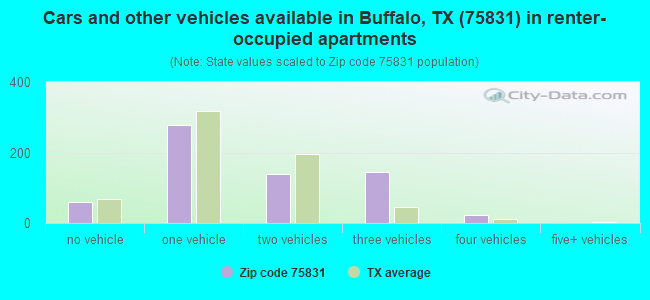
Houses and condos: 2,836 Renter-occupied apartments: 648
% of renters here:
30%
State:
38%
March 2022 cost of living index in zip code 75831: 78.9 (low, U.S. average is 100)
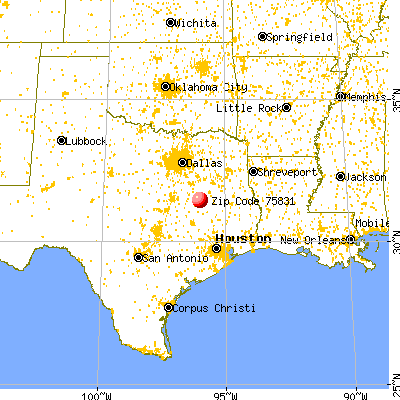
Land area: 255.2 sq. mi. Water area: 1.3 sq. mi.
Population density: 21 people per square mile
(very low).
OSM Map
General Map
Google Map
MSN Map
OSM Map
General Map
Google Map
MSN Map
OSM Map
General Map
Google Map
MSN Map
OSM Map
General Map
Google Map
MSN Map
Please wait while loading the map...
Real estate property taxes paid for housing units in 2022:
This zip code:
0.6% ($667)
Texas:
1.5% ($4,050)
Median real estate property taxes paid for housing units with mortgages in 2022: $2,005 (0.8%) Median real estate property taxes paid for housing units with no mortgage in 2022: $561 (0.6%)
Averages for the 2020 tax year for zip code 75831, filed in 2021:
Average Adjusted Gross Income (AGI) in 2020: $55,002 (Individual Income Tax Returns)
Here:
$55,002
State:
$77,054
Salary/wage: $48,732 (reported on 80.3% of returns)
Here:
$48,732
State:
$62,766
(% of AGI for various income ranges: 1279.5% for AGIs below $25k, 3983.7% for AGIs $25k-50k, 6570.5% for AGIs $50k-75k, 10377.7% for AGIs $75k-100k, 16916.0% for AGIs $100k-200k, 49015.0% for AGIs over 200k)
Taxable interest for individuals: $2,447 (reported on 24.3% of returns)
This zip code:
$2,447
Texas:
$2,665
(% of AGI for various income ranges: 19.7% for AGIs below $25k, 47.9% for AGIs $25k-50k, 76.7% for AGIs $50k-75k, 106.2% for AGIs $75k-100k, 306.7% for AGIs $100k-200k, 1190.0% for AGIs over 200k)
Ordinary dividends: $6,176 (reported on 15.1% of returns)
Here:
$6,176
State:
$10,044
(% of AGI for various income ranges: 19.0% for AGIs below $25k, 46.6% for AGIs $25k-50k, 99.0% for AGIs $50k-75k, 354.6% for AGIs $75k-100k, 394.7% for AGIs $100k-200k, 2430.0% for AGIs over 200k)
Net capital gain/loss in AGI: +$12,339 (reported on 14.2% of returns)
Here:
+$12,339
State:
+$39,590
(% of AGI for various income ranges: 0.3% for AGIs below $25k, 40.3% for AGIs $25k-50k, 153.8% for AGIs $50k-75k, 113.8% for AGIs $75k-100k, 840.7% for AGIs $100k-200k, 9690.0% for AGIs over 200k)
Profit/loss from business: +$10,898 (reported on 20.2% of returns)
Here:
+$10,898
State:
+$10,888
(% of AGI for various income ranges: 154.0% for AGIs below $25k, 111.6% for AGIs $25k-50k, 273.3% for AGIs $50k-75k, 421.5% for AGIs $75k-100k, 1550.0% for AGIs $100k-200k)
Taxable individual retirement arrangement distribution: $21,929 (reported on 9.6% of returns)
75831:
$21,929
Texas:
$24,740
(% of AGI for various income ranges: 64.3% for AGIs below $25k, 141.3% for AGIs $25k-50k, 311.9% for AGIs $50k-75k, 626.2% for AGIs $75k-100k, 1475.3% for AGIs $100k-200k)
Total itemized deductions: $30,775 (reported on 5.5% of returns)
Here:
$30,775
State:
$40,428
(% of AGI for various income ranges: 71.3% for AGIs below $25k, 202.1% for AGIs $25k-50k, 501.9% for AGIs $50k-75k, 962.0% for AGIs $100k-200k)
Charity contributions: $8,871 (reported on 3.2% of returns)
Here:
$8,871
State:
$18,201
(% of AGI for various income ranges: 92.4% for AGIs $50k-75k, 284.7% for AGIs $100k-200k)
Taxes paid: $5,183 (reported on 5.5% of returns)
75831:
$5,183
State:
$7,821
(% of AGI for various income ranges: 10.3% for AGIs below $25k, 41.1% for AGIs $25k-50k, 89.0% for AGIs $50k-75k, 144.7% for AGIs $100k-200k)
Earned income credit: $2,689 (reported on 20.2% of returns)
Here:
$2,689
State:
$2,584
(% of AGI for various income ranges: 140.7% for AGIs below $25k, 89.2% for AGIs $25k-50k)
Percentage of individuals using paid preparers for their 2020 taxes: 92.2%
Here:
92%
State:
92%
(% for various income ranges: 92.7% for AGIs below $25k, 88.9% for AGIs $25k-50k, 93.3% for AGIs $50k-75k, 95.2% for AGIs $75k-100k, 92.3% for AGIs $100k-200k, 100.0% for AGIs over 200k)
Averages for the 2012 tax year for zip code 75831, filed in 2013:
Average Adjusted Gross Income (AGI) in 2012: $56,627 (Individual Income Tax Returns)
Here:
$56,627
State:
$65,384
Salary/wage: $45,716 (reported on 82.3% of returns)
Here:
$45,716
State:
$52,524
(% of AGI for various income ranges: 74.5% for AGIs below $25k, 82.8% for AGIs $25k-50k, 76.9% for AGIs $50k-75k, 77.0% for AGIs $75k-100k, 73.7% for AGIs $100k-200k, 25.9% for AGIs over 200k)
Taxable interest for individuals: $2,283 (reported on 29.6% of returns)
This zip code:
$2,283
Texas:
$2,372
(% of AGI for various income ranges: 1.8% for AGIs below $25k, 0.9% for AGIs $25k-50k, 1.8% for AGIs $50k-75k, 1.3% for AGIs $75k-100k, 0.5% for AGIs $100k-200k, 1.4% for AGIs over 200k)
Ordinary dividends: $4,261 (reported on 16.3% of returns)
Here:
$4,261
State:
$9,721
(% of AGI for various income ranges: 0.9% for AGIs below $25k, 0.9% for AGIs $25k-50k, 1.2% for AGIs $50k-75k, 1.1% for AGIs $75k-100k, 1.0% for AGIs $100k-200k, 1.9% for AGIs over 200k)
Net capital gain/loss in AGI: +$7,623 (reported on 12.8% of returns)
Here:
+$7,623
State:
+$35,319
(% of AGI for various income ranges: 0.1% for AGIs below $25k, 0.6% for AGIs $25k-50k, 0.8% for AGIs $50k-75k, 0.7% for AGIs $75k-100k, 6.0% for AGIs $100k-200k)
Profit/loss from business: +$13,200 (reported on 18.7% of returns)
Here:
+$13,200
State:
+$13,732
(% of AGI for various income ranges: 6.8% for AGIs below $25k, 3.1% for AGIs $25k-50k, 2.5% for AGIs $50k-75k, 3.1% for AGIs $75k-100k, 10.5% for AGIs $100k-200k)
Taxable individual retirement arrangement distribution: $18,043 (reported on 10.3% of returns)
75831:
$18,043
Texas:
$19,511
(% of AGI for various income ranges: 4.1% for AGIs below $25k, 2.5% for AGIs $25k-50k, 4.3% for AGIs $50k-75k, 4.1% for AGIs $75k-100k, 5.3% for AGIs $100k-200k)
Total itemized deductions: $23,586 (24% of AGI, reported on 17.2% of returns)
Here:
$23,586
State:
$24,724
Here:
23.6% of AGI
State:
15.9% of AGI
(% of AGI for various income ranges: 9.9% for AGIs below $25k, 7.4% for AGIs $25k-50k, 8.4% for AGIs $50k-75k, 6.8% for AGIs $75k-100k, 8.0% for AGIs $100k-200k, 4.3% for AGIs over 200k)
Charity contributions: $6,200 (reported on 12.3% of returns)
Here:
$6,200
State:
$6,808
(% of AGI for various income ranges: 0.9% for AGIs below $25k, 1.1% for AGIs $25k-50k, 1.6% for AGIs $50k-75k, 1.6% for AGIs $75k-100k, 2.6% for AGIs $100k-200k)
Taxes paid: $4,329 (reported on 17.2% of returns)
75831:
$4,329
State:
$6,921
(% of AGI for various income ranges: 1.3% for AGIs below $25k, 0.9% for AGIs $25k-50k, 1.0% for AGIs $50k-75k, 1.1% for AGIs $75k-100k, 1.4% for AGIs $100k-200k, 2.0% for AGIs over 200k)
Earned income credit: $2,312 (reported on 19.7% of returns)
Here:
$2,312
State:
$2,570
(% of AGI for various income ranges: 7.5% for AGIs below $25k, 1.2% for AGIs $25k-50k)
Percentage of individuals using paid preparers for their 2012 taxes: 68.5%
Here:
68%
State:
51%
(% for various income ranges: 61.8% for AGIs below $25k, 66.0% for AGIs $25k-50k, 77.4% for AGIs $50k-75k, 73.7% for AGIs $75k-100k, 76.2% for AGIs $100k-200k, 100.0% for AGIs over 200k)
Averages for the 2004 tax year for zip code 75831, filed in 2005:
Average Adjusted Gross Income (AGI) in 2004: $37,560 (Individual Income Tax Returns)
Here:
$37,560
State:
$47,881
Salary/wage: $34,353 (reported on 81.5% of returns)
Here:
$34,353
State:
$41,947
(% of AGI for various income ranges: 95.0% for AGIs below $10k, 80.2% for AGIs $10k-25k, 85.3% for AGIs $25k-50k, 82.8% for AGIs $50k-75k, 74.5% for AGIs $75k-100k, 53.1% for AGIs over 100k)
Taxable interest for individuals: $2,848 (reported on 35.7% of returns)
This zip code:
$2,848
Texas:
$2,255
(% of AGI for various income ranges: 4.9% for AGIs below $10k, 2.7% for AGIs $10k-25k, 2.1% for AGIs $25k-50k, 1.6% for AGIs $50k-75k, 1.4% for AGIs $75k-100k, 4.5% for AGIs over 100k)
Taxable dividends: $1,975 (reported on 16.6% of returns)
Here:
$1,975
State:
$4,261
(% of AGI for various income ranges: 2.9% for AGIs below $10k, 1.4% for AGIs $10k-25k, 0.8% for AGIs $25k-50k, 0.7% for AGIs $50k-75k, 0.4% for AGIs $75k-100k, 0.8% for AGIs over 100k)
Net capital gain/loss: +$8,772 (reported on 17.6% of returns)
Here:
+$8,772
State:
+$16,110
(% of AGI for various income ranges: -1.2% for AGIs below $10k, 0.5% for AGIs $10k-25k, 0.5% for AGIs $25k-50k, 1.9% for AGIs $50k-75k, 3.2% for AGIs $75k-100k, 11.9% for AGIs over 100k)
Profit/loss from business: +$6,045 (reported on 21.1% of returns)
Here:
+$6,045
State:
+$11,013
(% of AGI for various income ranges: 8.2% for AGIs below $10k, 4.9% for AGIs $10k-25k, 2.9% for AGIs $25k-50k, 0.7% for AGIs $50k-75k, 2.6% for AGIs $75k-100k, 5.3% for AGIs over 100k)
IRA payment deduction: $3,939 (reported on 1.7% of returns)
75831:
$3,939
Texas:
$3,120
Total itemized deductions: $18,451 (28% of AGI, reported on 16.9% of returns)
Here:
$18,451
State:
$19,631
Here:
27.9% of AGI
State:
18.9% of AGI
(% of AGI for various income ranges: 12.0% for AGIs below $10k, 9.5% for AGIs $10k-25k, 8.1% for AGIs $25k-50k, 8.4% for AGIs $50k-75k, 9.1% for AGIs $75k-100k, 7.3% for AGIs over 100k)
Charity contributions deductions: $5,610 (8% of AGI, reported on 11.9% of returns)
Here:
$5,610
State:
$4,753
Here:
7.7% of AGI
State:
4.2% of AGI
(% of AGI for various income ranges: 1.1% for AGIs $10k-25k, 1.1% for AGIs $25k-50k, 1.5% for AGIs $50k-75k, 1.9% for AGIs $75k-100k, 3.0% for AGIs over 100k)
Total tax: $5,417 (reported on 68.0% of returns)
75831:
$5,417
State:
$9,058
(% of AGI for various income ranges: 2.8% for AGIs below $10k, 3.5% for AGIs $10k-25k, 5.6% for AGIs $25k-50k, 8.5% for AGIs $50k-75k, 10.9% for AGIs $75k-100k, 17.9% for AGIs over 100k)
Earned income credit: $1,752 (reported on 20.2% of returns)
Here:
$1,752
State:
$2,024
Percentage of individuals using paid preparers for their 2004 taxes: 68.4%
Here:
68%
State:
57%
(% for various income ranges: 57.1% for AGIs below $10k, 66.8% for AGIs $10k-25k, 73.4% for AGIs $25k-50k, 71.6% for AGIs $50k-75k, 77.6% for AGIs $75k-100k, 81.0% for AGIs over 100k)
Household received Food Stamps/SNAP in the past 12 months: 230 Household did not receive Food Stamps/SNAP in the past 12 months: 1,966
Women who had a birth in the past 12 months: 79 (77 now married, 2 unmarried) Women who did not have a birth in the past 12 months: 1,032 (598 now married, 430 unmarried)
Housing units in zip code 75831 with a mortgage: 339 (22 second mortgage, 24 both second mortgage and home equity loan) Median monthly owner costs for units with a mortgage: $1,686 Median monthly owner costs for units without a mortgage: $381
Residents with income below the poverty level in 2022:
This zip code:
17.0%
Whole state:
14.0%
Residents with income below 50% of the poverty level in 2022:
This zip code:
8.2%
Whole state:
7.4%
Median number of rooms in houses and condos:
Here:
5.5
State:
6.3
Median number of rooms in apartments:
Here:
5.1
State:
4.0
Notable locations in this zip code not listed on our city pages
Churches in zip code 75831 include: Cedar Creek Church (A), Cedar Grove Church (B), Davis Chapel (C), Mount Zion Church (D), Mount Pleasant Church (E), Little Star Church (F), Russell Church (G). Display/hide their locations on the map
Cemeteries: Brushy Cemetery (1), Lummus Cemetery (2), Liberty Cemetery (3), Harrison Chapel Cemetery (4), Jackson Cemetery (5), Keechi Cemetery (6), Taylor Cemetery (7). Display/hide their locations on the map
Lakes and reservoirs: Harcrow Lake (A), Snyder Lake (B), Taylor Lake (C), Days Lake (D), Moore Lake (E), Cundiff Lake (F), Schweinle Lake (G), Lake Elverda (H). Display/hide their locations on the map
Streams, rivers, and creeks: Bliss Creek (A), Browns Creek (B), Blain Dugout (C), Alligator Creek (D), Whites Branch (E), Serasca Creek (F), Self Creek (G), Mustang Creek (H), Hog Creek (I). Display/hide their locations on the map
In group quarters: 9 (-1 institutionalized population)
Size of family households: 693 2-persons, 365 3-persons, 178 4-persons, 109 5-persons, 88 6-persons, 23 7-or-more-persons
Size of nonfamily households: 648 1-person, 99 2-persons
839 married couples with children.
170 single-parent households (39 men, 131 women).
89.0% of residents of 75831 zip code speak English at home.
9.8% of residents speak Spanish at home (35% very well, 22% well, 36% not well, 7% not at all).
0.7% of residents speak other Indo-European language at home (100% very well).
0.3% of residents speak Asian or Pacific Island language at home (100% very well).
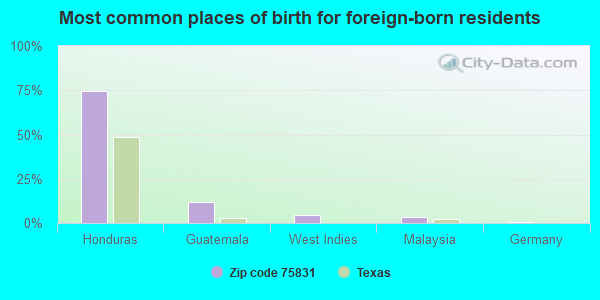
Foreign born population: 379 (7.2%) (29.0% of them are naturalized citizens)
This zip code:
7.2%
Whole state:
17.2%
75%Honduras
12%Guatemala
4%West Indies
3%Malaysia
1%Germany
1%Ireland
1%Peru
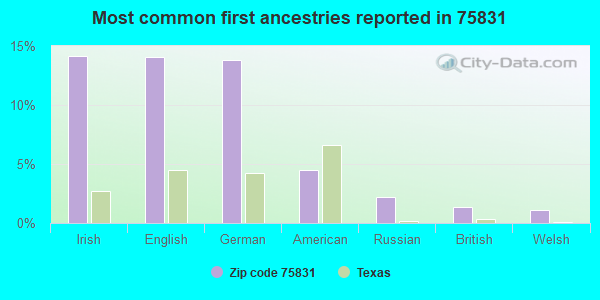
14%Irish
14%English
14%German
4%American
2%Russian
1%British
1%Welsh
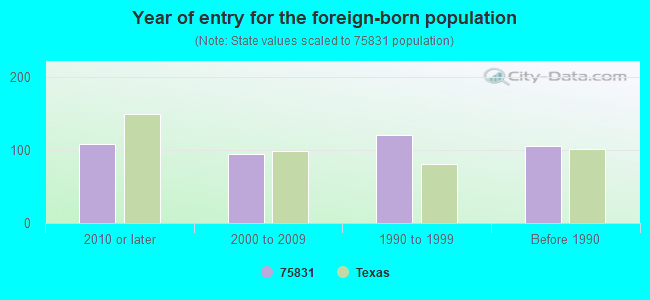
Year of entry for the foreign-born population
1082010 or later
952000 to 2009
1211990 to 1999
105Before 1990
Housing units lacking complete plumbing facilities: 4.2% Housing units lacking complete kitchen facilities: 3.7%
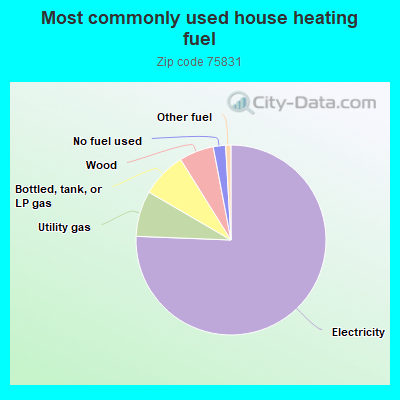
75.7%Electricity
7.8%Utility gas
7.7%Bottled, tank, or LP gas
5.9%Wood
2.1%No fuel used
0.9%Other fuel
Population in 1990: 3,404. Population change in the 1990s: +1,415 (+41.6%).
Place of birth for U.S.-born residents:
This state: 4,054
Northeast: 77
Midwest: 141
South: 468
West: 68
59% of the 75831 zip code residents lived in the same house 5 years ago. Out of people who lived in different houses, 39% lived in this county. Out of people who lived in different counties, 50% lived in Texas.
90% of the 75831 zip code residents lived in the same house 1 year ago. Out of people who lived in different houses, 15% moved from this county. Out of people who lived in different houses, 75% moved from different county within same state. Out of people who lived in different houses, 10% moved from different state. Out of people who lived in different houses, 5% moved from abroad.
Private vs. public school enrollment:
Students in private schools in grades 1 to 8 (elementary and middle school):
Here:
0.0%
Texas:
8.8%
Students in private schools in grades 9 to 12 (high school): 5
Here:
3.4%
Texas:
8.0%
Students in private undergraduate colleges:
Here:
0.0%
Texas:
16.2%
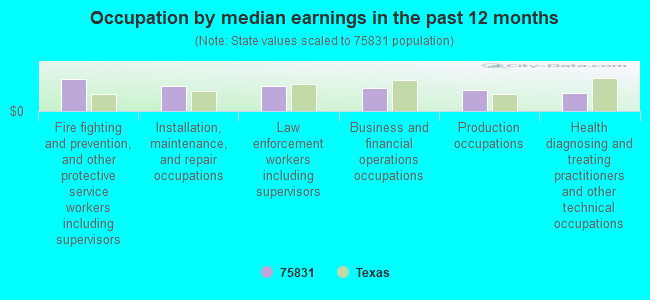
Occupation by median earnings in the past 12 months ($)
127,285Fire fighting and prevention, and other protective service workers including supervisors
97,994Installation, maintenance, and repair occupations
96,747Law enforcement workers including supervisors
91,530Business and financial operations occupations
82,877Production occupations
71,505Health diagnosing and treating practitioners and other technical occupations
Top industries in this zip code by the number of employees in 2005:
Construction: Highway, Street, and Bridge Construction (250-499 employees: 1 establishment)
Construction: Site Preparation Contractors (100-249: 1, 20-49: 1, 5-9: 1)
Other Services (except Public Administration): Religious Organizations (10-19: 2, 5-9: 2, 1-4: 3)
Mining: Support Activities for Oil and Gas Operations (20-49: 1, 10-19: 1)
Health Care and Social Assistance: Offices of Physicians (except Mental Health Specialists) (20-49: 1, 5-9: 1, 1-4: 1)
Finance and Insurance: Commercial Banking (20-49: 1, 5-9: 1)
People in group quarters in 2010:
29 people in nursing facilities/skilled-nursing facilities
People in group quarters in 2000:
48 people in nursing homes
Fatal accident statistics in 2014:
Fatal accident count: 3
Vehicles involved in fatal accidents: 5
Fatal accidents caused by drunken drivers: 0
Fatalities: 4
Persons involved in fatal accidents: 10
Pedestrians involved in fatal accidents: 0
Fatal accident statistics in 2013:
Fatal accident count: 5
Vehicles involved in fatal accidents: 6
Fatal accidents caused by drunken drivers: 2
Fatalities: 5
Persons involved in fatal accidents: 12
Pedestrians involved in fatal accidents: 0
2002 - 2018 National Fire Incident Reporting System (NFIRS) incidents
Based on the data from the years 2002 - 2018 the average number of fires per year is 29. The highest number of fires - 61 took place in 2003, and the least - 10 in 2010. The data has a decreasing trend.
When looking into fire subcategories, the most incidents belonged to: Outside Fires (48.2%), and Structure Fires (20.1%).
Fire incident types reported to NFIRS in Zip Code 75831


 Nearest zip codes: 75855, 75846, 75838, 75833, 75860, 75840.


 Based on the data from the years 2002 - 2018 the average number of fires per year is 29. The highest number of fires - 61 took place in 2003, and the least - 10 in 2010. The data has a decreasing trend.
 When looking into fire subcategories, the most incidents belonged to: Outside Fires (48.2%), and Structure Fires (20.1%).