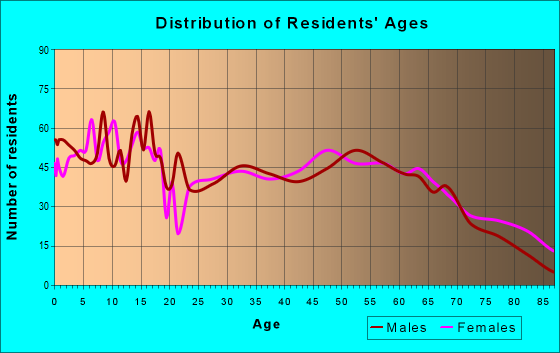
Estimated zip code population in 2022: 6,600 Zip code population in 2010: 7,076 Zip code population in 2000: 6,622
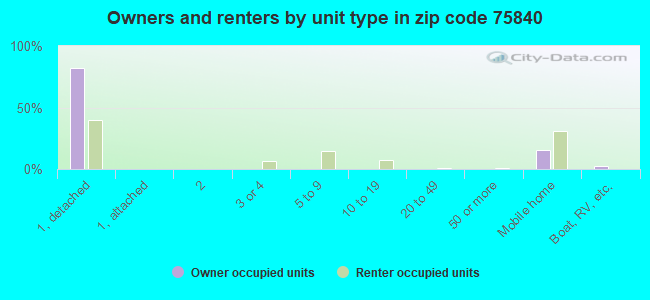
Houses and condos: 3,471 Renter-occupied apartments: 881
% of renters here:
33%
State:
38%
March 2022 cost of living index in zip code 75840: 80.3 (low, U.S. average is 100)
Land area: 273.3 sq. mi. Water area: 4.4 sq. mi.
Population density: 24 people per square mile
(very low).
OSM Map
General Map
Google Map
MSN Map
OSM Map
General Map
Google Map
MSN Map
OSM Map
General Map
Google Map
MSN Map
OSM Map
General Map
Google Map
MSN Map
Please wait while loading the map...
Real estate property taxes paid for housing units in 2022:
This zip code:
1.0% ($2,172)
Texas:
1.5% ($4,050)
Median real estate property taxes paid for housing units with mortgages in 2022: $2,395 (1.0%) Median real estate property taxes paid for housing units with no mortgage in 2022: $1,940 (1.0%)
Averages for the 2020 tax year for zip code 75840, filed in 2021:
Average Adjusted Gross Income (AGI) in 2020: $58,847 (Individual Income Tax Returns)
Here:
$58,847
State:
$77,054
Salary/wage: $49,428 (reported on 79.8% of returns)
Here:
$49,428
State:
$62,766
(% of AGI for various income ranges: 1189.0% for AGIs below $25k, 3654.0% for AGIs $25k-50k, 6233.2% for AGIs $50k-75k, 8772.1% for AGIs $75k-100k, 15918.1% for AGIs $100k-200k, 48056.7% for AGIs over 200k)
Taxable interest for individuals: $2,104 (reported on 23.0% of returns)
This zip code:
$2,104
Texas:
$2,665
(% of AGI for various income ranges: 18.3% for AGIs below $25k, 20.3% for AGIs $25k-50k, 56.5% for AGIs $50k-75k, 87.9% for AGIs $75k-100k, 148.9% for AGIs $100k-200k, 1780.0% for AGIs over 200k)
Ordinary dividends: $6,220 (reported on 15.1% of returns)
Here:
$6,220
State:
$10,044
(% of AGI for various income ranges: 17.7% for AGIs below $25k, 43.2% for AGIs $25k-50k, 70.3% for AGIs $50k-75k, 124.7% for AGIs $75k-100k, 372.2% for AGIs $100k-200k, 3940.0% for AGIs over 200k)
Net capital gain/loss in AGI: +$16,587 (reported on 14.2% of returns)
Here:
+$16,587
State:
+$39,590
(% of AGI for various income ranges: 14.1% for AGIs below $25k, 35.6% for AGIs $25k-50k, 87.3% for AGIs $50k-75k, 344.7% for AGIs $75k-100k, 487.8% for AGIs $100k-200k, 17180.0% for AGIs over 200k)
Profit/loss from business: +$10,577 (reported on 17.2% of returns)
Here:
+$10,577
State:
+$10,888
(% of AGI for various income ranges: 79.3% for AGIs below $25k, 137.0% for AGIs $25k-50k, 70.0% for AGIs $50k-75k, 481.6% for AGIs $75k-100k, 693.3% for AGIs $100k-200k, 4766.7% for AGIs over 200k)
Taxable individual retirement arrangement distribution: $27,914 (reported on 8.8% of returns)
75840:
$27,914
Texas:
$24,740
(% of AGI for various income ranges: 45.3% for AGIs below $25k, 96.7% for AGIs $25k-50k, 342.4% for AGIs $50k-75k, 470.5% for AGIs $75k-100k, 1826.3% for AGIs $100k-200k)
Total itemized deductions: $39,693 (reported on 4.5% of returns)
Here:
$39,693
State:
$40,428
(% of AGI for various income ranges: 95.3% for AGIs below $25k, 235.9% for AGIs $50k-75k, 322.6% for AGIs $75k-100k, 471.9% for AGIs $100k-200k, 7883.3% for AGIs over 200k)
Charity contributions: $18,067 (reported on 3.6% of returns)
Here:
$18,067
State:
$18,201
(% of AGI for various income ranges: 18.3% for AGIs below $25k, 90.3% for AGIs $50k-75k, 138.5% for AGIs $100k-200k, 4336.7% for AGIs over 200k)
Taxes paid: $5,380 (reported on 4.5% of returns)
75840:
$5,380
State:
$7,821
(% of AGI for various income ranges: 10.8% for AGIs below $25k, 34.9% for AGIs $50k-75k, 52.6% for AGIs $75k-100k, 85.9% for AGIs $100k-200k, 840.0% for AGIs over 200k)
Earned income credit: $2,480 (reported on 19.3% of returns)
Here:
$2,480
State:
$2,584
(% of AGI for various income ranges: 127.1% for AGIs below $25k, 76.3% for AGIs $25k-50k)
Percentage of individuals using paid preparers for their 2020 taxes: 93.7%
Here:
94%
State:
92%
(% for various income ranges: 94.1% for AGIs below $25k, 93.8% for AGIs $25k-50k, 94.1% for AGIs $50k-75k, 92.6% for AGIs $75k-100k, 93.3% for AGIs $100k-200k, 90.0% for AGIs over 200k)
Averages for the 2012 tax year for zip code 75840, filed in 2013:
Average Adjusted Gross Income (AGI) in 2012: $54,043 (Individual Income Tax Returns)
Here:
$54,043
State:
$65,384
Salary/wage: $46,940 (reported on 83.6% of returns)
Here:
$46,940
State:
$52,524
(% of AGI for various income ranges: 78.3% for AGIs below $25k, 81.7% for AGIs $25k-50k, 75.2% for AGIs $50k-75k, 74.7% for AGIs $75k-100k, 75.0% for AGIs $100k-200k, 51.8% for AGIs over 200k)
Taxable interest for individuals: $1,799 (reported on 24.2% of returns)
This zip code:
$1,799
Texas:
$2,372
(% of AGI for various income ranges: 0.8% for AGIs below $25k, 0.7% for AGIs $25k-50k, 0.5% for AGIs $50k-75k, 1.1% for AGIs $75k-100k, 0.6% for AGIs $100k-200k, 1.2% for AGIs over 200k)
Ordinary dividends: $8,833 (reported on 13.6% of returns)
Here:
$8,833
State:
$9,721
(% of AGI for various income ranges: 0.5% for AGIs below $25k, 0.7% for AGIs $25k-50k, 0.6% for AGIs $50k-75k, 1.2% for AGIs $75k-100k, 2.4% for AGIs $100k-200k, 6.9% for AGIs over 200k)
Net capital gain/loss in AGI: +$13,155 (reported on 12.1% of returns)
Here:
+$13,155
State:
+$35,319
(% of AGI for various income ranges: 0.5% for AGIs $25k-50k, 0.7% for AGIs $50k-75k, 0.9% for AGIs $75k-100k, 2.0% for AGIs $100k-200k, 12.6% for AGIs over 200k)
Profit/loss from business: +$16,459 (reported on 17.9% of returns)
Here:
+$16,459
State:
+$13,732
(% of AGI for various income ranges: 7.6% for AGIs below $25k, 3.7% for AGIs $25k-50k, 3.9% for AGIs $50k-75k, 4.4% for AGIs $75k-100k, 4.3% for AGIs $100k-200k, 10.5% for AGIs over 200k)
Taxable individual retirement arrangement distribution: $15,910 (reported on 8.8% of returns)
75840:
$15,910
Texas:
$19,511
(% of AGI for various income ranges: 2.1% for AGIs below $25k, 1.8% for AGIs $25k-50k, 2.4% for AGIs $50k-75k, 2.3% for AGIs $75k-100k, 5.0% for AGIs $100k-200k)
Total itemized deductions: $23,376 (22% of AGI, reported on 20.0% of returns)
Here:
$23,376
State:
$24,724
Here:
21.6% of AGI
State:
15.9% of AGI
(% of AGI for various income ranges: 6.2% for AGIs below $25k, 7.9% for AGIs $25k-50k, 8.1% for AGIs $50k-75k, 9.7% for AGIs $75k-100k, 8.6% for AGIs $100k-200k, 10.3% for AGIs over 200k)
Charity contributions: $8,521 (reported on 14.5% of returns)
Here:
$8,521
State:
$6,808
(% of AGI for various income ranges: 0.8% for AGIs below $25k, 1.0% for AGIs $25k-50k, 1.9% for AGIs $50k-75k, 1.9% for AGIs $75k-100k, 2.2% for AGIs $100k-200k, 5.3% for AGIs over 200k)
Taxes paid: $4,041 (reported on 19.4% of returns)
75840:
$4,041
State:
$6,921
(% of AGI for various income ranges: 0.7% for AGIs below $25k, 1.1% for AGIs $25k-50k, 1.2% for AGIs $50k-75k, 1.7% for AGIs $75k-100k, 2.0% for AGIs $100k-200k, 1.4% for AGIs over 200k)
Earned income credit: $2,320 (reported on 19.4% of returns)
Here:
$2,320
State:
$2,570
(% of AGI for various income ranges: 7.1% for AGIs below $25k, 1.3% for AGIs $25k-50k)
Percentage of individuals using paid preparers for their 2012 taxes: 67.3%
Here:
67%
State:
51%
(% for various income ranges: 62.7% for AGIs below $25k, 64.6% for AGIs $25k-50k, 71.1% for AGIs $50k-75k, 75.0% for AGIs $75k-100k, 73.7% for AGIs $100k-200k, 85.7% for AGIs over 200k)
Averages for the 2004 tax year for zip code 75840, filed in 2005:
Average Adjusted Gross Income (AGI) in 2004: $46,591 (Individual Income Tax Returns)
Here:
$46,591
State:
$47,881
Salary/wage: $37,556 (reported on 81.5% of returns)
Here:
$37,556
State:
$41,947
(% of AGI for various income ranges: 153.4% for AGIs below $10k, 78.2% for AGIs $10k-25k, 85.4% for AGIs $25k-50k, 79.0% for AGIs $50k-75k, 81.0% for AGIs $75k-100k, 39.6% for AGIs over 100k)
Taxable interest for individuals: $1,977 (reported on 33.8% of returns)
This zip code:
$1,977
Texas:
$2,255
(% of AGI for various income ranges: 8.4% for AGIs below $10k, 2.5% for AGIs $10k-25k, 0.8% for AGIs $25k-50k, 1.2% for AGIs $50k-75k, 1.5% for AGIs $75k-100k, 1.3% for AGIs over 100k)
Taxable dividends: $2,622 (reported on 18.6% of returns)
Here:
$2,622
State:
$4,261
(% of AGI for various income ranges: 2.9% for AGIs below $10k, 1.1% for AGIs $10k-25k, 0.5% for AGIs $25k-50k, 1.0% for AGIs $50k-75k, 0.5% for AGIs $75k-100k, 1.4% for AGIs over 100k)
Net capital gain/loss: +$7,850 (reported on 18.1% of returns)
Here:
+$7,850
State:
+$16,110
(% of AGI for various income ranges: -0.3% for AGIs below $10k, 1.4% for AGIs $10k-25k, -0.2% for AGIs $25k-50k, 0.2% for AGIs $50k-75k, 2.1% for AGIs $75k-100k, 6.6% for AGIs over 100k)
Profit/loss from business: +$7,509 (reported on 19.7% of returns)
Here:
+$7,509
State:
+$11,013
(% of AGI for various income ranges: 16.3% for AGIs below $10k, 6.0% for AGIs $10k-25k, 2.4% for AGIs $25k-50k, 2.1% for AGIs $50k-75k, 0.9% for AGIs $75k-100k, 3.8% for AGIs over 100k)
IRA payment deduction: $3,739 (reported on 1.6% of returns)
75840:
$3,739
Texas:
$3,120
(% of AGI for various income ranges: 0.3% for AGIs $10k-25k, 0.2% for AGIs $50k-75k, 0.2% for AGIs $75k-100k, 0.1% for AGIs over 100k)
Self-employed pension: $12,077 (reported on 0.5% of returns)
Here:
$12,077
Texas:
$16,401
Total itemized deductions: $20,560 (23% of AGI, reported on 17.9% of returns)
Here:
$20,560
State:
$19,631
Here:
23.5% of AGI
State:
18.9% of AGI
(% of AGI for various income ranges: 16.7% for AGIs below $10k, 4.8% for AGIs $10k-25k, 7.5% for AGIs $25k-50k, 8.3% for AGIs $50k-75k, 8.5% for AGIs $75k-100k, 8.1% for AGIs over 100k)
Charity contributions deductions: $7,926 (8% of AGI, reported on 14.0% of returns)
Here:
$7,926
State:
$4,753
Here:
8.1% of AGI
State:
4.2% of AGI
(% of AGI for various income ranges: 2.2% for AGIs below $10k, 0.6% for AGIs $10k-25k, 1.3% for AGIs $25k-50k, 1.9% for AGIs $50k-75k, 1.9% for AGIs $75k-100k, 3.7% for AGIs over 100k)
Total tax: $9,053 (reported on 69.0% of returns)
75840:
$9,053
State:
$9,058
(% of AGI for various income ranges: 4.9% for AGIs below $10k, 3.3% for AGIs $10k-25k, 6.0% for AGIs $25k-50k, 9.1% for AGIs $50k-75k, 11.2% for AGIs $75k-100k, 22.0% for AGIs over 100k)
Earned income credit: $1,932 (reported on 21.1% of returns)
Here:
$1,932
State:
$2,024
Percentage of individuals using paid preparers for their 2004 taxes: 69.5%
Here:
69%
State:
57%
(% for various income ranges: 61.9% for AGIs below $10k, 67.8% for AGIs $10k-25k, 70.9% for AGIs $25k-50k, 72.8% for AGIs $50k-75k, 71.7% for AGIs $75k-100k, 84.3% for AGIs over 100k)
Household received Food Stamps/SNAP in the past 12 months: 439 Household did not receive Food Stamps/SNAP in the past 12 months: 2,219
Women who had a birth in the past 12 months: 76 (45 now married, 30 unmarried) Women who did not have a birth in the past 12 months: 1,459 (774 now married, 680 unmarried)
Housing units in zip code 75840 with a mortgage: 762 (109 second mortgage, 9 both second mortgage and home equity loan) Median monthly owner costs for units with a mortgage: $1,671 Median monthly owner costs for units without a mortgage: $563
Residents with income below the poverty level in 2022:
This zip code:
16.2%
Whole state:
14.0%
Residents with income below 50% of the poverty level in 2022:
This zip code:
9.9%
Whole state:
7.4%
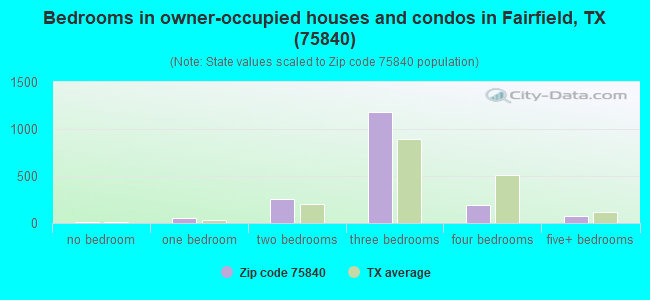
Median number of rooms in houses and condos:
Here:
5.6
State:
6.3
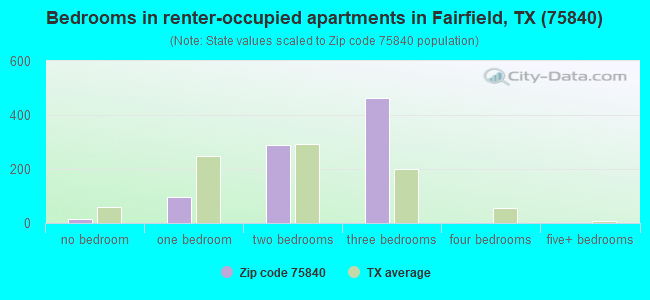
Median number of rooms in apartments:
Here:
4.6
State:
4.0
Notable locations in this zip code not listed on our city pages
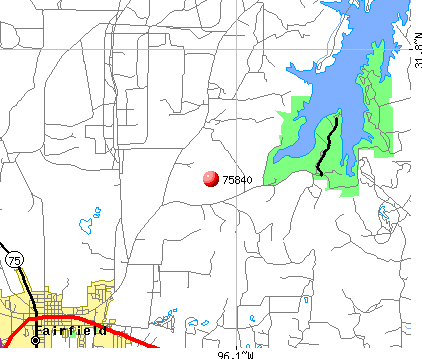
Notable locations in zip code 75840: Amerada Camp (A), Banks Stop (B), Hodge Podge Lodge (C), Freestone County Historical Museum (D), Fairfield City Fire Department (E), Fairfield Volunteer Fire Department (F), Fairfield Emergency Medical Service Ambulance (G). Display/hide their locations on the map
Churches in zip code 75840 include: Pleasant Grove Church (A), Rhode Island Church (B), Round Prairie Church (C), Trinity Lutheran Church (D), Jehovahs Witnesses Church (E), Round Prairie Baptist Church (F), First Baptist Church (G), Faith Hope Love Baptist Church (H), Calvary Baptist Church (I). Display/hide their locations on the map
Cemeteries: Day Cemetery (1), Rehobath Cemetery (2), Post Oak Cemetery (3), Chancellor Cemetery (4), Mount Zion Cemetery (5), Edwards Cemetery (6), Old Anglan Cemetery (7). Display/hide their locations on the map
Lakes and reservoirs: Snag Lake (A), Lost Lake (B), Long Lake (C), Sneed Lake (D), Hillside Slough (E), Pea Patch Lake (F), Cook Lake (G), Timber Lake (H). Display/hide their locations on the map
Streams, rivers, and creeks: Brinkley Creek (A), Batsmith Creek (B), Cold Springs Branch (C), Big Brown Creek (D), Ball Branch (E), Rock Springs Branch (F), Waldrom Branch (G), Prairie Creek (H), Powell Branch (I). Display/hide their locations on the map
Parks in zip code 75840 include: Richland Creek Wildlife Management Area (1), Mount Zion Park (2), Fairfield Arena (3), Fairfield Lake State Park (4). Display/hide their locations on the map
In group quarters: 210 (-1 institutionalized population)
Size of family households: 844 2-persons, 290 3-persons, 217 4-persons, 149 5-persons, 90 6-persons
Size of nonfamily households: 1,036 1-person, 29 2-persons, 4 3-persons
1,193 married couples with children.
423 single-parent households (34 men, 389 women).
85.6% of residents of 75840 zip code speak English at home.
14.3% of residents speak Spanish at home (76% very well, 14% well, 8% not well, 2% not at all).
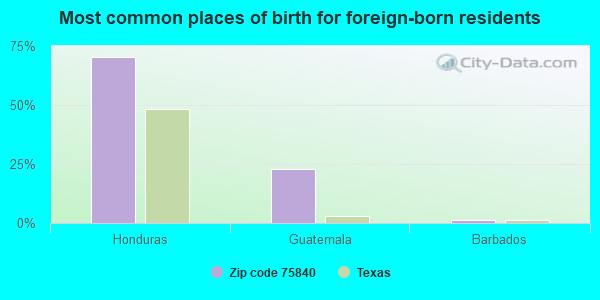
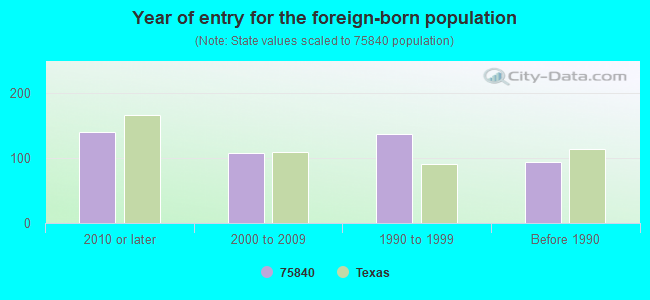
Foreign born population: 433 (6.6%) (30.7% of them are naturalized citizens)
This zip code:
6.6%
Whole state:
17.2%
70%Honduras
23%Guatemala
1%Barbados
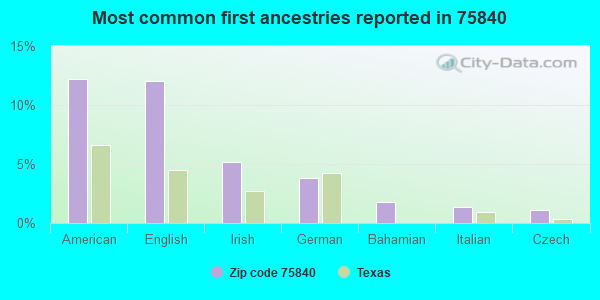
12%American
12%English
5%Irish
4%German
2%Bahamian
1%Italian
1%Czech
Year of entry for the foreign-born population
1402010 or later
1082000 to 2009
1371990 to 1999
94Before 1990
Facilities with environmental interests located in this zip code:
AMERICAN TELEPHONE AND TELEGRAPH COMPANY (1 MI N JCT I-45 & 179 in FAIRFIELD, TX)
(Resource Conservation and Recovery Act (tracking hazardous waste)) Alternative names: AMERICAN TEL & TEL CO LONG LINES
ANADARKO PETROLEUM CORP. ( in FAIRFIELD, TX)
SUPERFUND (Superfund database)
Housing units lacking complete plumbing facilities: 4.0% Housing units lacking complete kitchen facilities: 5.0%
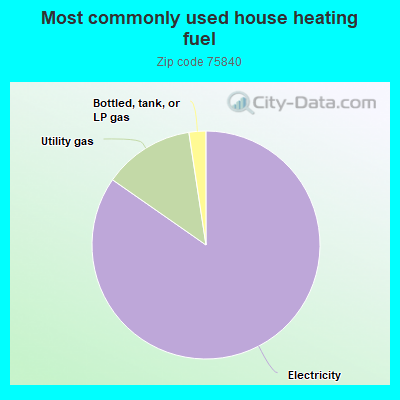
84.7%Electricity
12.9%Utility gas
2.4%Bottled, tank, or LP gas
Population in 1990: 6,331. Population change in the 1990s: +291 (+4.6%).
Place of birth for U.S.-born residents:
This state: 4,822
Northeast: 62
Midwest: 233
South: 550
West: 419
61% of the 75840 zip code residents lived in the same house 5 years ago. Out of people who lived in different houses, 55% lived in this county. Out of people who lived in different counties, 50% lived in Texas.
90% of the 75840 zip code residents lived in the same house 1 year ago. Out of people who lived in different houses, 37% moved from this county. Out of people who lived in different houses, 61% moved from different county within same state. Out of people who lived in different houses, 3% moved from abroad.
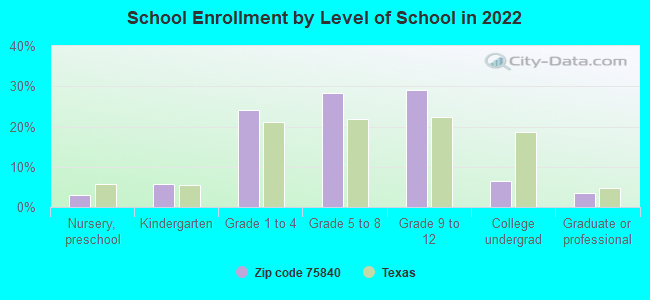
Private vs. public school enrollment:
Students in private schools in grades 1 to 8 (elementary and middle school): 4
Here:
0.5%
Texas:
8.8%
Students in private schools in grades 9 to 12 (high school): 19
Here:
4.4%
Texas:
8.0%
Students in private undergraduate colleges:
Here:
0.0%
Texas:
16.2%
Occupation by median earnings in the past 12 months ($)
94,331Production occupations
90,601Transportation occupations
78,662Health diagnosing and treating practitioners and other technical occupations
77,340Management occupations
62,781Business and financial operations occupations
60,257Legal occupations
Top industries in this zip code by the number of employees in 2005:
Health Care and Social Assistance: Nursing Care Facilities (50-99: 1)
Health Care and Social Assistance: General Medical and Surgical Hospitals (50-99: 1)
People in group quarters in 2010:
130 people in nursing facilities/skilled-nursing facilities
27 people in local jails and other municipal confinement facilities
People in group quarters in 2000:
78 people in nursing homes
36 people in local jails and other confinement facilities (including police lockups)
Fatal accident statistics in 2014:
Fatal accident count: 2
Vehicles involved in fatal accidents: 3
Fatal accidents caused by drunken drivers: 0
Fatalities: 2
Persons involved in fatal accidents: 4
Pedestrians involved in fatal accidents: 0
Fatal accident statistics in 2012:
Fatal accident count: 1
Vehicles involved in fatal accidents: 1
Fatal accidents caused by drunken drivers: 0
Fatalities: 1
Persons involved in fatal accidents: 2
Pedestrians involved in fatal accidents: 1
2002 - 2018 National Fire Incident Reporting System (NFIRS) incidents
According to the data from the years 2002 - 2018 the average number of fires per year is 40. The highest number of reported fires - 126 took place in 2018, and the least - 11 in 2009. The data has a rising trend.
When looking into fire subcategories, the most incidents belonged to: Outside Fires (45.8%), and Structure Fires (37.1%).
Fire incident types reported to NFIRS in Zip Code 75840
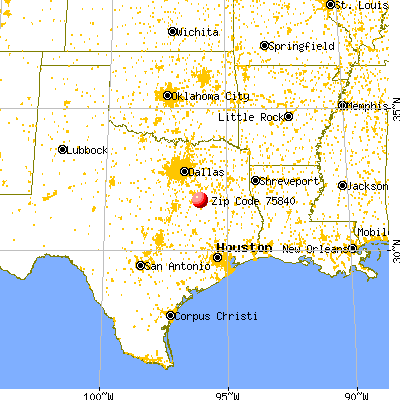


 Nearest zip codes: 75859, 75832, 75861, 75860, 75848, 76693.
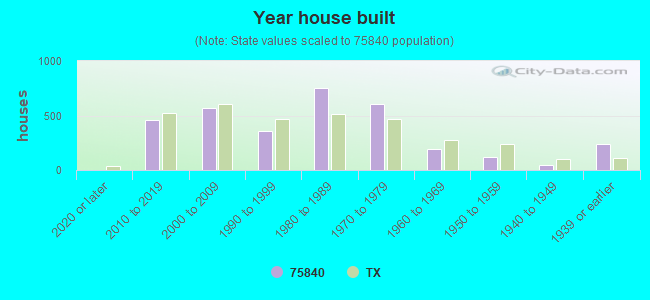


 According to the data from the years 2002 - 2018 the average number of fires per year is 40. The highest number of reported fires - 126 took place in 2018, and the least - 11 in 2009. The data has a rising trend.
 When looking into fire subcategories, the most incidents belonged to: Outside Fires (45.8%), and Structure Fires (37.1%).