Averages for the 2020 tax year for zip code 75859, filed in 2021:
Average Adjusted Gross Income (AGI) in 2020: $79,695 (Individual Income Tax Returns)
Here:
$79,695
State:
$77,054
Salary/wage: $61,839 (reported on 71.0% of returns)
Here:
$61,839
State:
$62,766
(% of AGI for various income ranges: 887.5% for AGIs below $25k, 3228.1% for AGIs $25k-50k, 6557.8% for AGIs $50k-75k, 8923.3% for AGIs $75k-100k, 13980.0% for AGIs $100k-200k, 42576.7% for AGIs over 200k)
Taxable interest for individuals: $2,038 (reported on 34.0% of returns)
This zip code:
$2,038
Texas:
$2,665
(% of AGI for various income ranges: 10.8% for AGIs below $25k, 21.2% for AGIs $25k-50k, 80.0% for AGIs $50k-75k, 68.3% for AGIs $75k-100k, 174.4% for AGIs $100k-200k, 1210.0% for AGIs over 200k)
Ordinary dividends: $8,452 (reported on 21.0% of returns)
Here:
$8,452
State:
$10,044
(% of AGI for various income ranges: 27.1% for AGIs below $25k, 35.6% for AGIs $25k-50k, 117.8% for AGIs $50k-75k, 140.0% for AGIs $75k-100k, 486.7% for AGIs $100k-200k, 3416.7% for AGIs over 200k)
Net capital gain/loss in AGI: +$21,309 (reported on 22.0% of returns)
Here:
+$21,309
State:
+$39,590
(% of AGI for various income ranges: 15.8% for AGIs below $25k, 42.5% for AGIs $25k-50k, 113.3% for AGIs $50k-75k, 321.7% for AGIs $75k-100k, 963.3% for AGIs $100k-200k, 11400.0% for AGIs over 200k)
Profit/loss from business: +$14,595 (reported on 22.0% of returns)
Here:
+$14,595
State:
+$10,888
(% of AGI for various income ranges: 181.2% for AGIs below $25k, 280.6% for AGIs $25k-50k, 143.3% for AGIs $50k-75k, 588.3% for AGIs $75k-100k, 791.1% for AGIs $100k-200k, 3776.7% for AGIs over 200k)
Taxable individual retirement arrangement distribution: $34,535 (reported on 17.0% of returns)
75859:
$34,535
Texas:
$24,740
(% of AGI for various income ranges: 221.7% for AGIs below $25k, 565.6% for AGIs $50k-75k, 808.3% for AGIs $75k-100k, 2678.9% for AGIs $100k-200k, 6446.7% for AGIs over 200k)
Total itemized deductions: $40,688 (reported on 8.0% of returns)
Here:
$40,688
State:
$40,428
(% of AGI for various income ranges: 777.8% for AGIs $50k-75k, 1262.2% for AGIs $100k-200k, 4730.0% for AGIs over 200k)
Charity contributions: $12,871 (reported on 7.0% of returns)
Here:
$12,871
State:
$18,201
(% of AGI for various income ranges: 414.4% for AGIs $100k-200k, 1760.0% for AGIs over 200k)
Taxes paid: $7,450 (reported on 8.0% of returns)
75859:
$7,450
State:
$7,821
(% of AGI for various income ranges: 88.1% for AGIs $25k-50k, 237.8% for AGIs $100k-200k, 803.3% for AGIs over 200k)
Earned income credit: $2,413 (reported on 15.0% of returns)
Here:
$2,413
State:
$2,584
(% of AGI for various income ranges: 97.5% for AGIs below $25k, 80.0% for AGIs $25k-50k)
Percentage of individuals using paid preparers for their 2020 taxes: 90.0%
Here:
90%
State:
92%
(% for various income ranges: 87.1% for AGIs below $25k, 90.0% for AGIs $25k-50k, 100.0% for AGIs $50k-75k, 90.9% for AGIs $75k-100k, 88.2% for AGIs $100k-200k, 87.5% for AGIs over 200k)
Averages for the 2012 tax year for zip code 75859, filed in 2013:
Average Adjusted Gross Income (AGI) in 2012: $76,076 (Individual Income Tax Returns)
Here:
$76,076
State:
$65,384
Salary/wage: $76,044 (reported on 69.5% of returns)
Here:
$76,044
State:
$52,524
(% of AGI for various income ranges: 59.8% for AGIs below $25k, 66.3% for AGIs $25k-50k, 77.6% for AGIs $50k-75k, 60.7% for AGIs $75k-100k, 65.1% for AGIs $100k-200k, 75.2% for AGIs over 200k)
Taxable interest for individuals: $1,190 (reported on 37.8% of returns)
This zip code:
$1,190
Texas:
$2,372
(% of AGI for various income ranges: 1.2% for AGIs below $25k, 0.8% for AGIs $25k-50k, 1.0% for AGIs $50k-75k, 0.5% for AGIs $75k-100k, 0.6% for AGIs $100k-200k, 0.4% for AGIs over 200k)
Ordinary dividends: $5,159 (reported on 20.7% of returns)
Here:
$5,159
State:
$9,721
(% of AGI for various income ranges: 2.6% for AGIs below $25k, 1.4% for AGIs $25k-50k, 1.3% for AGIs $75k-100k, 1.0% for AGIs $100k-200k, 1.9% for AGIs over 200k)
Net capital gain/loss in AGI: +$9,579 (reported on 17.1% of returns)
Here:
+$9,579
State:
+$35,319
(% of AGI for various income ranges: 0.3% for AGIs below $25k, 1.0% for AGIs $25k-50k, 2.4% for AGIs $100k-200k, 3.9% for AGIs over 200k)
Profit/loss from business: +$13,270 (reported on 24.4% of returns)
Here:
+$13,270
State:
+$13,732
(% of AGI for various income ranges: 12.6% for AGIs below $25k, 3.4% for AGIs $25k-50k, 6.9% for AGIs $50k-75k, 9.7% for AGIs $100k-200k)
Taxable individual retirement arrangement distribution: $21,067 (reported on 18.3% of returns)
75859:
$21,067
Texas:
$19,511
(% of AGI for various income ranges: 4.5% for AGIs below $25k, 10.9% for AGIs $25k-50k, 8.4% for AGIs $75k-100k, 11.1% for AGIs $100k-200k)
Total itemized deductions: $24,512 (17% of AGI, reported on 29.3% of returns)
Here:
$24,512
State:
$24,724
Here:
16.6% of AGI
State:
15.9% of AGI
(% of AGI for various income ranges: 13.3% for AGIs below $25k, 8.7% for AGIs $25k-50k, 14.1% for AGIs $50k-75k, 11.4% for AGIs $75k-100k, 12.3% for AGIs $100k-200k, 5.1% for AGIs over 200k)
Charity contributions: $5,306 (reported on 22.0% of returns)
Here:
$5,306
State:
$6,808
(% of AGI for various income ranges: 2.6% for AGIs below $25k, 1.4% for AGIs $50k-75k, 1.0% for AGIs $75k-100k, 2.2% for AGIs $100k-200k, 1.5% for AGIs over 200k)
Taxes paid: $6,558 (reported on 29.3% of returns)
75859:
$6,558
State:
$6,921
(% of AGI for various income ranges: 2.3% for AGIs below $25k, 1.3% for AGIs $25k-50k, 2.6% for AGIs $50k-75k, 2.7% for AGIs $75k-100k, 3.4% for AGIs $100k-200k, 2.2% for AGIs over 200k)
Earned income credit: $1,914 (reported on 17.1% of returns)
Here:
$1,914
State:
$2,570
(% of AGI for various income ranges: 5.2% for AGIs below $25k, 1.1% for AGIs $25k-50k)
Percentage of individuals using paid preparers for their 2012 taxes: 61.0%
Here:
61%
State:
51%
(% for various income ranges: 58.1% for AGIs below $25k, 58.8% for AGIs $25k-50k, 63.6% for AGIs $50k-75k, 62.5% for AGIs $75k-100k, 72.7% for AGIs $100k-200k, 50.0% for AGIs over 200k)
Averages for the 2004 tax year for zip code 75859, filed in 2005:
Average Adjusted Gross Income (AGI) in 2004: $42,130 (Individual Income Tax Returns)
Here:
$42,130
State:
$47,881
Salary/wage: $40,419 (reported on 72.9% of returns)
Here:
$40,419
State:
$41,947
(% of AGI for various income ranges: 73.2% for AGIs $10k-25k, 75.9% for AGIs $25k-50k, 66.2% for AGIs $50k-75k, 60.4% for AGIs $75k-100k, 67.3% for AGIs over 100k)
Taxable interest for individuals: $2,161 (reported on 42.4% of returns)
This zip code:
$2,161
Texas:
$2,255
(% of AGI for various income ranges: 4.7% for AGIs $10k-25k, 1.9% for AGIs $25k-50k, 1.4% for AGIs $50k-75k, 1.7% for AGIs $75k-100k, 1.6% for AGIs over 100k)
Taxable dividends: $2,362 (reported on 21.4% of returns)
Here:
$2,362
State:
$4,261
(% of AGI for various income ranges: 1.3% for AGIs $10k-25k, 1.3% for AGIs $25k-50k, 0.4% for AGIs $50k-75k, 0.3% for AGIs $75k-100k, 1.6% for AGIs over 100k)
Net capital gain/loss: +$2,196 (reported on 22.1% of returns)
Here:
+$2,196
State:
+$16,110
(% of AGI for various income ranges: -0.3% for AGIs $10k-25k, -0.4% for AGIs $25k-50k, 2.0% for AGIs $50k-75k, 0.9% for AGIs $75k-100k, 1.8% for AGIs over 100k)
Profit/loss from business: +$5,724 (reported on 21.4% of returns)
Here:
+$5,724
State:
+$11,013
(% of AGI for various income ranges: 7.2% for AGIs $10k-25k, 3.4% for AGIs $25k-50k, -0.9% for AGIs $50k-75k, 6.8% for AGIs $75k-100k, 0.4% for AGIs over 100k)
Total itemized deductions: $20,585 (25% of AGI, reported on 27.0% of returns)
Here:
$20,585
State:
$19,631
Here:
24.9% of AGI
State:
18.9% of AGI
(% of AGI for various income ranges: 12.3% for AGIs $10k-25k, 12.2% for AGIs $25k-50k, 12.8% for AGIs $50k-75k, 12.3% for AGIs $75k-100k, 12.8% for AGIs over 100k)
Charity contributions deductions: $3,574 (4% of AGI, reported on 21.3% of returns)
Here:
$3,574
State:
$4,753
Here:
4.0% of AGI
State:
4.2% of AGI
(% of AGI for various income ranges: 1.2% for AGIs $10k-25k, 1.4% for AGIs $25k-50k, 2.2% for AGIs $50k-75k, 2.0% for AGIs $75k-100k, 1.7% for AGIs over 100k)
Total tax: $6,787 (reported on 71.2% of returns)
75859:
$6,787
State:
$9,058
(% of AGI for various income ranges: 3.4% for AGIs $10k-25k, 6.6% for AGIs $25k-50k, 8.9% for AGIs $50k-75k, 12.1% for AGIs $75k-100k, 17.3% for AGIs over 100k)
Earned income credit: $1,711 (reported on 15.9% of returns)
Here:
$1,711
State:
$2,024
Percentage of individuals using paid preparers for their 2004 taxes: 64.2%
Here:
64%
State:
57%
(% for various income ranges: 61.9% for AGIs below $10k, 63.2% for AGIs $10k-25k, 63.0% for AGIs $25k-50k, 72.1% for AGIs $50k-75k, 62.7% for AGIs $75k-100k, 64.8% for AGIs over 100k)
Household received Food Stamps/SNAP in the past 12 months: 102 Household did not receive Food Stamps/SNAP in the past 12 months: 1,057
Women who had a birth in the past 12 months: 6 (6 now married, 0 unmarried) Women who did not have a birth in the past 12 months: 326 (110 now married, 217 unmarried)
Housing units in zip code 75859 with a mortgage: 403 Median monthly owner costs for units with a mortgage: $1,386 Median monthly owner costs for units without a mortgage: $633
Residents with income below the poverty level in 2022:
This zip code:
7.5%
Whole state:
14.0%
Residents with income below 50% of the poverty level in 2022:
This zip code:
3.9%
Whole state:
7.4%
Median number of rooms in houses and condos:
Here:
5.3
State:
6.3
Median number of rooms in apartments:
Here:
4.3
State:
4.0
Notable locations in this zip code not listed on our city pages
Churches in zip code 75859 include: Pleasant Hill Church (A), Shiloh Church (B), Tehuacana Grove Church (C), Birdston Valley Church (D), Caney Church (E), Greenbriar Church (F), Harp Church (G), Hillery Chapel (H), Midway Church (I). Display/hide their locations on the map
Cemeteries: Birdston Cemetery (1), Cedar Grove Cemetery (2), Greenbriar Cemetery (3), Oak Grove Cemetery (4), Sweatman Cemetery (5), Session Cemetery (6), Lee Cemetery (7). Display/hide their locations on the map
Lakes and reservoirs: Walker Lake (A), Richland-Chambers Reservoir (B), Texas Industries Lake (C), Streetman Lake (D), Loper Lake (E), Emerson Lake Number 1 (F), Emerson Lake Number 2 (G). Display/hide their locations on the map
Streams, rivers, and creeks: Spring Branch (A), Sloan Creek (B), Sandy Creek (C), White Rock Creek (D), Grape Creek (E), Greenbriar Creek (F), Caney Creek (G), Crab Creek (H), Cedar Creek (I). Display/hide their locations on the map
Size of family households: 644 2-persons, 49 3-persons, 38 4-persons, 27 5-persons, 59 7-or-more-persons
Size of nonfamily households: 326 1-person, 25 2-persons
181 married couples with children.
13 single-parent households (9 men, 4 women).
90.0% of residents of 75859 zip code speak English at home.
9.2% of residents speak Spanish at home (73% very well, 7% not well, 20% not at all).
1.2% of residents speak other Indo-European language at home (100% very well).
Foreign born population: 121 (4.5%) (79.7% of them are naturalized citizens)
This zip code:
4.5%
Whole state:
17.2%
71%Honduras
22%Poland
1%United Kingdom, excluding England and Scotland
20%English
12%German
8%American
6%Irish
5%European
3%Italian
2%Norwegian
Year of entry for the foreign-born population
02010 or later
52000 to 2009
281990 to 1999
73Before 1990
Facilities with environmental interests located in this zip code:
AKER PLANT (8 M E ON FM 416 RIGHT 1ST PAVE in STREETMAN, TX)
AIR MAJOR (AIRS/AFS) CRITERIA AND HAZARDOUS AIR POLLUTANT INVENTORY (Inventory of air pollution sources) Business SIC classification: CRUDE PETROLEUM AND NATURAL GAS; NATURAL GAS LIQUIDS Business NAICS classification: CRUDE PETROLEUM AND NATURAL GAS EXTRACTION. Alternative names: DELHI GAS PIPELINE CORP, ENBRIDGE, ENBRIDGE PIPELINES, LLC.-AKER PLANT, KOCH GATEWAY PIPELINE COMPANY
AKER SULFUR RECOVERY PLANT (P.O. BOX 128 in STREETMAN, TX)
TRI REPORTER (Tracking of toxic chemicals releasing facilities) Business SIC classification: INDUSTRIAL INORGANIC CHEMICALS
Housing units lacking complete plumbing facilities: 0.3% Housing units lacking complete kitchen facilities: 4.2%
77.1%Electricity
14.8%Bottled, tank, or LP gas
8.1%Utility gas
Population in 1990: 488. Population change in the 1990s: +741 (+151.8%).
Place of birth for U.S.-born residents:
This state: 1,906
Northeast: 27
Midwest: 100
South: 347
West: 168
54% of the 75859 zip code residents lived in the same house 5 years ago. Out of people who lived in different houses, 18% lived in this county. Out of people who lived in different counties, 50% lived in Texas.
97% of the 75859 zip code residents lived in the same house 1 year ago. Out of people who lived in different houses, 101% moved from different county within same state. Out of people who lived in different houses, 12% moved from different state.
Private vs. public school enrollment:
Students in private schools in grades 1 to 8 (elementary and middle school):
Here:
0.0%
Texas:
8.8%
Students in private schools in grades 9 to 12 (high school): 6
Here:
5.9%
Texas:
8.0%
Students in private undergraduate colleges:
Here:
0.0%
Texas:
16.2%
Occupation by median earnings in the past 12 months ($)
156,914Management occupations
105,244Health diagnosing and treating practitioners and other technical occupations
80,437Sales and related occupations
40,132Health technologists and technicians
38,363Installation, maintenance, and repair occupations
33,573Transportation occupations
Top industries in this zip code by the number of employees in 2005:
Mining: Clay and Ceramic and Refractory Minerals Mining (50-99 employees: 1 establishment)
Arts, Entertainment, and Recreation: Marinas (10-19: 1)
Other Services (except Public Administration): Religious Organizations (5-9: 1, 1-4: 1)
Professional, Scientific, and Technical Services: Other Services Related to Advertising (5-9: 1)
Wholesale Trade: Medical, Dental, and Hospital Equipment and Supplies Merchant Wholesalers (5-9: 1)
Mining: Support Activities for Oil and Gas Operations (5-9: 1)
Finance and Insurance: Commercial Banking (1-4: 2)
People in group quarters in 2000:
19 people in other noninstitutional group quarters
Fatal accident statistics in 2014:
Fatal accident count: 3
Vehicles involved in fatal accidents: 6
Fatal accidents caused by drunken drivers: 1
Fatalities: 4
Persons involved in fatal accidents: 7
Pedestrians involved in fatal accidents: 0
Fatal accident statistics in 2013:
Fatal accident count: 1
Vehicles involved in fatal accidents: 2
Fatal accidents caused by drunken drivers: 0
Fatalities: 1
Persons involved in fatal accidents: 2
Pedestrians involved in fatal accidents: 1
2002 - 2018 National Fire Incident Reporting System (NFIRS) incidents
According to the data from the years 2002 - 2018 the average number of fire incidents per year is 33. The highest number of reported fires - 73 took place in 2011, and the least - 19 in 2006. The data has a rising trend.
When looking into fire subcategories, the most reports belonged to: Outside Fires (69.0%), and Structure Fires (18.4%).
Fire incident types reported to NFIRS in Zip Code 75859

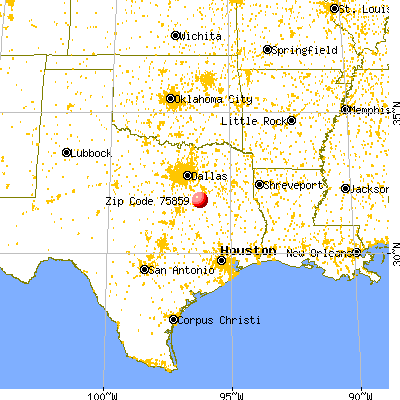


 Nearest zip codes: 75848, 75840, 75109, 76693, 76681, 75144.


 According to the data from the years 2002 - 2018 the average number of fire incidents per year is 33. The highest number of reported fires - 73 took place in 2011, and the least - 19 in 2006. The data has a rising trend.
 When looking into fire subcategories, the most reports belonged to: Outside Fires (69.0%), and Structure Fires (18.4%).