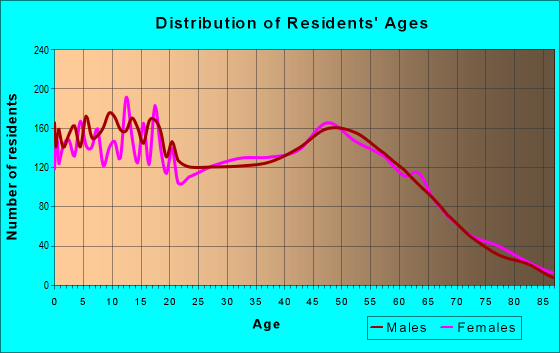
Estimated zip code population in 2022: 20,413 Zip code population in 2010: 19,759 Zip code population in 2000: 17,444
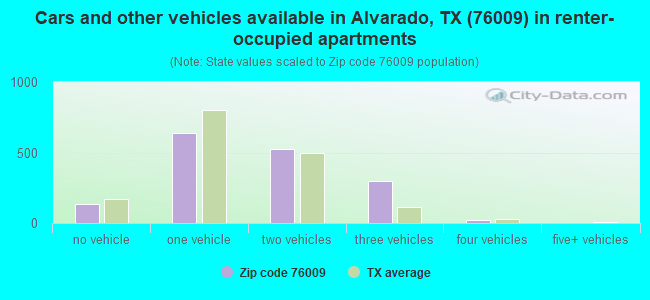
Houses and condos: 7,680 Renter-occupied apartments: 1,627
% of renters here:
24%
State:
38%
March 2022 cost of living index in zip code 76009: 84.8 (less than average, U.S. average is 100)
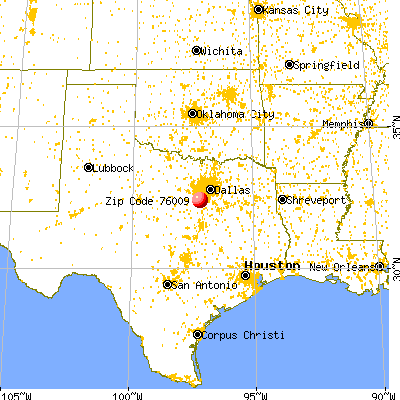
Land area: 98.2 sq. mi. Water area: 1.7 sq. mi.
Population density: 208 people per square mile
(very low).
OSM Map
General Map
Google Map
MSN Map
OSM Map
General Map
Google Map
MSN Map
OSM Map
General Map
Google Map
MSN Map
OSM Map
General Map
Google Map
MSN Map
Please wait while loading the map...
Real estate property taxes paid for housing units in 2022:
This zip code:
1.0% ($1,983)
Texas:
1.5% ($4,050)
Median real estate property taxes paid for housing units with mortgages in 2022: $2,749 (1.3%) Median real estate property taxes paid for housing units with no mortgage in 2022: $1,565 (0.9%)
Averages for the 2020 tax year for zip code 76009, filed in 2021:
Average Adjusted Gross Income (AGI) in 2020: $51,508 (Individual Income Tax Returns)
Here:
$51,508
State:
$77,054
Salary/wage: $47,918 (reported on 83.2% of returns)
Here:
$47,918
State:
$62,766
(% of AGI for various income ranges: 1204.2% for AGIs below $25k, 3633.2% for AGIs $25k-50k, 6836.4% for AGIs $50k-75k, 9483.2% for AGIs $75k-100k, 15889.7% for AGIs $100k-200k, 49408.6% for AGIs over 200k)
Taxable interest for individuals: $1,182 (reported on 14.1% of returns)
This zip code:
$1,182
Texas:
$2,665
(% of AGI for various income ranges: 7.3% for AGIs below $25k, 7.1% for AGIs $25k-50k, 17.4% for AGIs $50k-75k, 17.7% for AGIs $75k-100k, 56.2% for AGIs $100k-200k, 912.9% for AGIs over 200k)
Ordinary dividends: $3,091 (reported on 6.7% of returns)
Here:
$3,091
State:
$10,044
(% of AGI for various income ranges: 6.5% for AGIs below $25k, 10.4% for AGIs $25k-50k, 18.7% for AGIs $50k-75k, 45.3% for AGIs $75k-100k, 100.8% for AGIs $100k-200k, 687.1% for AGIs over 200k)
Net capital gain/loss in AGI: +$15,231 (reported on 7.2% of returns)
Here:
+$15,231
State:
+$39,590
(% of AGI for various income ranges: 10.9% for AGIs below $25k, 5.4% for AGIs $25k-50k, 61.9% for AGIs $50k-75k, 92.9% for AGIs $75k-100k, 258.3% for AGIs $100k-200k, 11104.3% for AGIs over 200k)
Profit/loss from business: +$11,621 (reported on 20.9% of returns)
Here:
+$11,621
State:
+$10,888
(% of AGI for various income ranges: 211.9% for AGIs below $25k, 244.6% for AGIs $25k-50k, 272.1% for AGIs $50k-75k, 332.6% for AGIs $75k-100k, 552.4% for AGIs $100k-200k, 5804.3% for AGIs over 200k)
Taxable individual retirement arrangement distribution: $17,732 (reported on 4.5% of returns)
76009:
$17,732
Texas:
$24,740
(% of AGI for various income ranges: 37.4% for AGIs below $25k, 48.2% for AGIs $25k-50k, 106.0% for AGIs $50k-75k, 204.1% for AGIs $75k-100k, 320.1% for AGIs $100k-200k, 1682.9% for AGIs over 200k)
Total itemized deductions: $37,532 (reported on 3.9% of returns)
Here:
$37,532
State:
$40,428
(% of AGI for various income ranges: 17.9% for AGIs below $25k, 75.4% for AGIs $25k-50k, 180.8% for AGIs $50k-75k, 250.0% for AGIs $75k-100k, 540.3% for AGIs $100k-200k, 7605.7% for AGIs over 200k)
Charity contributions: $14,920 (reported on 2.9% of returns)
Here:
$14,920
State:
$18,201
(% of AGI for various income ranges: 19.3% for AGIs $25k-50k, 51.4% for AGIs $50k-75k, 48.2% for AGIs $75k-100k, 171.8% for AGIs $100k-200k, 2615.7% for AGIs over 200k)
Taxes paid: $5,941 (reported on 3.9% of returns)
76009:
$5,941
State:
$7,821
(% of AGI for various income ranges: 2.7% for AGIs below $25k, 12.7% for AGIs $25k-50k, 35.1% for AGIs $50k-75k, 47.9% for AGIs $75k-100k, 103.1% for AGIs $100k-200k, 812.9% for AGIs over 200k)
Earned income credit: $2,574 (reported on 20.8% of returns)
Here:
$2,574
State:
$2,584
(% of AGI for various income ranges: 123.2% for AGIs below $25k, 87.4% for AGIs $25k-50k, 1.9% for AGIs $50k-75k)
Percentage of individuals using paid preparers for their 2020 taxes: 91.4%
Here:
91%
State:
92%
(% for various income ranges: 89.5% for AGIs below $25k, 92.0% for AGIs $25k-50k, 91.4% for AGIs $50k-75k, 94.4% for AGIs $75k-100k, 93.4% for AGIs $100k-200k, 94.7% for AGIs over 200k)
Averages for the 2012 tax year for zip code 76009, filed in 2013:
Average Adjusted Gross Income (AGI) in 2012: $45,560 (Individual Income Tax Returns)
Here:
$45,560
State:
$65,384
Salary/wage: $41,273 (reported on 86.3% of returns)
Here:
$41,273
State:
$52,524
(% of AGI for various income ranges: 78.2% for AGIs below $25k, 85.0% for AGIs $25k-50k, 84.3% for AGIs $50k-75k, 83.7% for AGIs $75k-100k, 78.8% for AGIs $100k-200k, 41.1% for AGIs over 200k)
Taxable interest for individuals: $1,396 (reported on 16.6% of returns)
This zip code:
$1,396
Texas:
$2,372
(% of AGI for various income ranges: 0.7% for AGIs below $25k, 0.3% for AGIs $25k-50k, 0.3% for AGIs $50k-75k, 0.5% for AGIs $75k-100k, 0.5% for AGIs $100k-200k, 1.3% for AGIs over 200k)
Ordinary dividends: $2,803 (reported on 7.8% of returns)
Here:
$2,803
State:
$9,721
(% of AGI for various income ranges: 0.4% for AGIs below $25k, 0.2% for AGIs $25k-50k, 0.4% for AGIs $50k-75k, 0.7% for AGIs $75k-100k, 0.4% for AGIs $100k-200k, 1.0% for AGIs over 200k)
Net capital gain/loss in AGI: +$11,421 (reported on 6.3% of returns)
Here:
+$11,421
State:
+$35,319
(% of AGI for various income ranges: 0.4% for AGIs $50k-75k, 0.3% for AGIs $75k-100k, 0.9% for AGIs $100k-200k, 12.8% for AGIs over 200k)
Profit/loss from business: +$8,707 (reported on 18.1% of returns)
Here:
+$8,707
State:
+$13,732
(% of AGI for various income ranges: 10.2% for AGIs below $25k, 3.8% for AGIs $25k-50k, 2.0% for AGIs $50k-75k, 1.7% for AGIs $75k-100k, 1.7% for AGIs $100k-200k, 4.3% for AGIs over 200k)
Taxable individual retirement arrangement distribution: $10,649 (reported on 5.6% of returns)
76009:
$10,649
Texas:
$19,511
(% of AGI for various income ranges: 1.9% for AGIs below $25k, 1.1% for AGIs $25k-50k, 1.3% for AGIs $50k-75k, 1.6% for AGIs $75k-100k, 1.7% for AGIs $100k-200k)
Total itemized deductions: $18,907 (21% of AGI, reported on 17.7% of returns)
Here:
$18,907
State:
$24,724
Here:
21.3% of AGI
State:
15.9% of AGI
(% of AGI for various income ranges: 5.0% for AGIs below $25k, 6.5% for AGIs $25k-50k, 8.2% for AGIs $50k-75k, 8.4% for AGIs $75k-100k, 8.6% for AGIs $100k-200k, 5.7% for AGIs over 200k)
Charity contributions: $5,333 (reported on 12.2% of returns)
Here:
$5,333
State:
$6,808
(% of AGI for various income ranges: 0.5% for AGIs below $25k, 0.8% for AGIs $25k-50k, 1.3% for AGIs $50k-75k, 1.5% for AGIs $75k-100k, 2.1% for AGIs $100k-200k, 2.4% for AGIs over 200k)
Taxes paid: $4,279 (reported on 17.1% of returns)
76009:
$4,279
State:
$6,921
(% of AGI for various income ranges: 0.8% for AGIs below $25k, 1.2% for AGIs $25k-50k, 1.7% for AGIs $50k-75k, 1.8% for AGIs $75k-100k, 2.3% for AGIs $100k-200k, 1.5% for AGIs over 200k)
Earned income credit: $2,423 (reported on 24.6% of returns)
Here:
$2,423
State:
$2,570
(% of AGI for various income ranges: 8.5% for AGIs below $25k, 1.5% for AGIs $25k-50k)
Percentage of individuals using paid preparers for their 2012 taxes: 53.7%
Here:
54%
State:
51%
(% for various income ranges: 51.6% for AGIs below $25k, 54.1% for AGIs $25k-50k, 53.1% for AGIs $50k-75k, 53.7% for AGIs $75k-100k, 60.7% for AGIs $100k-200k, 87.5% for AGIs over 200k)
Averages for the 2004 tax year for zip code 76009, filed in 2005:
Average Adjusted Gross Income (AGI) in 2004: $36,215 (Individual Income Tax Returns)
Here:
$36,215
State:
$47,881
Salary/wage: $35,732 (reported on 88.1% of returns)
Here:
$35,732
State:
$41,947
(% of AGI for various income ranges: 180.1% for AGIs below $10k, 83.0% for AGIs $10k-25k, 88.7% for AGIs $25k-50k, 87.9% for AGIs $50k-75k, 89.0% for AGIs $75k-100k, 76.2% for AGIs over 100k)
Taxable interest for individuals: $1,188 (reported on 23.5% of returns)
This zip code:
$1,188
Texas:
$2,255
(% of AGI for various income ranges: 4.9% for AGIs below $10k, 0.9% for AGIs $10k-25k, 0.5% for AGIs $25k-50k, 0.5% for AGIs $50k-75k, 0.5% for AGIs $75k-100k, 1.5% for AGIs over 100k)
Taxable dividends: $1,101 (reported on 9.9% of returns)
Here:
$1,101
State:
$4,261
(% of AGI for various income ranges: 3.7% for AGIs below $10k, 0.4% for AGIs $10k-25k, 0.2% for AGIs $25k-50k, 0.1% for AGIs $50k-75k, 0.3% for AGIs $75k-100k, 0.5% for AGIs over 100k)
Net capital gain/loss: +$3,165 (reported on 9.2% of returns)
Here:
+$3,165
State:
+$16,110
(% of AGI for various income ranges: 4.8% for AGIs below $10k, 0.1% for AGIs $10k-25k, 0.3% for AGIs $25k-50k, 0.7% for AGIs $50k-75k, 0.6% for AGIs $75k-100k, 2.3% for AGIs over 100k)
Profit/loss from business: +$5,421 (reported on 17.4% of returns)
Here:
+$5,421
State:
+$11,013
(% of AGI for various income ranges: -7.0% for AGIs below $10k, 6.1% for AGIs $10k-25k, 3.3% for AGIs $25k-50k, 2.4% for AGIs $50k-75k, 1.1% for AGIs $75k-100k, 1.1% for AGIs over 100k)
IRA payment deduction: $2,729 (reported on 1.4% of returns)
76009:
$2,729
Texas:
$3,120
(% of AGI for various income ranges: 0.1% for AGIs $10k-25k, 0.1% for AGIs $25k-50k, 0.1% for AGIs $50k-75k, 0.1% for AGIs $75k-100k, 0.1% for AGIs over 100k)
Self-employed pension: $4,062 (reported on 0.2% of returns)
Here:
$4,062
Texas:
$16,401
Total itemized deductions: $15,308 (24% of AGI, reported on 20.7% of returns)
Here:
$15,308
State:
$19,631
Here:
23.8% of AGI
State:
18.9% of AGI
(% of AGI for various income ranges: 14.8% for AGIs below $10k, 6.2% for AGIs $10k-25k, 7.6% for AGIs $25k-50k, 9.3% for AGIs $50k-75k, 10.5% for AGIs $75k-100k, 9.9% for AGIs over 100k)
Charity contributions deductions: $3,772 (5% of AGI, reported on 14.9% of returns)
Here:
$3,772
State:
$4,753
Here:
5.3% of AGI
State:
4.2% of AGI
(% of AGI for various income ranges: 0.5% for AGIs below $10k, 0.8% for AGIs $10k-25k, 0.9% for AGIs $25k-50k, 1.5% for AGIs $50k-75k, 1.9% for AGIs $75k-100k, 3.1% for AGIs over 100k)
Total tax: $4,572 (reported on 70.9% of returns)
76009:
$4,572
State:
$9,058
(% of AGI for various income ranges: 5.9% for AGIs below $10k, 4.0% for AGIs $10k-25k, 6.0% for AGIs $25k-50k, 8.5% for AGIs $50k-75k, 10.4% for AGIs $75k-100k, 17.8% for AGIs over 100k)
Earned income credit: $1,916 (reported on 22.7% of returns)
Here:
$1,916
State:
$2,024
Percentage of individuals using paid preparers for their 2004 taxes: 57.2%
Here:
57%
State:
57%
(% for various income ranges: 51.9% for AGIs below $10k, 61.3% for AGIs $10k-25k, 57.2% for AGIs $25k-50k, 57.4% for AGIs $50k-75k, 54.5% for AGIs $75k-100k, 58.6% for AGIs over 100k)
Likely homosexual households (counted as self-reported same-sex unmarried-partner households)
Lesbian couples: 0.9% of all households
Gay men: 0.0% of all households
Household received Food Stamps/SNAP in the past 12 months: 736 Household did not receive Food Stamps/SNAP in the past 12 months: 6,102
Women who had a birth in the past 12 months: 571 (386 now married, 184 unmarried) Women who did not have a birth in the past 12 months: 4,468 (2,173 now married, 2,288 unmarried)
Housing units in zip code 76009 with a mortgage: 2,714 (24 second mortgage) Median monthly owner costs for units with a mortgage: $1,401 Median monthly owner costs for units without a mortgage: $512
Residents with income below the poverty level in 2022:
This zip code:
14.8%
Whole state:
14.0%
Residents with income below 50% of the poverty level in 2022:
This zip code:
9.6%
Whole state:
7.4%
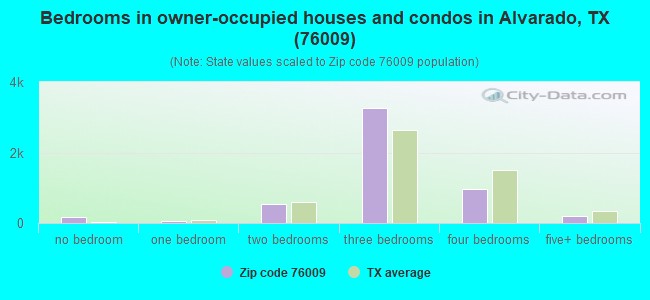
Median number of rooms in houses and condos:
Here:
5.7
State:
6.3
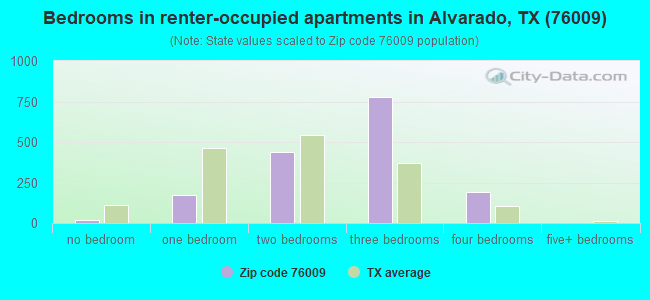
Median number of rooms in apartments:
Here:
4.9
State:
4.0
Notable locations in this zip code not listed on our city pages
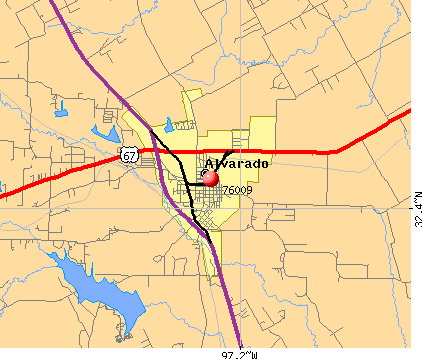
Notable locations in zip code 76009: Alvarado Volunteer Fire Department (A), Blue Water Oaks Volunteer Fire Department (B). Display/hide their locations on the map
Churches in zip code 76009 include: Thompson Church (A), Willow Springs Church (B), Barnesville Church (C), Bethany Church (D), Cahill Church (E), Greenbrier Church (F), Church of Christ (G), Savinegrace Baptist Church (H), Hillside Baptist Church (I). Display/hide their locations on the map
Cemeteries: Barnesville Cemetery (1), Cahill Cemetery (2), Center League Cemetery (3), Old Hill Cemetery (4), Duke Cemetery (5), Glenwood Cemetery (6). Display/hide their locations on the map
Reservoirs: Soil Conservation Service Site 38 Reservoir (A), Soil Conservation Service Site 35 Reservoir (B), Soil Conservation Service Site 30 Reservoir (C), Soil Conservation Service Site 42 Reservoir (D), Soil Conservation Service Site 31 Reservoir (E), Soil Conservation Service Site 32 Reservoir (F), Soil Conservation Service Site 43a Reservoir (G), Carousel Farms Lake (H). Display/hide their locations on the map
In group quarters: 227 (-1 institutionalized population)
Size of family households: 2,208 2-persons, 923 3-persons, 1,290 4-persons, 524 5-persons, 272 6-persons, 285 7-or-more-persons
Size of nonfamily households: 1,123 1-person, 170 2-persons, 4 3-persons
3,061 married couples with children.
1,179 single-parent households (171 men, 1,008 women).
71.7% of residents of 76009 zip code speak English at home.
27.3% of residents speak Spanish at home (62% very well, 15% well, 15% not well, 8% not at all).
0.2% of residents speak other Indo-European language at home (20% very well, 59% well, 22% not well).
0.2% of residents speak Asian or Pacific Island language at home (100% very well).
0.1% of residents speak other language at home (100% very well).
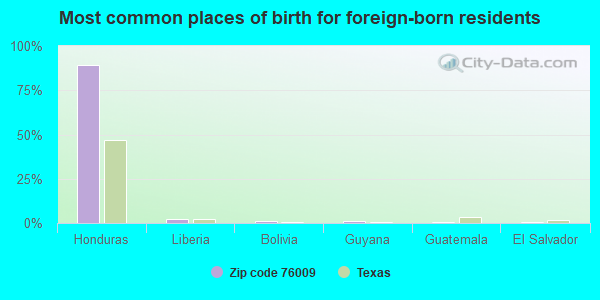
Foreign born population: 1,807 (8.9%) (31.3% of them are naturalized citizens)
This zip code:
8.9%
Whole state:
17.2%
88%Honduras
2%Liberia
1%Bolivia
1%Guyana
1%Guatemala
1%Laos
1%El Salvador
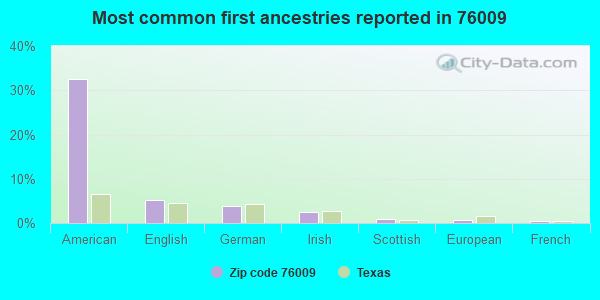
33%American
5%English
4%German
2%Irish
1%Scottish
1%European
0%French
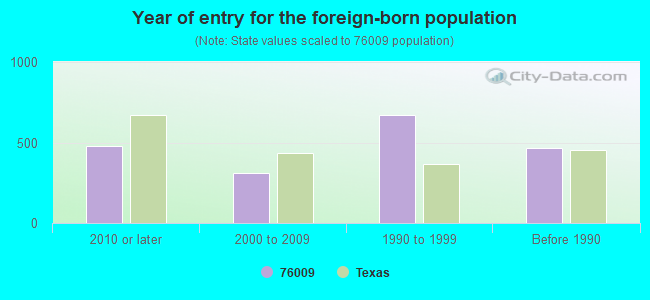
Year of entry for the foreign-born population
4812010 or later
3082000 to 2009
6711990 to 1999
464Before 1990
Facilities with environmental interests located in this zip code:
AMERICAN INDUSTRIAL PRE CAST (3501 S I 35 W in ALVARADO, TX)
(Resource Conservation and Recovery Act (tracking hazardous waste)) Organizations: AMERICAN IND PRECAST (CONTACT/OPERATOR)
Alternative names: AMERICAN IND PRECAST
Housing units lacking complete plumbing facilities: 3.0% Housing units lacking complete kitchen facilities: 6.1%
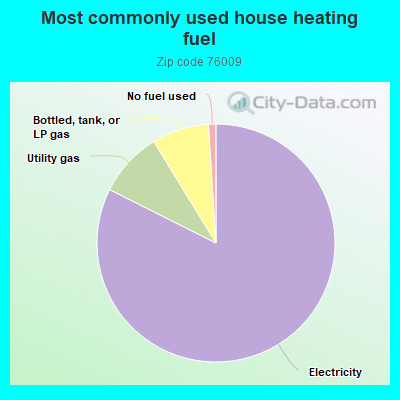
84.0%Electricity
8.3%Utility gas
6.4%Bottled, tank, or LP gas
1.1%No fuel used
Population in 1990: 13,229. Population change in the 1990s: +4,215 (+31.9%).
Place of birth for U.S.-born residents:
This state: 14,458
Northeast: 663
Midwest: 1,108
South: 1,153
West: 975
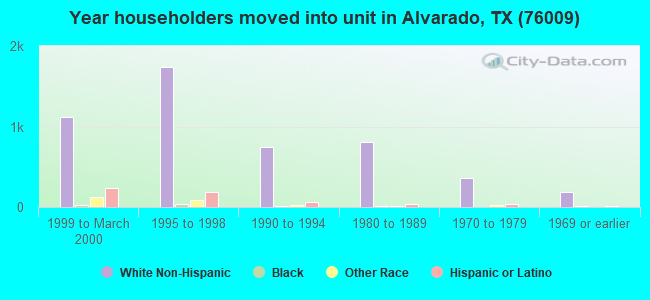
45% of the 76009 zip code residents lived in the same house 5 years ago. Out of people who lived in different houses, 30% lived in this county. Out of people who lived in different counties, 50% lived in Texas.
92% of the 76009 zip code residents lived in the same house 1 year ago. Out of people who lived in different houses, 37% moved from this county. Out of people who lived in different houses, 44% moved from different county within same state. Out of people who lived in different houses, 17% moved from different state. Out of people who lived in different houses, 5% moved from abroad.
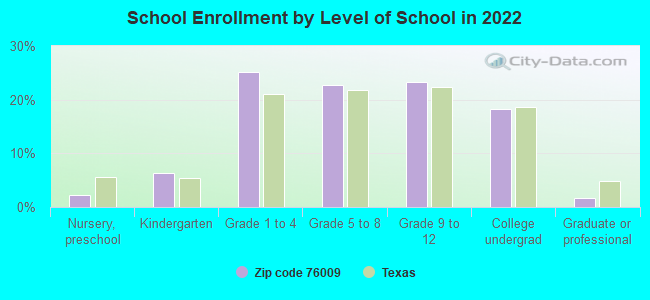
Private vs. public school enrollment:
Students in private schools in grades 1 to 8 (elementary and middle school): 202
Here:
10.2%
Texas:
8.8%
Students in private schools in grades 9 to 12 (high school): 99
Here:
10.3%
Texas:
8.0%
Students in private undergraduate colleges: 30
Here:
3.9%
Texas:
16.2%
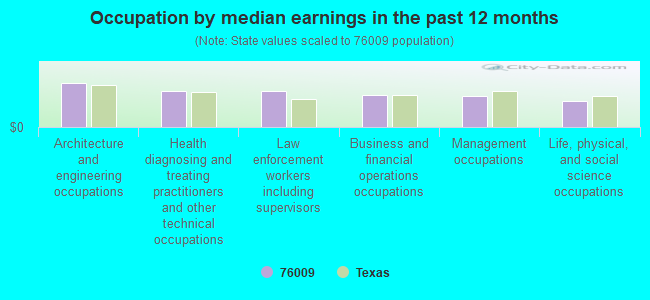
Occupation by median earnings in the past 12 months ($)
102,708Architecture and engineering occupations
83,878Health diagnosing and treating practitioners and other technical occupations
82,874Law enforcement workers including supervisors
74,489Business and financial operations occupations
71,581Management occupations
61,720Life, physical, and social science occupations
Companies with federal contracts located in this zip code:
architectural installations (5208 C.R. 703 in ALVARADO, TX; small business)
$1,908 with Bureau of Prisoners/Federal Prison System for Roofing and Siding Materials. Signed on 2004-12-01. Completion date: 2004-12-01.
F & F INDUSTRIES INC (5345 S I-35 W in ALVARADO, TX; small business)
$500 with Navy for Hardware, Commercial. Signed on 2004-09-13. Completion date: 2004-10-13.
Top industries in this zip code by the number of employees in 2005:
Other Services (except Public Administration): Religious Organizations (250-499 employees: 1 establishment, 20-49 employees: 1 establishment, 10-19 employees: 1 establishment, 1-4 employees: 3 establishments)
Administrative and Support and Waste Management and Remediation Services: Landscaping Services (100-249: 1, 10-19: 2, 1-4: 1)
Administrative and Support and Waste Management and Remediation Services: Professional Employer Organizations (100-249: 1)
Health Care and Social Assistance: Nursing Care Facilities (100-249: 1)
Accommodation and Food Services: Limited-Service Restaurants (20-49: 4, 1-4: 1)
Wholesale Trade: Brick, Stone, and Related Construction Material Merchant Wholesalers (50-99: 1, 20-49: 1, 5-9: 1)
People in group quarters in 2010:
77 people in nursing facilities/skilled-nursing facilities
6 people in group homes intended for adults
People in group quarters in 2000:
98 people in nursing homes
7 people in homes for the mentally retarded
Fatal accident statistics in 2014:
Fatal accident count: 5
Vehicles involved in fatal accidents: 7
Fatal accidents caused by drunken drivers: 1
Fatalities: 6
Persons involved in fatal accidents: 13
Pedestrians involved in fatal accidents: 0
Fatal accident statistics in 2013:
Fatal accident count: 1
Vehicles involved in fatal accidents: 1
Fatal accidents caused by drunken drivers: 1
Fatalities: 1
Persons involved in fatal accidents: 1
Pedestrians involved in fatal accidents: 0
Home Mortgage Disclosure Act Aggregated Statistics For Year 2009 (Based on 2 full and 10 partial tracts)
A) FHA, FSA/RHS & VA Home Purchase Loans
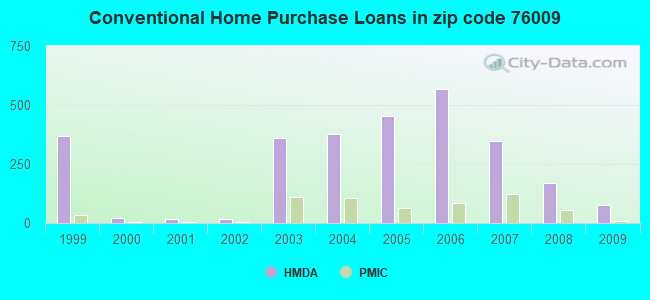
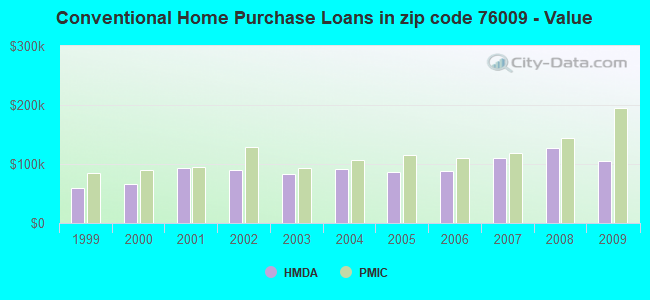
B) Conventional Home Purchase Loans
C) Refinancings
D) Home Improvement Loans
F) Non-occupant Loans on < 5 Family Dwellings (A B C & D)
G) Loans On Manufactured Home Dwelling (A B C & D)
Number
Average Value
Number
Average Value
Number
Average Value
Number
Average Value
Number
Average Value
Number
Average Value
LOANS ORIGINATED
200
$112,861
75
$104,987
254
$139,265
53
$19,157
28
$81,200
79
$69,542
APPLICATIONS APPROVED, NOT ACCEPTED
11
$109,465
19
$113,538
28
$125,517
9
$16,490
6
$39,953
15
$64,949
APPLICATIONS DENIED
26
$95,987
60
$92,682
183
$136,040
81
$23,487
14
$52,209
77
$62,824
APPLICATIONS WITHDRAWN
35
$111,419
19
$96,666
87
$120,755
9
$40,821
5
$64,024
14
$80,686
FILES CLOSED FOR INCOMPLETENESS
2
$100,525
9
$82,003
31
$163,455
8
$50,279
6
$51,108
7
$69,339
Aggregated Statistics For Year 2008 (Based on 2 full and 10 partial tracts)
A) FHA, FSA/RHS & VA Home Purchase Loans
B) Conventional Home Purchase Loans
C) Refinancings
D) Home Improvement Loans
F) Non-occupant Loans on < 5 Family Dwellings (A B C & D)
G) Loans On Manufactured Home Dwelling (A B C & D)
Number
Average Value
Number
Average Value
Number
Average Value
Number
Average Value
Number
Average Value
Number
Average Value
LOANS ORIGINATED
258
$121,606
170
$127,322
189
$125,014
67
$18,806
62
$80,435
130
$80,385
APPLICATIONS APPROVED, NOT ACCEPTED
11
$121,995
39
$89,284
41
$120,547
18
$39,984
3
$51,833
35
$70,413
APPLICATIONS DENIED
52
$106,918
76
$76,349
214
$108,151
141
$33,888
18
$69,472
109
$63,560
APPLICATIONS WITHDRAWN
32
$130,591
30
$109,561
88
$123,982
8
$72,596
7
$59,670
21
$96,381
FILES CLOSED FOR INCOMPLETENESS
13
$109,324
12
$133,790
19
$119,226
5
$21,828
3
$77,883
8
$91,675
Aggregated Statistics For Year 2007 (Based on 2 full and 10 partial tracts)
A) FHA, FSA/RHS & VA Home Purchase Loans
B) Conventional Home Purchase Loans
C) Refinancings
D) Home Improvement Loans
F) Non-occupant Loans on < 5 Family Dwellings (A B C & D)
G) Loans On Manufactured Home Dwelling (A B C & D)
Number
Average Value
Number
Average Value
Number
Average Value
Number
Average Value
Number
Average Value
Number
Average Value
LOANS ORIGINATED
241
$111,771
347
$110,671
242
$119,086
84
$28,327
49
$77,554
152
$78,007
APPLICATIONS APPROVED, NOT ACCEPTED
17
$94,282
72
$86,048
66
$131,019
19
$30,928
13
$94,142
39
$68,671
APPLICATIONS DENIED
58
$102,628
146
$89,211
329
$113,867
161
$29,981
30
$91,048
147
$59,266
APPLICATIONS WITHDRAWN
12
$118,096
52
$115,961
111
$124,840
17
$26,996
9
$101,647
14
$70,173
FILES CLOSED FOR INCOMPLETENESS
5
$81,408
6
$96,792
45
$134,361
6
$46,400
0
$0
7
$39,620
Aggregated Statistics For Year 2006 (Based on 2 full and 10 partial tracts)
A) FHA, FSA/RHS & VA Home Purchase Loans
B) Conventional Home Purchase Loans
C) Refinancings
D) Home Improvement Loans
F) Non-occupant Loans on < 5 Family Dwellings (A B C & D)
G) Loans On Manufactured Home Dwelling (A B C & D)
Number
Average Value
Number
Average Value
Number
Average Value
Number
Average Value
Number
Average Value
Number
Average Value
LOANS ORIGINATED
194
$106,727
567
$87,747
247
$124,860
92
$25,598
84
$62,523
152
$81,281
APPLICATIONS APPROVED, NOT ACCEPTED
3
$173,730
86
$75,240
48
$103,321
23
$43,354
5
$73,530
22
$54,165
APPLICATIONS DENIED
39
$82,189
194
$74,102
333
$104,315
179
$34,271
33
$80,560
151
$58,334
APPLICATIONS WITHDRAWN
16
$101,782
72
$79,975
148
$135,815
13
$33,985
15
$77,411
27
$81,259
FILES CLOSED FOR INCOMPLETENESS
3
$87,973
23
$89,830
61
$156,807
2
$21,910
1
$60,310
5
$87,166
Aggregated Statistics For Year 2005 (Based on 2 full and 10 partial tracts)
A) FHA, FSA/RHS & VA Home Purchase Loans
B) Conventional Home Purchase Loans
C) Refinancings
D) Home Improvement Loans
F) Non-occupant Loans on < 5 Family Dwellings (A B C & D)
G) Loans On Manufactured Home Dwelling (A B C & D)
Number
Average Value
Number
Average Value
Number
Average Value
Number
Average Value
Number
Average Value
Number
Average Value
LOANS ORIGINATED
267
$96,725
454
$85,806
346
$103,144
93
$46,318
77
$89,497
231
$83,711
APPLICATIONS APPROVED, NOT ACCEPTED
12
$83,871
115
$80,981
61
$99,429
16
$40,789
16
$67,023
74
$64,524
APPLICATIONS DENIED
55
$76,129
261
$71,067
429
$98,738
146
$26,229
48
$72,615
222
$61,516
APPLICATIONS WITHDRAWN
28
$89,545
70
$107,698
237
$122,038
51
$139,307
8
$86,346
44
$76,400
FILES CLOSED FOR INCOMPLETENESS
10
$81,798
14
$98,459
91
$121,745
1
$45,910
0
$0
9
$93,437
Aggregated Statistics For Year 2004 (Based on 2 full and 10 partial tracts)
A) FHA, FSA/RHS & VA Home Purchase Loans
B) Conventional Home Purchase Loans
C) Refinancings
D) Home Improvement Loans
E) Loans on Dwellings For 5+ Families
F) Non-occupant Loans on < 5 Family Dwellings (A B C & D)
G) Loans On Manufactured Home Dwelling (A B C & D)
Number
Average Value
Number
Average Value
Number
Average Value
Number
Average Value
Number
Average Value
Number
Average Value
Number
Average Value
LOANS ORIGINATED
249
$92,200
379
$92,346
569
$94,387
104
$36,897
2
$320,230
71
$64,089
295
$79,588
APPLICATIONS APPROVED, NOT ACCEPTED
10
$107,490
80
$91,455
97
$86,864
24
$30,945
0
$0
14
$52,639
29
$49,143
APPLICATIONS DENIED
77
$85,498
165
$68,714
482
$82,396
146
$26,955
0
$0
31
$47,240
182
$63,307
APPLICATIONS WITHDRAWN
29
$94,625
64
$110,933
212
$103,282
17
$41,357
0
$0
6
$74,173
41
$85,990
FILES CLOSED FOR INCOMPLETENESS
9
$67,433
28
$113,806
110
$107,666
2
$50,080
0
$0
3
$110,790
2
$41,725
Aggregated Statistics For Year 2003 (Based on 2 full and 10 partial tracts)
A) FHA, FSA/RHS & VA Home Purchase Loans
B) Conventional Home Purchase Loans
C) Refinancings
D) Home Improvement Loans
E) Loans on Dwellings For 5+ Families
F) Non-occupant Loans on < 5 Family Dwellings (A B C & D)
Number
Average Value
Number
Average Value
Number
Average Value
Number
Average Value
Number
Average Value
Number
Average Value
LOANS ORIGINATED
224
$97,671
359
$82,768
860
$100,823
102
$28,409
2
$271,710
57
$53,588
APPLICATIONS APPROVED, NOT ACCEPTED
15
$92,589
73
$69,569
164
$93,237
29
$31,745
0
$0
17
$99,288
APPLICATIONS DENIED
42
$82,770
242
$67,926
589
$87,906
115
$19,305
0
$0
32
$65,217
APPLICATIONS WITHDRAWN
33
$91,668
82
$86,015
258
$91,745
11
$63,880
0
$0
14
$66,216
FILES CLOSED FOR INCOMPLETENESS
3
$70,993
16
$92,168
45
$103,322
2
$15,350
0
$0
3
$50,357
Aggregated Statistics For Year 2002 (Based on 2 partial tracts)
A) FHA, FSA/RHS & VA Home Purchase Loans
B) Conventional Home Purchase Loans
C) Refinancings
D) Home Improvement Loans
F) Non-occupant Loans on < 5 Family Dwellings (A B C & D)
Number
Average Value
Number
Average Value
Number
Average Value
Number
Average Value
Number
Average Value
LOANS ORIGINATED
4
$84,588
18
$90,565
24
$103,510
6
$17,098
2
$79,970
APPLICATIONS APPROVED, NOT ACCEPTED
0
$0
3
$62,657
5
$107,686
2
$14,975
0
$0
APPLICATIONS DENIED
1
$100,470
9
$80,996
11
$85,635
4
$27,292
1
$44,820
APPLICATIONS WITHDRAWN
1
$63,300
3
$100,040
10
$89,845
0
$0
0
$0
FILES CLOSED FOR INCOMPLETENESS
0
$0
1
$86,020
3
$104,430
0
$0
0
$0
Aggregated Statistics For Year 2001 (Based on 2 partial tracts)
A) FHA, FSA/RHS & VA Home Purchase Loans
B) Conventional Home Purchase Loans
C) Refinancings
D) Home Improvement Loans
F) Non-occupant Loans on < 5 Family Dwellings (A B C & D)
Number
Average Value
Number
Average Value
Number
Average Value
Number
Average Value
Number
Average Value
LOANS ORIGINATED
4
$100,252
18
$92,842
20
$97,524
6
$23,222
2
$47,470
APPLICATIONS APPROVED, NOT ACCEPTED
0
$0
4
$57,295
4
$70,888
1
$53,310
0
$0
APPLICATIONS DENIED
0
$0
13
$42,480
10
$91,927
4
$15,930
0
$0
APPLICATIONS WITHDRAWN
0
$0
3
$87,083
5
$74,382
0
$0
0
$0
FILES CLOSED FOR INCOMPLETENESS
0
$0
0
$0
1
$90,060
0
$0
0
$0
Aggregated Statistics For Year 2000 (Based on 2 partial tracts)
A) FHA, FSA/RHS & VA Home Purchase Loans
B) Conventional Home Purchase Loans
C) Refinancings
D) Home Improvement Loans
F) Non-occupant Loans on < 5 Family Dwellings (A B C & D)
Number
Average Value
Number
Average Value
Number
Average Value
Number
Average Value
Number
Average Value
LOANS ORIGINATED
3
$96,217
21
$66,785
8
$92,075
6
$21,877
3
$57,347
APPLICATIONS APPROVED, NOT ACCEPTED
1
$42,690
2
$39,825
3
$57,207
1
$19,750
0
$0
APPLICATIONS DENIED
0
$0
13
$45,028
6
$72,110
3
$12,320
1
$29,740
APPLICATIONS WITHDRAWN
1
$77,100
2
$82,515
2
$69,350
1
$7,650
0
$0
FILES CLOSED FOR INCOMPLETENESS
0
$0
0
$0
1
$80,710
0
$0
0
$0
Aggregated Statistics For Year 1999 (Based on 4 partial tracts)
A) FHA, FSA/RHS & VA Home Purchase Loans
B) Conventional Home Purchase Loans
C) Refinancings
D) Home Improvement Loans
F) Non-occupant Loans on < 5 Family Dwellings (A B C & D)
2002 - 2018 National Fire Incident Reporting System (NFIRS) incidents
According to the data from the years 2002 - 2018 the average number of fire incidents per year is 219. The highest number of reported fires - 372 took place in 2006, and the least - 125 in 2013. The data has a dropping trend.
When looking into fire subcategories, the most incidents belonged to: Outside Fires (50.8%), and Structure Fires (34.1%).
Fire incident types reported to NFIRS in Zip Code 76009


 Nearest zip codes: 76061, 76084, 76059, 76050, 76031, 76028.
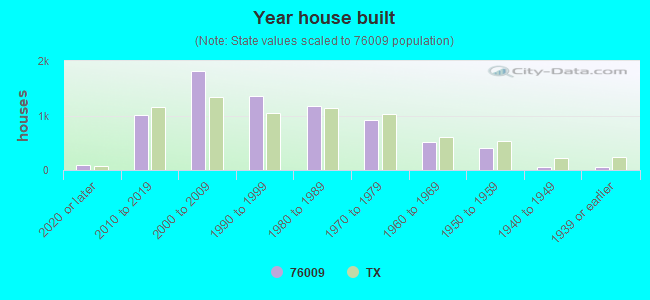


 According to the data from the years 2002 - 2018 the average number of fire incidents per year is 219. The highest number of reported fires - 372 took place in 2006, and the least - 125 in 2013. The data has a dropping trend.
 When looking into fire subcategories, the most incidents belonged to: Outside Fires (50.8%), and Structure Fires (34.1%).