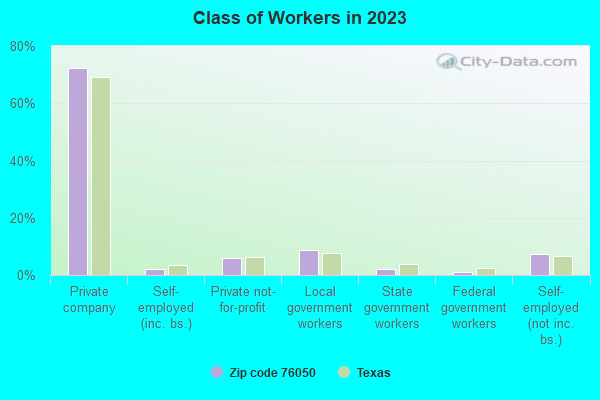
Estimated zip code population in 2022: 7,593 Zip code population in 2010: 5,875 Zip code population in 2000: 5,180
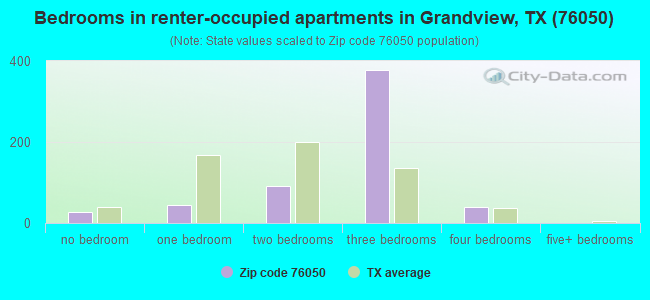
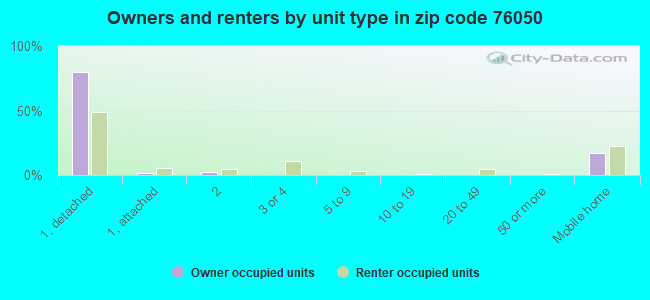
Houses and condos: 2,922 Renter-occupied apartments: 589
% of renters here:
21%
State:
38%
March 2022 cost of living index in zip code 76050: 85.0 (less than average, U.S. average is 100)
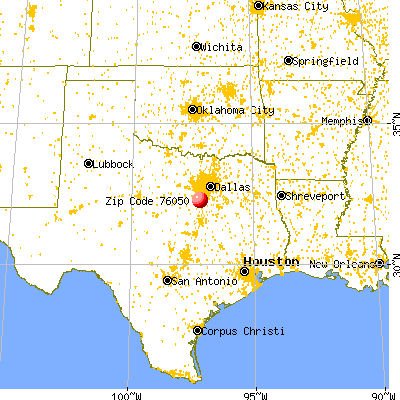
Land area: 122.1 sq. mi. Water area: 1.7 sq. mi.
Population density: 62 people per square mile
(very low).
OSM Map
General Map
Google Map
MSN Map
OSM Map
General Map
Google Map
MSN Map
OSM Map
General Map
Google Map
MSN Map
OSM Map
General Map
Google Map
MSN Map
Please wait while loading the map...
Real estate property taxes paid for housing units in 2022:
This zip code:
1.1% ($2,541)
Texas:
1.5% ($4,050)
Median real estate property taxes paid for housing units with mortgages in 2022: $2,938 (1.2%) Median real estate property taxes paid for housing units with no mortgage in 2022: $1,587 (0.7%)
Averages for the 2020 tax year for zip code 76050, filed in 2021:
Average Adjusted Gross Income (AGI) in 2020: $76,399 (Individual Income Tax Returns)
Here:
$76,399
State:
$77,054
Salary/wage: $65,176 (reported on 82.9% of returns)
Here:
$65,176
State:
$62,766
(% of AGI for various income ranges: 1111.9% for AGIs below $25k, 3476.8% for AGIs $25k-50k, 6499.5% for AGIs $50k-75k, 9773.5% for AGIs $75k-100k, 18251.9% for AGIs $100k-200k, 53576.7% for AGIs over 200k)
Taxable interest for individuals: $2,022 (reported on 27.8% of returns)
This zip code:
$2,022
Texas:
$2,665
(% of AGI for various income ranges: 25.9% for AGIs below $25k, 18.4% for AGIs $25k-50k, 53.2% for AGIs $50k-75k, 13.1% for AGIs $75k-100k, 77.6% for AGIs $100k-200k, 1730.0% for AGIs over 200k)
Ordinary dividends: $4,158 (reported on 14.7% of returns)
Here:
$4,158
State:
$10,044
(% of AGI for various income ranges: 12.6% for AGIs below $25k, 31.6% for AGIs $25k-50k, 59.2% for AGIs $50k-75k, 38.8% for AGIs $75k-100k, 117.6% for AGIs $100k-200k, 1623.3% for AGIs over 200k)
Net capital gain/loss in AGI: +$22,961 (reported on 15.6% of returns)
Here:
+$22,961
State:
+$39,590
(% of AGI for various income ranges: 10.7% for AGIs below $25k, 36.1% for AGIs $25k-50k, 98.6% for AGIs $50k-75k, 160.4% for AGIs $75k-100k, 431.4% for AGIs $100k-200k, 15086.7% for AGIs over 200k)
Profit/loss from business: +$14,145 (reported on 22.3% of returns)
Here:
+$14,145
State:
+$10,888
(% of AGI for various income ranges: 118.3% for AGIs below $25k, 234.7% for AGIs $25k-50k, 360.0% for AGIs $50k-75k, 449.2% for AGIs $75k-100k, 810.3% for AGIs $100k-200k, 4456.7% for AGIs over 200k)
Taxable individual retirement arrangement distribution: $18,875 (reported on 7.3% of returns)
76050:
$18,875
Texas:
$24,740
(% of AGI for various income ranges: 79.0% for AGIs below $25k, 71.2% for AGIs $25k-50k, 248.9% for AGIs $50k-75k, 144.6% for AGIs $75k-100k, 616.8% for AGIs $100k-200k)
Total itemized deductions: $40,087 (reported on 7.0% of returns)
Here:
$40,087
State:
$40,428
(% of AGI for various income ranges: 116.2% for AGIs below $25k, 214.3% for AGIs $50k-75k, 331.2% for AGIs $75k-100k, 601.4% for AGIs $100k-200k, 7565.0% for AGIs over 200k)
Charity contributions: $12,395 (reported on 5.8% of returns)
Here:
$12,395
State:
$18,201
(% of AGI for various income ranges: 75.7% for AGIs $50k-75k, 75.0% for AGIs $75k-100k, 179.5% for AGIs $100k-200k, 2026.7% for AGIs over 200k)
Taxes paid: $6,504 (reported on 7.3% of returns)
76050:
$6,504
State:
$7,821
(% of AGI for various income ranges: 20.3% for AGIs below $25k, 40.3% for AGIs $50k-75k, 66.9% for AGIs $75k-100k, 132.7% for AGIs $100k-200k, 1011.7% for AGIs over 200k)
Earned income credit: $2,547 (reported on 13.8% of returns)
Here:
$2,547
State:
$2,584
(% of AGI for various income ranges: 101.0% for AGIs below $25k, 78.8% for AGIs $25k-50k)
Percentage of individuals using paid preparers for their 2020 taxes: 93.3%
Here:
93%
State:
92%
(% for various income ranges: 93.5% for AGIs below $25k, 92.8% for AGIs $25k-50k, 94.1% for AGIs $50k-75k, 91.9% for AGIs $75k-100k, 93.4% for AGIs $100k-200k, 94.1% for AGIs over 200k)
Averages for the 2012 tax year for zip code 76050, filed in 2013:
Average Adjusted Gross Income (AGI) in 2012: $61,252 (Individual Income Tax Returns)
Here:
$61,252
State:
$65,384
Salary/wage: $51,018 (reported on 84.1% of returns)
Here:
$51,018
State:
$52,524
(% of AGI for various income ranges: 76.7% for AGIs below $25k, 79.3% for AGIs $25k-50k, 82.2% for AGIs $50k-75k, 87.3% for AGIs $75k-100k, 81.3% for AGIs $100k-200k, 32.1% for AGIs over 200k)
Taxable interest for individuals: $2,096 (reported on 27.7% of returns)
This zip code:
$2,096
Texas:
$2,372
(% of AGI for various income ranges: 1.3% for AGIs below $25k, 0.4% for AGIs $25k-50k, 0.7% for AGIs $50k-75k, 0.2% for AGIs $75k-100k, 0.9% for AGIs $100k-200k, 1.8% for AGIs over 200k)
Ordinary dividends: $3,516 (reported on 14.4% of returns)
Here:
$3,516
State:
$9,721
(% of AGI for various income ranges: 0.7% for AGIs below $25k, 0.5% for AGIs $25k-50k, 0.7% for AGIs $50k-75k, 0.3% for AGIs $75k-100k, 0.7% for AGIs $100k-200k, 1.6% for AGIs over 200k)
Net capital gain/loss in AGI: +$9,724 (reported on 12.5% of returns)
Here:
+$9,724
State:
+$35,319
(% of AGI for various income ranges: 0.2% for AGIs below $25k, 0.2% for AGIs $50k-75k, 2.3% for AGIs $100k-200k, 5.5% for AGIs over 200k)
Profit/loss from business: +$10,889 (reported on 20.1% of returns)
Here:
+$10,889
State:
+$13,732
(% of AGI for various income ranges: 8.4% for AGIs below $25k, 5.6% for AGIs $25k-50k, 3.7% for AGIs $50k-75k, 2.2% for AGIs $75k-100k, 5.0% for AGIs $100k-200k)
Taxable individual retirement arrangement distribution: $12,046 (reported on 9.1% of returns)
76050:
$12,046
Texas:
$19,511
(% of AGI for various income ranges: 3.1% for AGIs below $25k, 2.1% for AGIs $25k-50k, 2.5% for AGIs $50k-75k, 2.1% for AGIs $75k-100k, 2.3% for AGIs $100k-200k)
Total itemized deductions: $21,164 (20% of AGI, reported on 26.1% of returns)
Here:
$21,164
State:
$24,724
Here:
19.8% of AGI
State:
15.9% of AGI
(% of AGI for various income ranges: 8.1% for AGIs below $25k, 8.4% for AGIs $25k-50k, 11.3% for AGIs $50k-75k, 9.5% for AGIs $75k-100k, 11.0% for AGIs $100k-200k, 5.8% for AGIs over 200k)
Charity contributions: $5,619 (reported on 19.7% of returns)
Here:
$5,619
State:
$6,808
(% of AGI for various income ranges: 1.0% for AGIs below $25k, 1.1% for AGIs $25k-50k, 2.0% for AGIs $50k-75k, 1.6% for AGIs $75k-100k, 2.2% for AGIs $100k-200k, 2.1% for AGIs over 200k)
Taxes paid: $4,581 (reported on 26.1% of returns)
76050:
$4,581
State:
$6,921
(% of AGI for various income ranges: 1.2% for AGIs below $25k, 1.5% for AGIs $25k-50k, 2.1% for AGIs $50k-75k, 2.0% for AGIs $75k-100k, 2.7% for AGIs $100k-200k, 1.5% for AGIs over 200k)
Earned income credit: $2,302 (reported on 17.8% of returns)
Here:
$2,302
State:
$2,570
(% of AGI for various income ranges: 7.1% for AGIs below $25k, 1.1% for AGIs $25k-50k)
Percentage of individuals using paid preparers for their 2012 taxes: 54.2%
Here:
54%
State:
51%
(% for various income ranges: 45.5% for AGIs below $25k, 51.7% for AGIs $25k-50k, 57.5% for AGIs $50k-75k, 64.0% for AGIs $75k-100k, 63.6% for AGIs $100k-200k, 100.0% for AGIs over 200k)
Averages for the 2004 tax year for zip code 76050, filed in 2005:
Average Adjusted Gross Income (AGI) in 2004: $43,108 (Individual Income Tax Returns)
Here:
$43,108
State:
$47,881
Salary/wage: $41,527 (reported on 83.7% of returns)
Here:
$41,527
State:
$41,947
(% of AGI for various income ranges: 246.4% for AGIs below $10k, 74.5% for AGIs $10k-25k, 83.7% for AGIs $25k-50k, 86.4% for AGIs $50k-75k, 84.6% for AGIs $75k-100k, 68.3% for AGIs over 100k)
Taxable interest for individuals: $1,550 (reported on 37.2% of returns)
This zip code:
$1,550
Texas:
$2,255
(% of AGI for various income ranges: 38.3% for AGIs below $10k, 2.3% for AGIs $10k-25k, 0.6% for AGIs $25k-50k, 1.0% for AGIs $50k-75k, 0.4% for AGIs $75k-100k, 1.5% for AGIs over 100k)
Taxable dividends: $1,638 (reported on 17.7% of returns)
Here:
$1,638
State:
$4,261
(% of AGI for various income ranges: 4.7% for AGIs below $10k, 0.6% for AGIs $10k-25k, 0.3% for AGIs $25k-50k, 0.1% for AGIs $50k-75k, 0.5% for AGIs $75k-100k, 1.4% for AGIs over 100k)
Net capital gain/loss: +$4,770 (reported on 15.6% of returns)
Here:
+$4,770
State:
+$16,110
(% of AGI for various income ranges: -2.3% for AGIs below $10k, -0.6% for AGIs $10k-25k, 0.1% for AGIs $25k-50k, 0.9% for AGIs $50k-75k, 1.0% for AGIs $75k-100k, 4.9% for AGIs over 100k)
Profit/loss from business: +$9,434 (reported on 20.6% of returns)
Here:
+$9,434
State:
+$11,013
(% of AGI for various income ranges: 16.6% for AGIs below $10k, 8.6% for AGIs $10k-25k, 5.4% for AGIs $25k-50k, 2.4% for AGIs $50k-75k, 5.5% for AGIs $75k-100k, 3.3% for AGIs over 100k)
IRA payment deduction: $3,256 (reported on 1.8% of returns)
76050:
$3,256
Texas:
$3,120
Total itemized deductions: $17,080 (22% of AGI, reported on 25.4% of returns)
Here:
$17,080
State:
$19,631
Here:
22.3% of AGI
State:
18.9% of AGI
(% of AGI for various income ranges: 21.5% for AGIs below $10k, 8.6% for AGIs $10k-25k, 8.5% for AGIs $25k-50k, 11.6% for AGIs $50k-75k, 11.7% for AGIs $75k-100k, 9.1% for AGIs over 100k)
Charity contributions deductions: $3,979 (5% of AGI, reported on 19.9% of returns)
Here:
$3,979
State:
$4,753
Here:
4.8% of AGI
State:
4.2% of AGI
(% of AGI for various income ranges: 1.8% for AGIs below $10k, 1.0% for AGIs $10k-25k, 1.0% for AGIs $25k-50k, 1.8% for AGIs $50k-75k, 2.2% for AGIs $75k-100k, 2.6% for AGIs over 100k)
Total tax: $5,942 (reported on 73.8% of returns)
76050:
$5,942
State:
$9,058
(% of AGI for various income ranges: 7.0% for AGIs below $10k, 3.9% for AGIs $10k-25k, 6.3% for AGIs $25k-50k, 7.9% for AGIs $50k-75k, 10.4% for AGIs $75k-100k, 17.0% for AGIs over 100k)
Earned income credit: $1,789 (reported on 16.4% of returns)
Here:
$1,789
State:
$2,024
Percentage of individuals using paid preparers for their 2004 taxes: 62.3%
Here:
62%
State:
57%
(% for various income ranges: 53.9% for AGIs below $10k, 61.7% for AGIs $10k-25k, 64.2% for AGIs $25k-50k, 64.8% for AGIs $50k-75k, 65.4% for AGIs $75k-100k, 69.9% for AGIs over 100k)
Household received Food Stamps/SNAP in the past 12 months: 160 Household did not receive Food Stamps/SNAP in the past 12 months: 2,605
Women who had a birth in the past 12 months: 54 (34 now married, 19 unmarried) Women who did not have a birth in the past 12 months: 1,457 (836 now married, 614 unmarried)
Housing units in zip code 76050 with a mortgage: 1,142 (16 second mortgage) Houses without a mortgage: 190
Median monthly owner costs for units with a mortgage: $1,484 Median monthly owner costs for units without a mortgage: $532
Residents with income below the poverty level in 2022:
This zip code:
6.2%
Whole state:
14.0%
Residents with income below 50% of the poverty level in 2022:
This zip code:
4.0%
Whole state:
7.4%
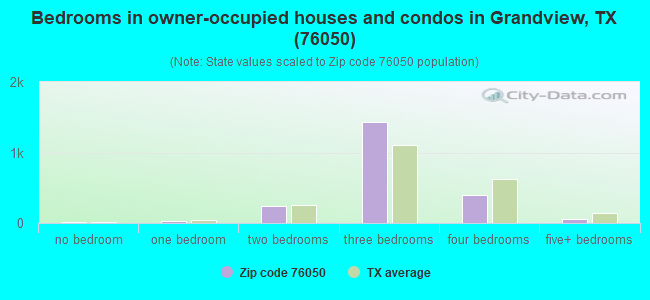
Median number of rooms in houses and condos:
Here:
5.5
State:
6.3
Median number of rooms in apartments:
Here:
5.1
State:
4.0
Notable locations in this zip code not listed on our city pages
Churches in zip code 76050 include: Watts Chapel (A), Grandview Seventh Day Adventist Church (B), Chapel of Faith Church (C). Display/hide their locations on the map
Cemeteries: Antioch Rest Cemetery (1), Morrow Cemetery (2), Bee Creek Cemetery (3), Boatright Cemetery (4), Oakland Cemetery (5), Odom Cemetery (6), Grandview Cemetery (7). Display/hide their locations on the map
Reservoirs: Soil Conservation Service Site 77 Reservoir (A), Soil Conservation Service Site 79b Reservoir (B), Soil Conservation Service Site 79a Reservoir (C), Soil Conservation Service Site 78 Reservoir (D), Soil Conservation Service Site 74 Reservoir (E), Soil Conservation Service Site 65a Reservoir (F), Buck Ranch Reservoir Number 4 (G), Soil Conservation Service Site 61a Reservoir (H). Display/hide their locations on the map
Creeks: Rock Tank Creek (A), North Fork South Fork Chambers Creek (B), South Fork South Fork Chambers Creek (C), Hayden Creek (D), Middle Fork South Fork Chambers Creek (E), Itasca Creek (F), Island Creek (G), Cottonwood Creek (H), Boggy Creek (I). Display/hide their locations on the map
In group quarters: 92 (-1 institutionalized population)
Size of family households: 919 2-persons, 544 3-persons, 418 4-persons, 227 5-persons, 72 6-persons, 20 7-or-more-persons
Size of nonfamily households: 517 1-person, 31 2-persons, 8 4-persons
975 married couples with children.
121 single-parent households (35 men, 86 women).
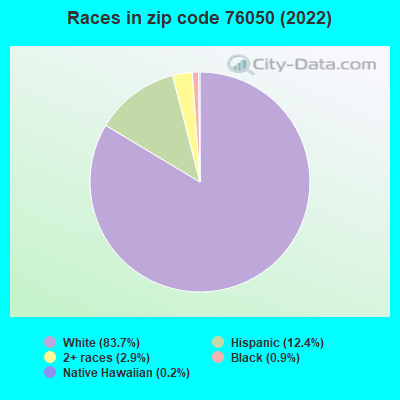
93.7% of residents of 76050 zip code speak English at home.
5.9% of residents speak Spanish at home (45% very well, 32% well, 19% not well, 5% not at all).
0.2% of residents speak other Indo-European language at home (100% very well).
0.1% of residents speak Asian or Pacific Island language at home (100% very well).
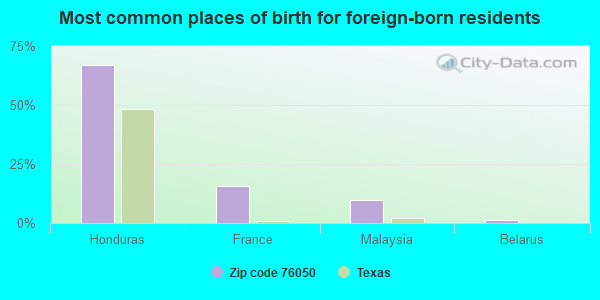
Foreign born population: 84 (1.1%) (60.1% of them are naturalized citizens)
This zip code:
1.1%
Whole state:
17.2%
67%Honduras
16%France
10%Malaysia
1%Belarus
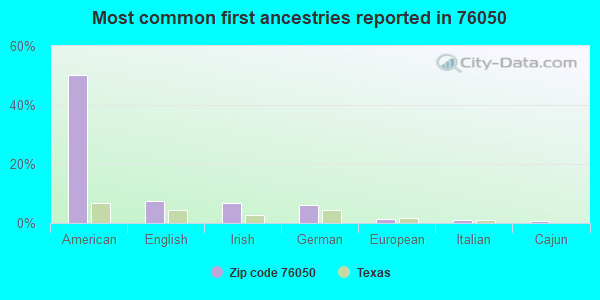
50%American
7%English
7%Irish
6%German
1%European
1%Italian
1%Cajun
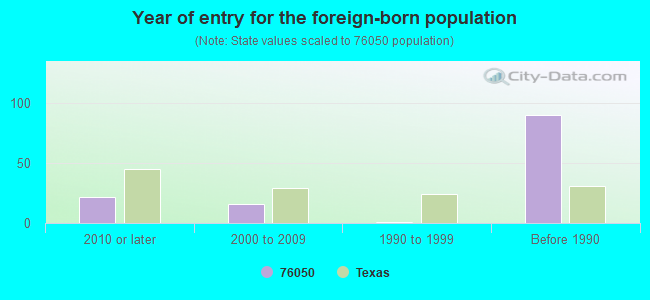
Year of entry for the foreign-born population
222010 or later
162000 to 2009
11990 to 1999
90Before 1990
Facilities with environmental interests located in this zip code:
BARKER CHEMICAL CO (HIGHWAY 35 W HIGHWAY 81 in GRANDVIEW, TX)
TSD (Resource Conservation and Recovery Act (tracking hazardous waste)) - notification Organizations: BARKER CHEMICAL COMPANY (CONTACT/OPERATOR)
Housing units lacking complete plumbing facilities: 1.5% Housing units lacking complete kitchen facilities: 3.4%
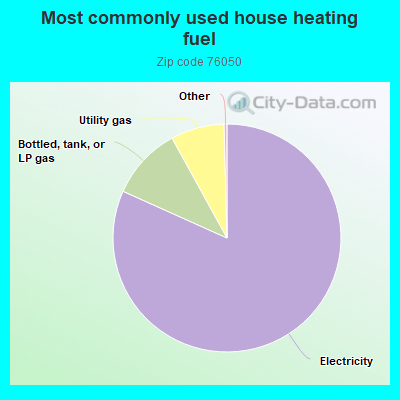
81.8%Electricity
10.3%Bottled, tank, or LP gas
7.6%Utility gas
Population in 1990: 4,850. Population change in the 1990s: +330 (+6.8%).
Place of birth for U.S.-born residents:
This state: 5,637
Northeast: 365
Midwest: 361
South: 506
West: 554
57% of the 76050 zip code residents lived in the same house 5 years ago. Out of people who lived in different houses, 46% lived in this county. Out of people who lived in different counties, 50% lived in Texas.
95% of the 76050 zip code residents lived in the same house 1 year ago. Out of people who lived in different houses, 27% moved from this county. Out of people who lived in different houses, 64% moved from different county within same state. Out of people who lived in different houses, 8% moved from different state. Out of people who lived in different houses, 8% moved from abroad.
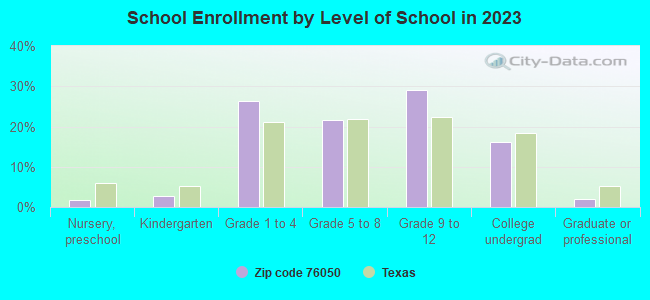
Private vs. public school enrollment:
Students in private schools in grades 1 to 8 (elementary and middle school): 30
Here:
4.8%
Texas:
8.8%
Students in private schools in grades 9 to 12 (high school): 22
Here:
5.8%
Texas:
8.0%
Students in private undergraduate colleges: 2
Here:
1.1%
Texas:
16.2%
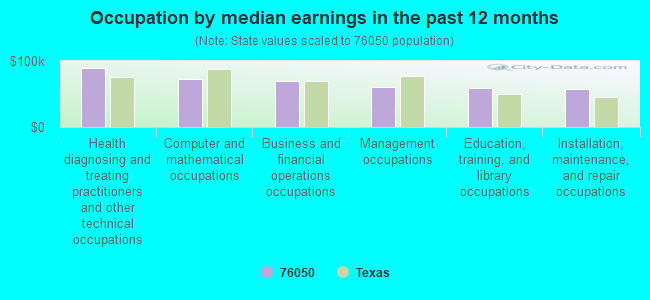
Occupation by median earnings in the past 12 months ($)
88,731Health diagnosing and treating practitioners and other technical occupations
72,891Computer and mathematical occupations
69,240Business and financial operations occupations
59,973Management occupations
58,696Education, training, and library occupations
57,636Installation, maintenance, and repair occupations
Companies with federal contracts located in this zip code:
BEAUMONT LAND & CATTLE (10736 COUNTY ROAD 102 in GRANDVIEW, TX; small business)
$60,675 with Army for Lectures For Training. Signed on 2000-08-03. Completion date: 2000-08-04.
MICHELLE TYE DBA SPECIALTY RES (6317 FM 916 in GRANDVIEW, TX; small business)
$7,500 with Air Force for Vocational/Technical. Signed on 2005-05-25. Completion date: 2005-06-19.
Top industries in this zip code by the number of employees in 2005:
Other Services (except Public Administration): Commercial and Industrial Machinery and Equipment (except Automotive and Electronic) Repair and Maintenance (100-249 employees: 1 establishment, 20-49 employees: 1 establishment, 1-4 employees: 1 establishment)
Health Care and Social Assistance: Nursing Care Facilities (50-99: 1)
Management of Companies and Enterprises: Corporate, Subsidiary, and Regional Managing Offices (20-49: 1, 10-19: 1)
Construction: New Single-Family Housing Construction (except Operative Builders) (20-49: 1, 1-4: 1)
Accommodation and Food Services: Caterers (20-49: 1)
Construction: Water and Sewer Line and Related Structures Construction (20-49: 1)
Finance and Insurance: Commercial Banking (20-49: 1)
People in group quarters in 2010:
76 people in nursing facilities/skilled-nursing facilities
6 people in group homes intended for adults
People in group quarters in 2000:
76 people in nursing homes
Fatal accident statistics in 2014:
Fatal accident count: 1
Vehicles involved in fatal accidents: 1
Fatal accidents caused by drunken drivers: 0
Fatalities: 1
Persons involved in fatal accidents: 1
Pedestrians involved in fatal accidents: 1
Fatal accident statistics in 2013:
Fatal accident count: 2
Vehicles involved in fatal accidents: 2
Fatal accidents caused by drunken drivers: 0
Fatalities: 2
Persons involved in fatal accidents: 2
Pedestrians involved in fatal accidents: 0
Home Mortgage Disclosure Act Aggregated Statistics For Year 2009 (Based on 2 partial tracts)
A) FHA, FSA/RHS & VA Home Purchase Loans
B) Conventional Home Purchase Loans
C) Refinancings
D) Home Improvement Loans
E) Loans on Dwellings For 5+ Families
F) Non-occupant Loans on < 5 Family Dwellings (A B C & D)
G) Loans On Manufactured Home Dwelling (A B C & D)
Number
Average Value
Number
Average Value
Number
Average Value
Number
Average Value
Number
Average Value
Number
Average Value
Number
Average Value
LOANS ORIGINATED
35
$130,439
35
$121,247
89
$169,708
20
$30,333
2
$274,995
17
$77,591
12
$101,750
APPLICATIONS APPROVED, NOT ACCEPTED
5
$132,058
2
$127,920
17
$154,912
6
$29,108
0
$0
0
$0
2
$44,430
APPLICATIONS DENIED
3
$169,030
11
$111,000
60
$214,020
18
$46,216
0
$0
2
$39,830
5
$58,828
APPLICATIONS WITHDRAWN
3
$181,287
9
$166,818
34
$126,075
3
$25,023
0
$0
0
$0
2
$65,110
FILES CLOSED FOR INCOMPLETENESS
3
$57,707
5
$386,370
8
$155,690
0
$0
0
$0
0
$0
0
$0
Aggregated Statistics For Year 2008 (Based on 2 partial tracts)
A) FHA, FSA/RHS & VA Home Purchase Loans
B) Conventional Home Purchase Loans
C) Refinancings
D) Home Improvement Loans
F) Non-occupant Loans on < 5 Family Dwellings (A B C & D)
G) Loans On Manufactured Home Dwelling (A B C & D)
Number
Average Value
Number
Average Value
Number
Average Value
Number
Average Value
Number
Average Value
Number
Average Value
LOANS ORIGINATED
21
$144,810
51
$202,494
64
$120,070
14
$54,605
21
$272,477
12
$105,197
APPLICATIONS APPROVED, NOT ACCEPTED
3
$88,347
14
$94,327
23
$110,970
9
$21,959
2
$45,195
9
$66,217
APPLICATIONS DENIED
0
$0
20
$100,729
90
$167,516
21
$31,807
5
$124,092
12
$42,513
APPLICATIONS WITHDRAWN
5
$155,652
8
$113,176
26
$120,910
6
$41,620
2
$34,470
3
$101,623
FILES CLOSED FOR INCOMPLETENESS
2
$100,345
2
$94,985
9
$129,029
2
$7,660
2
$39,065
3
$91,920
Aggregated Statistics For Year 2007 (Based on 2 partial tracts)
A) FHA, FSA/RHS & VA Home Purchase Loans
B) Conventional Home Purchase Loans
C) Refinancings
D) Home Improvement Loans
F) Non-occupant Loans on < 5 Family Dwellings (A B C & D)
G) Loans On Manufactured Home Dwelling (A B C & D)
Number
Average Value
Number
Average Value
Number
Average Value
Number
Average Value
Number
Average Value
Number
Average Value
LOANS ORIGINATED
32
$127,204
97
$106,071
83
$136,108
28
$32,993
15
$84,771
28
$83,330
APPLICATIONS APPROVED, NOT ACCEPTED
0
$0
26
$146,542
21
$180,922
9
$64,684
5
$98,354
5
$49,330
APPLICATIONS DENIED
11
$165,874
51
$91,199
113
$151,492
44
$48,641
12
$129,198
32
$75,547
APPLICATIONS WITHDRAWN
3
$93,453
21
$124,384
69
$136,548
6
$46,727
2
$170,820
5
$94,984
FILES CLOSED FOR INCOMPLETENESS
0
$0
3
$117,453
17
$185,102
3
$58,727
0
$0
0
$0
Aggregated Statistics For Year 2006 (Based on 2 partial tracts)
A) FHA, FSA/RHS & VA Home Purchase Loans
B) Conventional Home Purchase Loans
C) Refinancings
D) Home Improvement Loans
F) Non-occupant Loans on < 5 Family Dwellings (A B C & D)
G) Loans On Manufactured Home Dwelling (A B C & D)
Number
Average Value
Number
Average Value
Number
Average Value
Number
Average Value
Number
Average Value
Number
Average Value
LOANS ORIGINATED
25
$102,705
176
$93,678
110
$132,407
38
$30,922
21
$49,462
25
$68,327
APPLICATIONS APPROVED, NOT ACCEPTED
2
$81,960
21
$106,730
41
$124,092
11
$35,793
6
$75,833
5
$39,832
APPLICATIONS DENIED
5
$61,586
84
$79,737
110
$118,939
60
$41,619
17
$54,521
34
$57,495
APPLICATIONS WITHDRAWN
2
$121,795
26
$130,750
51
$124,122
3
$35,747
3
$26,043
5
$81,196
FILES CLOSED FOR INCOMPLETENESS
0
$0
9
$158,988
14
$118,730
2
$22,980
0
$0
3
$41,873
Aggregated Statistics For Year 2005 (Based on 2 partial tracts)
A) FHA, FSA/RHS & VA Home Purchase Loans
B) Conventional Home Purchase Loans
C) Refinancings
D) Home Improvement Loans
F) Non-occupant Loans on < 5 Family Dwellings (A B C & D)
G) Loans On Manufactured Home Dwelling (A B C & D)
Number
Average Value
Number
Average Value
Number
Average Value
Number
Average Value
Number
Average Value
Number
Average Value
LOANS ORIGINATED
28
$100,455
149
$91,869
149
$132,389
35
$62,068
20
$133,284
26
$82,846
APPLICATIONS APPROVED, NOT ACCEPTED
2
$29,875
14
$43,553
35
$136,961
12
$36,257
3
$58,217
11
$40,111
APPLICATIONS DENIED
11
$60,723
54
$84,033
142
$116,842
43
$42,647
11
$134,537
29
$66,932
APPLICATIONS WITHDRAWN
5
$104,176
23
$112,302
84
$124,201
15
$194,973
5
$77,826
6
$74,557
FILES CLOSED FOR INCOMPLETENESS
0
$0
3
$84,770
28
$126,828
2
$10,725
0
$0
0
$0
Aggregated Statistics For Year 2004 (Based on 2 partial tracts)
A) FHA, FSA/RHS & VA Home Purchase Loans
B) Conventional Home Purchase Loans
C) Refinancings
D) Home Improvement Loans
F) Non-occupant Loans on < 5 Family Dwellings (A B C & D)
G) Loans On Manufactured Home Dwelling (A B C & D)
Number
Average Value
Number
Average Value
Number
Average Value
Number
Average Value
Number
Average Value
Number
Average Value
LOANS ORIGINATED
21
$90,169
129
$99,022
202
$111,055
34
$25,323
28
$72,168
37
$71,052
APPLICATIONS APPROVED, NOT ACCEPTED
2
$28,340
28
$105,434
21
$111,252
9
$27,576
3
$26,553
3
$42,387
APPLICATIONS DENIED
5
$103,870
40
$68,250
116
$106,566
35
$30,377
2
$13,020
31
$46,850
APPLICATIONS WITHDRAWN
9
$94,643
12
$85,792
78
$106,670
3
$65,367
0
$0
6
$93,452
FILES CLOSED FOR INCOMPLETENESS
0
$0
2
$51,320
31
$97,257
5
$31,560
0
$0
0
$0
Aggregated Statistics For Year 2003 (Based on 2 partial tracts)
A) FHA, FSA/RHS & VA Home Purchase Loans
B) Conventional Home Purchase Loans
C) Refinancings
D) Home Improvement Loans
F) Non-occupant Loans on < 5 Family Dwellings (A B C & D)
Number
Average Value
Number
Average Value
Number
Average Value
Number
Average Value
Number
Average Value
LOANS ORIGINATED
17
$110,124
118
$100,515
273
$110,904
34
$20,682
20
$54,846
APPLICATIONS APPROVED, NOT ACCEPTED
0
$0
29
$79,506
54
$99,296
6
$18,128
9
$89,537
APPLICATIONS DENIED
2
$58,980
78
$80,489
152
$96,708
29
$16,271
8
$80,430
APPLICATIONS WITHDRAWN
8
$92,686
25
$74,946
67
$122,240
0
$0
2
$30,640
FILES CLOSED FOR INCOMPLETENESS
0
$0
3
$85,793
17
$125,444
0
$0
0
$0
Aggregated Statistics For Year 2002 (Based on 2 partial tracts)
A) FHA, FSA/RHS & VA Home Purchase Loans
B) Conventional Home Purchase Loans
C) Refinancings
D) Home Improvement Loans
F) Non-occupant Loans on < 5 Family Dwellings (A B C & D)
Number
Average Value
Number
Average Value
Number
Average Value
Number
Average Value
Number
Average Value
LOANS ORIGINATED
26
$93,865
127
$92,583
172
$104,176
41
$18,048
15
$76,907
APPLICATIONS APPROVED, NOT ACCEPTED
2
$104,940
21
$64,563
37
$104,963
12
$18,001
2
$108,005
APPLICATIONS DENIED
8
$90,580
67
$78,475
81
$83,882
26
$30,287
6
$53,875
APPLICATIONS WITHDRAWN
5
$91,308
21
$103,082
75
$86,405
0
$0
3
$51,067
FILES CLOSED FOR INCOMPLETENESS
0
$0
9
$68,940
21
$107,605
2
$7,660
0
$0
Aggregated Statistics For Year 2001 (Based on 2 partial tracts)
A) FHA, FSA/RHS & VA Home Purchase Loans
B) Conventional Home Purchase Loans
C) Refinancings
D) Home Improvement Loans
F) Non-occupant Loans on < 5 Family Dwellings (A B C & D)
Number
Average Value
Number
Average Value
Number
Average Value
Number
Average Value
Number
Average Value
LOANS ORIGINATED
32
$90,388
129
$93,440
142
$99,073
40
$25,125
15
$45,653
APPLICATIONS APPROVED, NOT ACCEPTED
2
$33,705
31
$53,324
29
$70,525
5
$76,906
2
$23,745
APPLICATIONS DENIED
0
$0
92
$43,296
70
$94,721
26
$17,677
3
$41,873
APPLICATIONS WITHDRAWN
2
$49,790
23
$81,929
35
$76,644
0
$0
3
$145,030
FILES CLOSED FOR INCOMPLETENESS
0
$0
2
$58,980
8
$81,196
0
$0
0
$0
Aggregated Statistics For Year 2000 (Based on 2 partial tracts)
A) FHA, FSA/RHS & VA Home Purchase Loans
B) Conventional Home Purchase Loans
C) Refinancings
D) Home Improvement Loans
F) Non-occupant Loans on < 5 Family Dwellings (A B C & D)
Number
Average Value
Number
Average Value
Number
Average Value
Number
Average Value
Number
Average Value
LOANS ORIGINATED
25
$83,280
153
$66,116
61
$87,098
43
$22,018
21
$59,091
APPLICATIONS APPROVED, NOT ACCEPTED
6
$51,322
14
$41,036
18
$68,770
9
$15,831
2
$43,660
APPLICATIONS DENIED
3
$76,600
92
$45,893
41
$76,114
21
$12,694
9
$23,831
APPLICATIONS WITHDRAWN
6
$92,687
17
$70,021
15
$66,693
5
$11,030
0
$0
FILES CLOSED FOR INCOMPLETENESS
0
$0
3
$42,897
6
$97,027
0
$0
2
$103,410
Aggregated Statistics For Year 1999 (Based on 1 partial tract)
A) FHA, FSA/RHS & VA Home Purchase Loans
B) Conventional Home Purchase Loans
C) Refinancings
D) Home Improvement Loans
F) Non-occupant Loans on < 5 Family Dwellings (A B C & D)
Detailed PMIC statistics for the following Tracts:1305.00
2002 - 2018 National Fire Incident Reporting System (NFIRS) incidents
According to the data from the years 2002 - 2018 the average number of fires per year is 76. The highest number of reported fires - 129 took place in 2006, and the least - 7 in 2002. The data has an increasing trend.
When looking into fire subcategories, the most reports belonged to: Outside Fires (54.5%), and Structure Fires (28.9%).
Fire incident types reported to NFIRS in Zip Code 76050


 Nearest zip codes: 76055, 76064, 76009, 76084, 76636, 76031.


 According to the data from the years 2002 - 2018 the average number of fires per year is 76. The highest number of reported fires - 129 took place in 2006, and the least - 7 in 2002. The data has an increasing trend.
 When looking into fire subcategories, the most reports belonged to: Outside Fires (54.5%), and Structure Fires (28.9%).