Estimated zip code population in 2022: 2,779 Zip code population in 2010: 2,507 Zip code population in 2000: 1,670
Houses and condos: 1,281 Renter-occupied apartments: 127
% of renters here:
13%
State:
38%
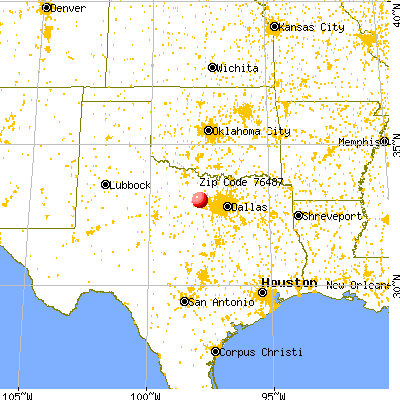
March 2022 cost of living index in zip code 76487: 85.9 (less than average, U.S. average is 100)
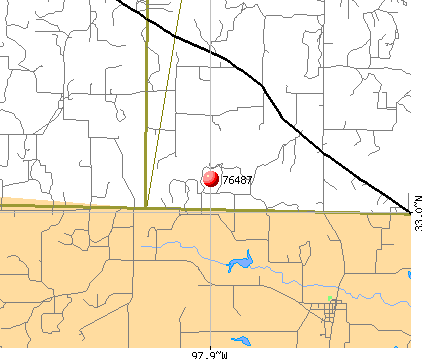
Land area: 89.4 sq. mi. Water area: 0.3 sq. mi.
Population density: 31 people per square mile
(very low).
OSM Map
General Map
Google Map
MSN Map
OSM Map
General Map
Google Map
MSN Map
OSM Map
General Map
Google Map
MSN Map
OSM Map
General Map
Google Map
MSN Map
Please wait while loading the map...
Real estate property taxes paid for housing units in 2022:
This zip code:
1.0% ($2,157)
Texas:
1.5% ($4,050)
Median real estate property taxes paid for housing units with mortgages in 2022: $4,340 (0.9%) Median real estate property taxes paid for housing units with no mortgage in 2022: $1,330 (1.0%)
Business Search- 14 Million verified businesses
Males: 1,495
(53.8%)
Females: 1,284
(46.2%)
For population 25 years and over in 76487:
High school or higher: 92.1%
Bachelor's degree or higher: 18.6%
Graduate or professional degree: 9.8%
Unemployed: 10.1%
Mean travel time to work (commute): 40.4 minutes
For population 15 years and over in 76487:
Never married: 18.0%
Now married: 62.3%
Separated: 0.0%
Widowed: 6.3%
Divorced: 13.5%
Zip code 76487 compared to state average:
Unemployed percentage above state average.
Black race population percentage significantly below state average.
Hispanic race population percentage significantly below state average.
Foreign-born population percentage significantly below state average.
Renting percentage significantly below state average.
Length of stay since moving in significantly above state average.
House age below state average.
Number of college students below state average.
Percentage of population with a bachelor's degree or higher below state average.
Averages for the 2020 tax year for zip code 76487, filed in 2021:
Average Adjusted Gross Income (AGI) in 2020: $74,048 (Individual Income Tax Returns)
Here:
$74,048
State:
$77,054
Salary/wage: $68,731 (reported on 78.8% of returns)
Here:
$68,731
State:
$62,766
(% of AGI for various income ranges: 1129.4% for AGIs below $25k, 3615.7% for AGIs $25k-50k, 6890.0% for AGIs $50k-75k, 9150.0% for AGIs $75k-100k, 16528.8% for AGIs $100k-200k, 57070.0% for AGIs over 200k)
Taxable interest for individuals: $1,447 (reported on 26.0% of returns)
This zip code:
$1,447
Texas:
$2,665
(% of AGI for various income ranges: 14.5% for AGIs below $25k, 51.7% for AGIs $25k-50k, 16.9% for AGIs $50k-75k, 75.8% for AGIs $75k-100k, 70.0% for AGIs $100k-200k, 496.7% for AGIs over 200k)
Ordinary dividends: $4,511 (reported on 12.3% of returns)
Here:
$4,511
State:
$10,044
(% of AGI for various income ranges: 34.2% for AGIs below $25k, 22.6% for AGIs $25k-50k, 51.2% for AGIs $50k-75k, 68.3% for AGIs $75k-100k, 49.4% for AGIs $100k-200k, 1353.3% for AGIs over 200k)
Net capital gain/loss in AGI: +$18,440 (reported on 13.7% of returns)
Here:
+$18,440
State:
+$39,590
(% of AGI for various income ranges: 4.2% for AGIs below $25k, 31.3% for AGIs $25k-50k, 81.9% for AGIs $50k-75k, 176.7% for AGIs $75k-100k, 622.9% for AGIs $100k-200k, 7336.7% for AGIs over 200k)
Profit/loss from business: +$16,426 (reported on 28.8% of returns)
Here:
+$16,426
State:
+$10,888
(% of AGI for various income ranges: 128.4% for AGIs below $25k, 479.1% for AGIs $25k-50k, 489.4% for AGIs $50k-75k, 627.5% for AGIs $75k-100k, 2272.4% for AGIs $100k-200k)
Taxable individual retirement arrangement distribution: $18,608 (reported on 8.9% of returns)
76487:
$18,608
Texas:
$24,740
(% of AGI for various income ranges: 80.0% for AGIs below $25k, 160.9% for AGIs $25k-50k, 430.8% for AGIs $75k-100k, 755.3% for AGIs $100k-200k)
Total itemized deductions: $35,767 (reported on 8.2% of returns)
Here:
$35,767
State:
$40,428
(% of AGI for various income ranges: 741.2% for AGIs $50k-75k, 925.3% for AGIs $100k-200k, 5110.0% for AGIs over 200k)
Charity contributions: $10,950 (reported on 6.8% of returns)
Here:
$10,950
State:
$18,201
(% of AGI for various income ranges: 47.8% for AGIs $25k-50k, 298.2% for AGIs $100k-200k, 1593.3% for AGIs over 200k)
Taxes paid: $7,542 (reported on 8.2% of returns)
76487:
$7,542
State:
$7,821
(% of AGI for various income ranges: 140.6% for AGIs $50k-75k, 216.5% for AGIs $100k-200k, 1040.0% for AGIs over 200k)
Earned income credit: $2,362 (reported on 14.4% of returns)
Here:
$2,362
State:
$2,584
(% of AGI for various income ranges: 94.8% for AGIs below $25k, 87.8% for AGIs $25k-50k)
Percentage of individuals using paid preparers for their 2020 taxes: 93.8%
Here:
94%
State:
92%
(% for various income ranges: 92.9% for AGIs below $25k, 93.5% for AGIs $25k-50k, 90.9% for AGIs $50k-75k, 100.0% for AGIs $75k-100k, 96.3% for AGIs $100k-200k, 87.5% for AGIs over 200k)
Averages for the 2012 tax year for zip code 76487, filed in 2013:
Average Adjusted Gross Income (AGI) in 2012: $61,197 (Individual Income Tax Returns)
Here:
$61,197
State:
$65,384
Salary/wage: $49,354 (reported on 79.8% of returns)
Here:
$49,354
State:
$52,524
(% of AGI for various income ranges: 73.8% for AGIs below $25k, 77.7% for AGIs $25k-50k, 77.5% for AGIs $50k-75k, 86.9% for AGIs $75k-100k, 98.9% for AGIs $100k-200k)
Taxable interest for individuals: $1,508 (reported on 24.2% of returns)
This zip code:
$1,508
Texas:
$2,372
(% of AGI for various income ranges: 1.0% for AGIs below $25k, 0.6% for AGIs $25k-50k, 0.3% for AGIs $50k-75k, 0.1% for AGIs $75k-100k, 1.6% for AGIs $100k-200k)
Ordinary dividends: $1,891 (reported on 11.1% of returns)
Here:
$1,891
State:
$9,721
(% of AGI for various income ranges: 0.6% for AGIs below $25k, 0.6% for AGIs $50k-75k, 0.8% for AGIs $100k-200k)
Net capital gain/loss in AGI: +$8,111 (reported on 9.1% of returns)
Here:
+$8,111
State:
+$35,319
(% of AGI for various income ranges: 1.2% for AGIs $50k-75k, 4.4% for AGIs $100k-200k)
Profit/loss from business: +$18,800 (reported on 24.2% of returns)
Here:
+$18,800
State:
+$13,732
(% of AGI for various income ranges: 15.8% for AGIs below $25k, 4.6% for AGIs $25k-50k, 7.4% for AGIs $50k-75k, 3.0% for AGIs $75k-100k, 17.1% for AGIs $100k-200k)
Taxable individual retirement arrangement distribution: $12,550 (reported on 8.1% of returns)
76487:
$12,550
Texas:
$19,511
(% of AGI for various income ranges: 6.2% for AGIs $25k-50k, 5.9% for AGIs $75k-100k)
Total itemized deductions: $21,542 (18% of AGI, reported on 26.3% of returns)
Here:
$21,542
State:
$24,724
Here:
17.8% of AGI
State:
15.9% of AGI
(% of AGI for various income ranges: 11.0% for AGIs below $25k, 8.1% for AGIs $25k-50k, 12.0% for AGIs $50k-75k, 10.3% for AGIs $75k-100k, 16.5% for AGIs $100k-200k)
Charity contributions: $3,956 (reported on 16.2% of returns)
Here:
$3,956
State:
$6,808
(% of AGI for various income ranges: 1.2% for AGIs $25k-50k, 1.1% for AGIs $50k-75k, 1.4% for AGIs $75k-100k, 2.1% for AGIs $100k-200k)
Taxes paid: $4,285 (reported on 26.3% of returns)
76487:
$4,285
State:
$6,921
(% of AGI for various income ranges: 1.5% for AGIs below $25k, 1.3% for AGIs $25k-50k, 2.3% for AGIs $50k-75k, 2.0% for AGIs $75k-100k, 3.8% for AGIs $100k-200k)
Earned income credit: $2,140 (reported on 20.2% of returns)
Here:
$2,140
State:
$2,570
(% of AGI for various income ranges: 6.6% for AGIs below $25k, 1.6% for AGIs $25k-50k)
Percentage of individuals using paid preparers for their 2012 taxes: 59.6%
Here:
60%
State:
51%
(% for various income ranges: 54.1% for AGIs below $25k, 54.5% for AGIs $25k-50k, 70.6% for AGIs $50k-75k, 60.0% for AGIs $75k-100k, 81.8% for AGIs $100k-200k)
Averages for the 2004 tax year for zip code 76487, filed in 2005:
Average Adjusted Gross Income (AGI) in 2004: $38,973 (Individual Income Tax Returns)
Here:
$38,973
State:
$47,881
Salary/wage: $37,693 (reported on 80.6% of returns)
Here:
$37,693
State:
$41,947
(% of AGI for various income ranges: 79.8% for AGIs $10k-25k, 82.7% for AGIs $25k-50k, 91.5% for AGIs $50k-75k, 87.0% for AGIs $75k-100k, 45.2% for AGIs over 100k)
Taxable interest for individuals: $1,343 (reported on 32.9% of returns)
This zip code:
$1,343
Texas:
$2,255
(% of AGI for various income ranges: 2.1% for AGIs $10k-25k, 0.8% for AGIs $25k-50k, 0.4% for AGIs $50k-75k, 0.3% for AGIs $75k-100k, 1.4% for AGIs over 100k)
Taxable dividends: $1,722 (reported on 13.1% of returns)
Here:
$1,722
State:
$4,261
(% of AGI for various income ranges: 0.4% for AGIs $10k-25k, 1.0% for AGIs $25k-50k, 0.1% for AGIs $50k-75k, 0.0% for AGIs $75k-100k, 0.8% for AGIs over 100k)
Net capital gain/loss: +$16,543 (reported on 12.7% of returns)
Here:
+$16,543
State:
+$16,110
(% of AGI for various income ranges: 1.2% for AGIs $10k-25k, 0.6% for AGIs $25k-50k, 0.3% for AGIs $50k-75k, 0.1% for AGIs $75k-100k, 17.4% for AGIs over 100k)
Profit/loss from business: +$6,807 (reported on 25.1% of returns)
Here:
+$6,807
State:
+$11,013
(% of AGI for various income ranges: 10.8% for AGIs $10k-25k, 4.2% for AGIs $25k-50k, 0.3% for AGIs $50k-75k, 3.6% for AGIs $75k-100k, 4.5% for AGIs over 100k)
Total itemized deductions: $16,175 (21% of AGI, reported on 21.5% of returns)
Here:
$16,175
State:
$19,631
Here:
20.8% of AGI
State:
18.9% of AGI
(% of AGI for various income ranges: 8.9% for AGIs $10k-25k, 7.8% for AGIs $25k-50k, 10.4% for AGIs $50k-75k, 12.6% for AGIs $75k-100k, 6.3% for AGIs over 100k)
Charity contributions deductions: $2,652 (3% of AGI, reported on 14.0% of returns)
Here:
$2,652
State:
$4,753
Here:
3.4% of AGI
State:
4.2% of AGI
(% of AGI for various income ranges: 0.9% for AGIs $10k-25k, 0.6% for AGIs $25k-50k, 1.2% for AGIs $50k-75k, 1.1% for AGIs $75k-100k, 0.9% for AGIs over 100k)
Total tax: $5,834 (reported on 73.1% of returns)
76487:
$5,834
State:
$9,058
(% of AGI for various income ranges: 4.6% for AGIs $10k-25k, 6.4% for AGIs $25k-50k, 7.6% for AGIs $50k-75k, 10.8% for AGIs $75k-100k, 18.7% for AGIs over 100k)
Earned income credit: $1,964 (reported on 20.4% of returns)
Here:
$1,964
State:
$2,024
Percentage of individuals using paid preparers for their 2004 taxes: 62.5%
Here:
62%
State:
57%
(% for various income ranges: 55.4% for AGIs below $10k, 63.4% for AGIs $10k-25k, 62.9% for AGIs $25k-50k, 62.0% for AGIs $50k-75k, 67.3% for AGIs $75k-100k, 82.9% for AGIs over 100k)
Household received Food Stamps/SNAP in the past 12 months: 83 Household did not receive Food Stamps/SNAP in the past 12 months: 922
Women who had a birth in the past 12 months: 79 (0 now married, 76 unmarried) Women who did not have a birth in the past 12 months: 539 (357 now married, 178 unmarried)
Housing units in zip code 76487 with a mortgage: 317 Median monthly owner costs for units with a mortgage: $1,956 Median monthly owner costs for units without a mortgage: $468
Residents with income below the poverty level in 2022:
This zip code:
10.4%
Whole state:
14.0%
Residents with income below 50% of the poverty level in 2022:
This zip code:
5.8%
Whole state:
7.4%
Median number of rooms in houses and condos:
Here:
6.1
State:
6.3
Median number of rooms in apartments:
Here:
5.9
State:
4.0
Notable locations in this zip code not listed on our city pages
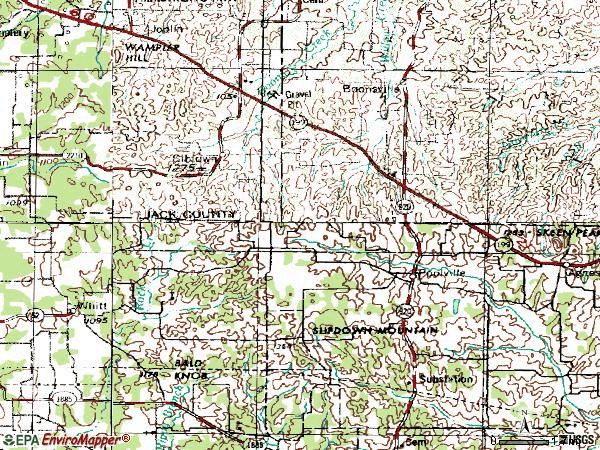
Notable locations in zip code 76487: Hood County Public Library (A), Poolville Volunteer Fire Department (B), Boonsville Balsora Volunteer Fire Department (C). Display/hide their locations on the map
Churches in zip code 76487 include: Poolville Church of Christ (A), Poolville United Methodist Church (B), Lone Star Church (C). Display/hide their locations on the map
Reservoirs: Reservoir Number Nine (A), Reservoir Number Seven (B), Reservoir Number Six (C), Reservoir Number Four (D), Reservoir Number Three (E), Reservoir Number Two (F), Reservoir Number Eleven (G), Reservoir Number One (H). Display/hide their locations on the map
Streams, rivers, and creeks: Turkey Creek (A), Rock Hole Hollow Branch (B), Oxford Water Branch (C), Dyer Creek (D), Elm Pool Creek (E), North Fork Willow Creek (F), Cottonwood Creek (G), Barton Branch (H). Display/hide their locations on the map
Size of family households: 296 2-persons, 180 3-persons, 92 4-persons, 88 5-persons, 49 6-persons, 13 7-or-more-persons
Size of nonfamily households: 275 1-person, 10 2-persons
534 married couples with children.
0 single-parent households ().
99.5% of residents of 76487 zip code speak English at home.
0.4% of residents speak Spanish at home (18% very well, 82% well).
Foreign born population: 2 (0.1%) (100.0% of them are naturalized citizens)
This zip code:
0.1%
Whole state:
17.2%
100%Barbados
25%American
11%Irish
7%English
5%French
4%German
3%Scotch-Irish
1%Eastern European
Year of entry for the foreign-born population
132010 or later
02000 to 2009
01990 to 1999
29Before 1990
Housing units lacking complete plumbing facilities: 8.2% Housing units lacking complete kitchen facilities: 8.1%
66.3%Electricity
26.2%Bottled, tank, or LP gas
5.9%Utility gas
1.2%Wood
0.7%Other fuel
Population in 1990: 1,549. Population change in the 1990s: +121 (+7.8%).
Place of birth for U.S.-born residents:
This state: 2,114
Northeast: 6
Midwest: 126
South: 268
West: 207
49% of the 76487 zip code residents lived in the same house 5 years ago. Out of people who lived in different houses, 32% lived in this county. Out of people who lived in different counties, 50% lived in Texas.
96% of the 76487 zip code residents lived in the same house 1 year ago. Out of people who lived in different houses, 79% moved from this county. Out of people who lived in different houses, 21% moved from different state.
Private vs. public school enrollment:
Students in private schools in grades 1 to 8 (elementary and middle school): 8
Here:
3.0%
Texas:
8.8%
Students in private schools in grades 9 to 12 (high school): 19
Here:
15.9%
Texas:
8.0%
Students in private undergraduate colleges:
Here:
0.0%
Texas:
16.2%
Occupation by median earnings in the past 12 months ($)
95,867Installation, maintenance, and repair occupations
72,374Construction and extraction occupations
70,459Transportation occupations
62,984Office and administrative support occupations
62,496Health technologists and technicians
61,370Management occupations
Top industries in this zip code by the number of employees in 2005:
Utilities: Other Electric Power Generation (20-49 employees: 1 establishment)
Accommodation and Food Services: Full-Service Restaurants (5-9: 1)
Construction: Commercial and Institutional Building Construction (5-9: 1)
Construction: New Single-Family Housing Construction (except Operative Builders) (1-4: 2)
Other Services (except Public Administration): Religious Organizations (1-4: 1)
Wholesale Trade: Sporting and Recreational Goods and Supplies Merchant Wholesalers (1-4: 1)
Real Estate and Rental and Leasing: Residential Property Managers (1-4: 1)
Fatal accident statistics in 2014:
Fatal accident count: 1
Vehicles involved in fatal accidents: 2
Fatal accidents caused by drunken drivers: 0
Fatalities: 1
Persons involved in fatal accidents: 2
Pedestrians involved in fatal accidents: 0
Home Mortgage Disclosure Act Aggregated Statistics For Year 2009 (Based on 6 partial tracts)
A) FHA, FSA/RHS & VA Home Purchase Loans
B) Conventional Home Purchase Loans
C) Refinancings
D) Home Improvement Loans
F) Non-occupant Loans on < 5 Family Dwellings (A B C & D)
G) Loans On Manufactured Home Dwelling (A B C & D)
Number
Average Value
Number
Average Value
Number
Average Value
Number
Average Value
Number
Average Value
Number
Average Value
LOANS ORIGINATED
27
$147,086
31
$156,865
71
$175,106
7
$63,200
12
$146,642
9
$81,096
APPLICATIONS APPROVED, NOT ACCEPTED
2
$160,540
2
$167,050
9
$173,176
1
$8,240
0
$0
1
$115,390
APPLICATIONS DENIED
7
$132,614
7
$83,069
46
$179,547
12
$40,435
3
$121,873
7
$53,410
APPLICATIONS WITHDRAWN
2
$116,130
6
$200,352
20
$160,396
1
$141,330
1
$166,520
2
$98,240
FILES CLOSED FOR INCOMPLETENESS
1
$125,750
1
$213,300
7
$114,516
1
$95,520
0
$0
1
$64,740
Aggregated Statistics For Year 2008 (Based on 6 partial tracts)
A) FHA, FSA/RHS & VA Home Purchase Loans
B) Conventional Home Purchase Loans
C) Refinancings
D) Home Improvement Loans
F) Non-occupant Loans on < 5 Family Dwellings (A B C & D)
G) Loans On Manufactured Home Dwelling (A B C & D)
Number
Average Value
Number
Average Value
Number
Average Value
Number
Average Value
Number
Average Value
Number
Average Value
LOANS ORIGINATED
30
$151,100
64
$175,889
62
$155,794
20
$66,612
22
$134,145
15
$72,235
APPLICATIONS APPROVED, NOT ACCEPTED
2
$255,810
9
$110,042
9
$187,636
2
$39,415
1
$44,270
6
$54,603
APPLICATIONS DENIED
7
$146,317
18
$110,076
41
$151,957
27
$39,646
5
$107,780
12
$61,702
APPLICATIONS WITHDRAWN
2
$149,020
4
$140,382
16
$143,418
2
$63,520
3
$134,957
2
$108,555
FILES CLOSED FOR INCOMPLETENESS
1
$149,830
2
$133,955
3
$157,783
0
$0
0
$0
0
$0
Aggregated Statistics For Year 2007 (Based on 6 partial tracts)
A) FHA, FSA/RHS & VA Home Purchase Loans
B) Conventional Home Purchase Loans
C) Refinancings
D) Home Improvement Loans
F) Non-occupant Loans on < 5 Family Dwellings (A B C & D)
G) Loans On Manufactured Home Dwelling (A B C & D)
Number
Average Value
Number
Average Value
Number
Average Value
Number
Average Value
Number
Average Value
Number
Average Value
LOANS ORIGINATED
20
$130,754
97
$138,411
61
$165,475
26
$54,330
16
$130,035
15
$82,512
APPLICATIONS APPROVED, NOT ACCEPTED
2
$86,145
11
$102,145
11
$146,130
5
$55,334
0
$0
5
$60,002
APPLICATIONS DENIED
6
$101,363
31
$131,865
59
$136,098
22
$31,744
8
$121,289
16
$62,014
APPLICATIONS WITHDRAWN
1
$179,370
10
$147,450
25
$128,211
4
$82,095
1
$110,160
4
$65,712
FILES CLOSED FOR INCOMPLETENESS
1
$125,610
4
$123,280
10
$188,780
2
$54,015
0
$0
1
$121,540
Aggregated Statistics For Year 2006 (Based on 6 partial tracts)
A) FHA, FSA/RHS & VA Home Purchase Loans
B) Conventional Home Purchase Loans
C) Refinancings
D) Home Improvement Loans
F) Non-occupant Loans on < 5 Family Dwellings (A B C & D)
G) Loans On Manufactured Home Dwelling (A B C & D)
Number
Average Value
Number
Average Value
Number
Average Value
Number
Average Value
Number
Average Value
Number
Average Value
LOANS ORIGINATED
17
$120,219
123
$119,477
68
$147,682
20
$35,482
24
$109,428
19
$71,667
APPLICATIONS APPROVED, NOT ACCEPTED
0
$0
16
$92,239
12
$176,588
2
$40,935
4
$104,725
3
$53,057
APPLICATIONS DENIED
4
$96,192
41
$104,535
59
$119,827
25
$37,406
12
$127,197
22
$54,663
APPLICATIONS WITHDRAWN
2
$159,600
14
$93,661
44
$129,775
1
$125,580
3
$120,427
2
$119,495
FILES CLOSED FOR INCOMPLETENESS
0
$0
2
$200,450
15
$123,570
1
$40,450
2
$158,810
1
$69,630
Aggregated Statistics For Year 2005 (Based on 6 partial tracts)
A) FHA, FSA/RHS & VA Home Purchase Loans
B) Conventional Home Purchase Loans
C) Refinancings
D) Home Improvement Loans
F) Non-occupant Loans on < 5 Family Dwellings (A B C & D)
G) Loans On Manufactured Home Dwelling (A B C & D)
Number
Average Value
Number
Average Value
Number
Average Value
Number
Average Value
Number
Average Value
Number
Average Value
LOANS ORIGINATED
14
$119,321
99
$118,752
89
$136,422
19
$76,439
28
$123,650
16
$85,086
APPLICATIONS APPROVED, NOT ACCEPTED
1
$78,610
15
$76,658
14
$140,406
3
$69,087
3
$65,977
5
$56,696
APPLICATIONS DENIED
4
$77,855
45
$95,308
69
$131,982
23
$51,783
12
$87,952
25
$68,617
APPLICATIONS WITHDRAWN
0
$0
10
$112,961
61
$146,780
10
$174,758
2
$67,615
2
$142,555
FILES CLOSED FOR INCOMPLETENESS
0
$0
4
$79,710
19
$133,863
1
$11,850
1
$304,630
2
$67,170
Aggregated Statistics For Year 2004 (Based on 6 partial tracts)
A) FHA, FSA/RHS & VA Home Purchase Loans
B) Conventional Home Purchase Loans
C) Refinancings
D) Home Improvement Loans
F) Non-occupant Loans on < 5 Family Dwellings (A B C & D)
G) Loans On Manufactured Home Dwelling (A B C & D)
Number
Average Value
Number
Average Value
Number
Average Value
Number
Average Value
Number
Average Value
Number
Average Value
LOANS ORIGINATED
15
$102,303
69
$115,120
98
$132,413
19
$41,804
16
$151,542
21
$71,417
APPLICATIONS APPROVED, NOT ACCEPTED
1
$86,070
12
$98,292
18
$123,074
4
$15,438
1
$164,630
4
$50,338
APPLICATIONS DENIED
3
$79,280
29
$80,640
69
$102,561
18
$56,661
6
$62,805
18
$63,121
APPLICATIONS WITHDRAWN
2
$108,065
10
$90,709
53
$115,572
2
$75,620
1
$48,170
4
$66,095
FILES CLOSED FOR INCOMPLETENESS
0
$0
1
$176,390
20
$116,664
1
$154,590
0
$0
0
$0
Aggregated Statistics For Year 2003 (Based on 2 partial tracts)
A) FHA, FSA/RHS & VA Home Purchase Loans
B) Conventional Home Purchase Loans
C) Refinancings
D) Home Improvement Loans
F) Non-occupant Loans on < 5 Family Dwellings (A B C & D)
Number
Average Value
Number
Average Value
Number
Average Value
Number
Average Value
Number
Average Value
LOANS ORIGINATED
7
$109,144
40
$126,494
92
$129,221
10
$38,431
8
$79,252
APPLICATIONS APPROVED, NOT ACCEPTED
1
$90,680
7
$83,237
17
$120,845
2
$39,495
2
$108,210
APPLICATIONS DENIED
2
$87,310
33
$71,366
56
$111,472
10
$28,159
5
$171,362
APPLICATIONS WITHDRAWN
1
$55,260
4
$137,252
29
$110,413
0
$0
0
$0
FILES CLOSED FOR INCOMPLETENESS
0
$0
1
$154,430
4
$142,300
0
$0
0
$0
Aggregated Statistics For Year 2002 (Based on 2 partial tracts)
A) FHA, FSA/RHS & VA Home Purchase Loans
B) Conventional Home Purchase Loans
C) Refinancings
D) Home Improvement Loans
F) Non-occupant Loans on < 5 Family Dwellings (A B C & D)
Number
Average Value
Number
Average Value
Number
Average Value
Number
Average Value
Number
Average Value
LOANS ORIGINATED
10
$106,968
45
$114,493
69
$110,978
13
$62,421
7
$115,469
APPLICATIONS APPROVED, NOT ACCEPTED
0
$0
10
$65,031
13
$89,912
1
$38,610
1
$63,050
APPLICATIONS DENIED
1
$81,470
18
$72,867
29
$86,071
7
$22,416
2
$57,560
APPLICATIONS WITHDRAWN
2
$108,740
4
$87,842
26
$84,586
1
$56,670
1
$36,480
FILES CLOSED FOR INCOMPLETENESS
1
$43,210
4
$113,432
4
$116,442
1
$14,170
0
$0
Aggregated Statistics For Year 2001 (Based on 2 partial tracts)
A) FHA, FSA/RHS & VA Home Purchase Loans
B) Conventional Home Purchase Loans
C) Refinancings
D) Home Improvement Loans
F) Non-occupant Loans on < 5 Family Dwellings (A B C & D)
Number
Average Value
Number
Average Value
Number
Average Value
Number
Average Value
Number
Average Value
LOANS ORIGINATED
11
$90,225
48
$84,986
49
$112,064
14
$31,878
6
$51,358
APPLICATIONS APPROVED, NOT ACCEPTED
2
$75,445
18
$85,933
11
$92,929
3
$27,510
2
$71,905
APPLICATIONS DENIED
2
$108,210
36
$57,272
34
$73,861
7
$20,089
3
$51,240
APPLICATIONS WITHDRAWN
3
$95,870
4
$85,362
21
$77,080
2
$33,650
1
$25,150
FILES CLOSED FOR INCOMPLETENESS
0
$0
2
$90,850
4
$95,192
0
$0
0
$0
Aggregated Statistics For Year 2000 (Based on 2 partial tracts)
A) FHA, FSA/RHS & VA Home Purchase Loans
B) Conventional Home Purchase Loans
C) Refinancings
D) Home Improvement Loans
F) Non-occupant Loans on < 5 Family Dwellings (A B C & D)
Number
Average Value
Number
Average Value
Number
Average Value
Number
Average Value
Number
Average Value
LOANS ORIGINATED
17
$59,631
49
$92,887
27
$84,667
11
$34,969
6
$102,305
APPLICATIONS APPROVED, NOT ACCEPTED
3
$52,187
15
$63,874
7
$58,341
5
$17,710
1
$22,310
APPLICATIONS DENIED
2
$54,725
44
$49,813
16
$92,844
14
$15,964
3
$66,470
APPLICATIONS WITHDRAWN
2
$68,715
3
$177,337
9
$63,244
1
$9,560
0
$0
FILES CLOSED FOR INCOMPLETENESS
0
$0
2
$54,195
8
$89,524
0
$0
0
$0
Aggregated Statistics For Year 1999 (Based on 1 partial tract)
A) FHA, FSA/RHS & VA Home Purchase Loans
B) Conventional Home Purchase Loans
C) Refinancings
D) Home Improvement Loans
F) Non-occupant Loans on < 5 Family Dwellings (A B C & D)
Detailed PMIC statistics for the following Tracts:1405.00
, 1504.02
2002 - 2018 National Fire Incident Reporting System (NFIRS) incidents
According to the data from the years 2002 - 2018 the average number of fires per year is 39. The highest number of fire incidents - 88 took place in 2011, and the least - 5 in 2016. The data has a growing trend.
When looking into fire subcategories, the most reports belonged to: Outside Fires (63.3%), and Structure Fires (28.8%).
Fire incident types reported to NFIRS in Zip Code 76487


 Nearest zip codes: 76490, 76088, 76486, 76082, 76426, 76073.


 According to the data from the years 2002 - 2018 the average number of fires per year is 39. The highest number of fire incidents - 88 took place in 2011, and the least - 5 in 2016. The data has a growing trend.
 When looking into fire subcategories, the most reports belonged to: Outside Fires (63.3%), and Structure Fires (28.8%).