Estimated zip code population in 2022: 7,134 Zip code population in 2010: 5,327 Zip code population in 2000: 4,132
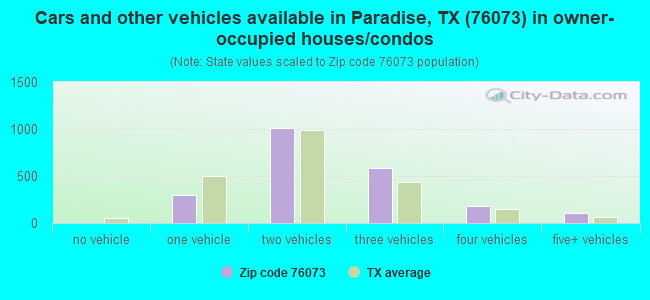
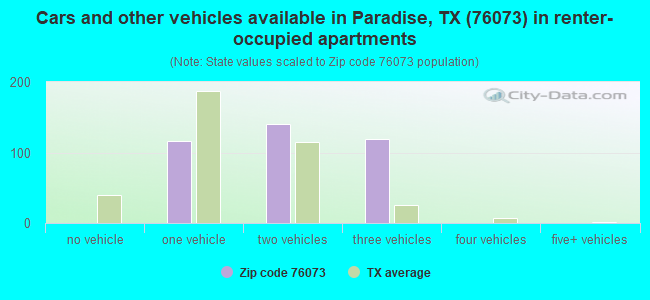
Houses and condos: 2,727 Renter-occupied apartments: 383
% of renters here:
15%
State:
38%
March 2022 cost of living index in zip code 76073: 80.3 (low, U.S. average is 100)
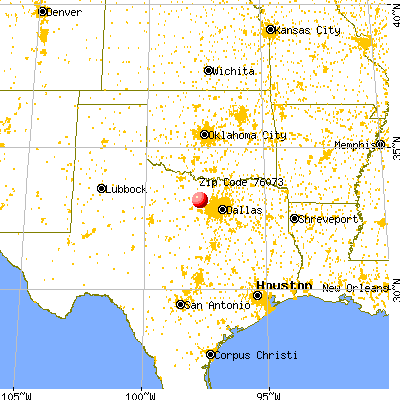
Land area: 84.2 sq. mi. Water area: 0.2 sq. mi.
Population density: 85 people per square mile
(very low).
OSM Map
General Map
Google Map
MSN Map
OSM Map
General Map
Google Map
MSN Map
OSM Map
General Map
Google Map
MSN Map
OSM Map
General Map
Google Map
MSN Map
Please wait while loading the map...
Real estate property taxes paid for housing units in 2022:
This zip code:
1.0% ($3,214)
Texas:
1.5% ($4,050)
Median real estate property taxes paid for housing units with mortgages in 2022: $4,239 (1.0%) Median real estate property taxes paid for housing units with no mortgage in 2022: $2,500 (1.3%)
Averages for the 2020 tax year for zip code 76073, filed in 2021:
Average Adjusted Gross Income (AGI) in 2020: $74,723 (Individual Income Tax Returns)
Here:
$74,723
State:
$77,054
Salary/wage: $69,461 (reported on 83.0% of returns)
Here:
$69,461
State:
$62,766
(% of AGI for various income ranges: 1126.9% for AGIs below $25k, 3302.3% for AGIs $25k-50k, 6642.6% for AGIs $50k-75k, 9410.0% for AGIs $75k-100k, 17723.5% for AGIs $100k-200k, 52640.0% for AGIs over 200k)
Taxable interest for individuals: $867 (reported on 26.6% of returns)
This zip code:
$867
Texas:
$2,665
(% of AGI for various income ranges: 14.3% for AGIs below $25k, 15.2% for AGIs $25k-50k, 21.2% for AGIs $50k-75k, 25.4% for AGIs $75k-100k, 64.9% for AGIs $100k-200k, 220.0% for AGIs over 200k)
Ordinary dividends: $4,986 (reported on 13.5% of returns)
Here:
$4,986
State:
$10,044
(% of AGI for various income ranges: 17.1% for AGIs below $25k, 19.2% for AGIs $25k-50k, 38.5% for AGIs $50k-75k, 58.9% for AGIs $75k-100k, 123.7% for AGIs $100k-200k, 1771.7% for AGIs over 200k)
Net capital gain/loss in AGI: +$9,221 (reported on 13.8% of returns)
Here:
+$9,221
State:
+$39,590
(% of AGI for various income ranges: 9.2% for AGIs below $25k, 19.6% for AGIs $25k-50k, 59.1% for AGIs $50k-75k, 62.1% for AGIs $75k-100k, 387.2% for AGIs $100k-200k, 2951.7% for AGIs over 200k)
Profit/loss from business: +$8,878 (reported on 21.5% of returns)
Here:
+$8,878
State:
+$10,888
(% of AGI for various income ranges: 101.4% for AGIs below $25k, 243.3% for AGIs $25k-50k, 82.4% for AGIs $50k-75k, 326.4% for AGIs $75k-100k, 349.3% for AGIs $100k-200k, 2375.0% for AGIs over 200k)
Taxable individual retirement arrangement distribution: $25,632 (reported on 8.0% of returns)
76073:
$25,632
Texas:
$24,740
(% of AGI for various income ranges: 30.5% for AGIs below $25k, 85.6% for AGIs $25k-50k, 231.2% for AGIs $50k-75k, 284.3% for AGIs $75k-100k, 420.7% for AGIs $100k-200k, 4013.3% for AGIs over 200k)
Total itemized deductions: $43,524 (reported on 8.0% of returns)
Here:
$43,524
State:
$40,428
(% of AGI for various income ranges: 163.1% for AGIs $25k-50k, 206.5% for AGIs $50k-75k, 320.0% for AGIs $75k-100k, 895.1% for AGIs $100k-200k, 7751.7% for AGIs over 200k)
Charity contributions: $11,150 (reported on 6.4% of returns)
Here:
$11,150
State:
$18,201
(% of AGI for various income ranges: 61.9% for AGIs $25k-50k, 62.9% for AGIs $75k-100k, 260.2% for AGIs $100k-200k, 1063.3% for AGIs over 200k)
Taxes paid: $6,584 (reported on 8.0% of returns)
76073:
$6,584
State:
$7,821
(% of AGI for various income ranges: 18.9% for AGIs below $25k, 39.7% for AGIs $50k-75k, 67.9% for AGIs $75k-100k, 180.0% for AGIs $100k-200k, 706.7% for AGIs over 200k)
Earned income credit: $2,108 (reported on 12.5% of returns)
Here:
$2,108
State:
$2,584
(% of AGI for various income ranges: 74.9% for AGIs below $25k, 69.8% for AGIs $25k-50k)
Percentage of individuals using paid preparers for their 2020 taxes: 92.9%
Here:
93%
State:
92%
(% for various income ranges: 92.0% for AGIs below $25k, 93.1% for AGIs $25k-50k, 93.3% for AGIs $50k-75k, 94.7% for AGIs $75k-100k, 94.1% for AGIs $100k-200k, 86.7% for AGIs over 200k)
Averages for the 2012 tax year for zip code 76073, filed in 2013:
Average Adjusted Gross Income (AGI) in 2012: $58,711 (Individual Income Tax Returns)
Here:
$58,711
State:
$65,384
Salary/wage: $53,744 (reported on 83.7% of returns)
Here:
$53,744
State:
$52,524
(% of AGI for various income ranges: 74.0% for AGIs below $25k, 78.9% for AGIs $25k-50k, 85.6% for AGIs $50k-75k, 82.1% for AGIs $75k-100k, 81.8% for AGIs $100k-200k, 46.3% for AGIs over 200k)
Taxable interest for individuals: $829 (reported on 30.8% of returns)
This zip code:
$829
Texas:
$2,372
(% of AGI for various income ranges: 1.5% for AGIs below $25k, 0.4% for AGIs $25k-50k, 0.4% for AGIs $50k-75k, 0.3% for AGIs $75k-100k, 0.5% for AGIs $100k-200k, 0.2% for AGIs over 200k)
Ordinary dividends: $2,226 (reported on 11.9% of returns)
Here:
$2,226
State:
$9,721
(% of AGI for various income ranges: 0.8% for AGIs below $25k, 0.3% for AGIs $25k-50k, 0.4% for AGIs $50k-75k, 0.3% for AGIs $100k-200k, 1.3% for AGIs over 200k)
Net capital gain/loss in AGI: +$2,852 (reported on 9.3% of returns)
Here:
+$2,852
State:
+$35,319
(% of AGI for various income ranges: 0.4% for AGIs $50k-75k, 1.3% for AGIs $100k-200k)
Profit/loss from business: +$12,727 (reported on 19.4% of returns)
Here:
+$12,727
State:
+$13,732
(% of AGI for various income ranges: 7.5% for AGIs below $25k, 3.4% for AGIs $25k-50k, 2.3% for AGIs $50k-75k, 4.3% for AGIs $75k-100k, 6.7% for AGIs $100k-200k)
Taxable individual retirement arrangement distribution: $14,747 (reported on 8.4% of returns)
76073:
$14,747
Texas:
$19,511
(% of AGI for various income ranges: 2.8% for AGIs below $25k, 3.4% for AGIs $25k-50k, 1.5% for AGIs $50k-75k, 1.8% for AGIs $75k-100k, 2.8% for AGIs $100k-200k)
Total itemized deductions: $25,216 (25% of AGI, reported on 29.5% of returns)
Here:
$25,216
State:
$24,724
Here:
25.1% of AGI
State:
15.9% of AGI
(% of AGI for various income ranges: 10.5% for AGIs below $25k, 8.8% for AGIs $25k-50k, 10.3% for AGIs $50k-75k, 12.2% for AGIs $75k-100k, 11.8% for AGIs $100k-200k, 23.0% for AGIs over 200k)
Charity contributions: $5,600 (reported on 22.5% of returns)
Here:
$5,600
State:
$6,808
(% of AGI for various income ranges: 1.3% for AGIs below $25k, 1.5% for AGIs $25k-50k, 1.6% for AGIs $50k-75k, 2.3% for AGIs $75k-100k, 2.7% for AGIs $100k-200k, 2.4% for AGIs over 200k)
Taxes paid: $4,686 (reported on 28.6% of returns)
76073:
$4,686
State:
$6,921
(% of AGI for various income ranges: 1.5% for AGIs below $25k, 1.8% for AGIs $25k-50k, 2.1% for AGIs $50k-75k, 2.6% for AGIs $75k-100k, 2.8% for AGIs $100k-200k, 1.9% for AGIs over 200k)
Earned income credit: $2,297 (reported on 13.7% of returns)
Here:
$2,297
State:
$2,570
(% of AGI for various income ranges: 5.5% for AGIs below $25k, 1.2% for AGIs $25k-50k)
Percentage of individuals using paid preparers for their 2012 taxes: 58.6%
Here:
59%
State:
51%
(% for various income ranges: 50.0% for AGIs below $25k, 56.0% for AGIs $25k-50k, 63.9% for AGIs $50k-75k, 66.7% for AGIs $75k-100k, 67.7% for AGIs $100k-200k, 80.0% for AGIs over 200k)
Averages for the 2004 tax year for zip code 76073, filed in 2005:
Average Adjusted Gross Income (AGI) in 2004: $46,281 (Individual Income Tax Returns)
Here:
$46,281
State:
$47,881
Salary/wage: $41,041 (reported on 85.1% of returns)
Here:
$41,041
State:
$41,947
(% of AGI for various income ranges: 111.7% for AGIs below $10k, 76.1% for AGIs $10k-25k, 85.9% for AGIs $25k-50k, 86.5% for AGIs $50k-75k, 88.2% for AGIs $75k-100k, 48.6% for AGIs over 100k)
Taxable interest for individuals: $1,175 (reported on 35.3% of returns)
This zip code:
$1,175
Texas:
$2,255
(% of AGI for various income ranges: 2.9% for AGIs below $10k, 1.7% for AGIs $10k-25k, 1.0% for AGIs $25k-50k, 0.7% for AGIs $50k-75k, 0.4% for AGIs $75k-100k, 1.0% for AGIs over 100k)
Taxable dividends: $1,361 (reported on 14.0% of returns)
Here:
$1,361
State:
$4,261
(% of AGI for various income ranges: 1.1% for AGIs below $10k, 0.5% for AGIs $10k-25k, 0.5% for AGIs $25k-50k, 0.2% for AGIs $50k-75k, 0.2% for AGIs $75k-100k, 0.6% for AGIs over 100k)
Net capital gain/loss: +$3,838 (reported on 13.0% of returns)
Here:
+$3,838
State:
+$16,110
(% of AGI for various income ranges: 0.2% for AGIs below $10k, -0.2% for AGIs $10k-25k, 0.7% for AGIs $25k-50k, 1.3% for AGIs $50k-75k, 0.2% for AGIs $75k-100k, 2.1% for AGIs over 100k)
Profit/loss from business: +$7,235 (reported on 22.8% of returns)
Here:
+$7,235
State:
+$11,013
(% of AGI for various income ranges: 9.0% for AGIs below $10k, 8.8% for AGIs $10k-25k, 4.3% for AGIs $25k-50k, 3.3% for AGIs $50k-75k, 2.7% for AGIs $75k-100k, 2.1% for AGIs over 100k)
IRA payment deduction: $3,205 (reported on 2.0% of returns)
76073:
$3,205
Texas:
$3,120
Total itemized deductions: $16,085 (20% of AGI, reported on 28.3% of returns)
Here:
$16,085
State:
$19,631
Here:
20.0% of AGI
State:
18.9% of AGI
(% of AGI for various income ranges: 12.9% for AGIs below $10k, 11.3% for AGIs $10k-25k, 9.3% for AGIs $25k-50k, 11.2% for AGIs $50k-75k, 12.1% for AGIs $75k-100k, 7.1% for AGIs over 100k)
Charity contributions deductions: $3,847 (4% of AGI, reported on 21.0% of returns)
Here:
$3,847
State:
$4,753
Here:
4.4% of AGI
State:
4.2% of AGI
(% of AGI for various income ranges: 1.3% for AGIs $10k-25k, 1.1% for AGIs $25k-50k, 1.9% for AGIs $50k-75k, 2.1% for AGIs $75k-100k, 2.1% for AGIs over 100k)
Total tax: $7,275 (reported on 75.5% of returns)
76073:
$7,275
State:
$9,058
(% of AGI for various income ranges: 3.9% for AGIs below $10k, 4.2% for AGIs $10k-25k, 6.5% for AGIs $25k-50k, 8.5% for AGIs $50k-75k, 10.5% for AGIs $75k-100k, 22.0% for AGIs over 100k)
Earned income credit: $1,808 (reported on 15.5% of returns)
Here:
$1,808
State:
$2,024
Percentage of individuals using paid preparers for their 2004 taxes: 60.9%
Here:
61%
State:
57%
(% for various income ranges: 51.4% for AGIs below $10k, 59.5% for AGIs $10k-25k, 64.2% for AGIs $25k-50k, 65.6% for AGIs $50k-75k, 62.5% for AGIs $75k-100k, 66.7% for AGIs over 100k)
Household received Food Stamps/SNAP in the past 12 months: 135 Household did not receive Food Stamps/SNAP in the past 12 months: 2,438
Women who had a birth in the past 12 months: 85 (85 now married, 1 unmarried) Women who did not have a birth in the past 12 months: 1,455 (790 now married, 659 unmarried)
Housing units in zip code 76073 with a mortgage: 1,125 (34 second mortgage, 19 both second mortgage and home equity loan) Houses without a mortgage: 13
Median monthly owner costs for units with a mortgage: $1,944 Median monthly owner costs for units without a mortgage: $581
Residents with income below the poverty level in 2022:
This zip code:
4.8%
Whole state:
14.0%
Residents with income below 50% of the poverty level in 2022:
This zip code:
2.3%
Whole state:
7.4%
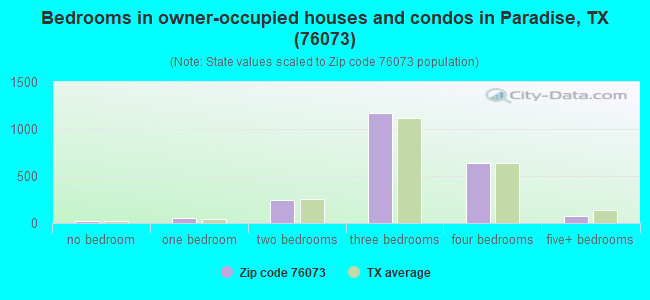
Median number of rooms in houses and condos:
Here:
6.2
State:
6.3
Median number of rooms in apartments:
Here:
4.2
State:
4.0
Notable locations in this zip code not listed on our city pages
Notable locations in zip code 76073: Paradise Volunteer Fire Department (A), Cottondale Volunteer Fire Department (B). Display/hide their locations on the map
Reservoirs: Soil Conservation Service Site 8 Reservoir (A), Soil Conservation Service Site 7 Reservoir (B), Soil Conservation Service Site 22 Reservoir (C), Soil Conservation Service Site 21 Reservoir (D), Soil Conservation Service Site 14 Reservoir (E), Soil Conservation Service Site 15 Reservoir (F), Soil Conservation Service Site 9 Reservoir (G), Soil Conservation Service Site 8b Reservoir (H). Display/hide their locations on the map
1,369 married couples with children.
25 single-parent households (7 men, 18 women).
91.6% of residents of 76073 zip code speak English at home.
8.2% of residents speak Spanish at home (60% very well, 22% well, 12% not well, 6% not at all).
0.1% of residents speak Asian or Pacific Island language at home (100% very well).
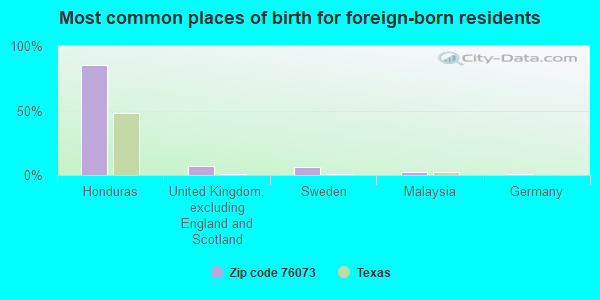
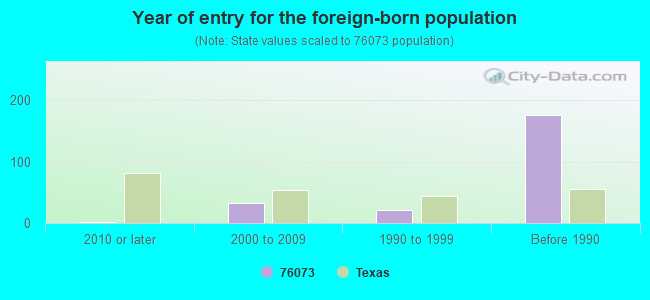
Foreign born population: 202 (2.8%) (45.2% of them are naturalized citizens)
This zip code:
2.8%
Whole state:
17.2%
86%Honduras
7%United Kingdom, excluding England and Scotland
6%Sweden
2%Malaysia
1%Germany
33%English
13%American
11%German
10%Irish
2%Polish
1%European
1%Scottish
Year of entry for the foreign-born population
22010 or later
332000 to 2009
221990 to 1999
176Before 1990
Housing units lacking complete plumbing facilities: 2.0% Housing units lacking complete kitchen facilities: 0.5%
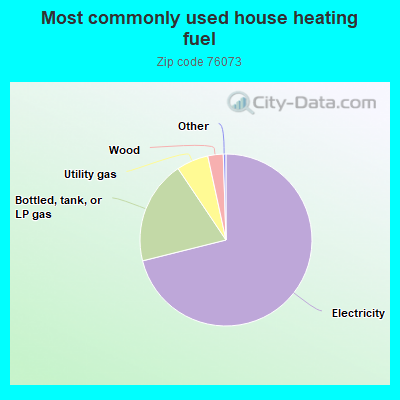
71.1%Electricity
19.5%Bottled, tank, or LP gas
6.0%Utility gas
2.9%Wood
Population in 1990: 3,009. Population change in the 1990s: +1,123 (+37.3%).
Place of birth for U.S.-born residents:
This state: 4,741
Northeast: 59
Midwest: 512
South: 1,018
West: 535
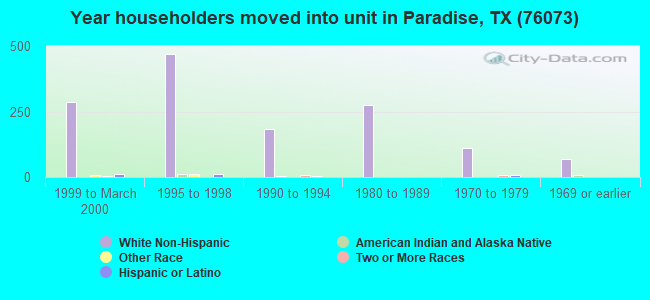
50% of the 76073 zip code residents lived in the same house 5 years ago. Out of people who lived in different houses, 36% lived in this county. Out of people who lived in different counties, 50% lived in Texas.
91% of the 76073 zip code residents lived in the same house 1 year ago. Out of people who lived in different houses, 33% moved from this county. Out of people who lived in different houses, 42% moved from different county within same state. Out of people who lived in different houses, 29% moved from different state.
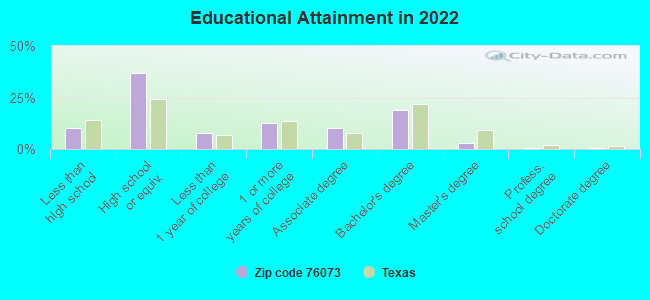
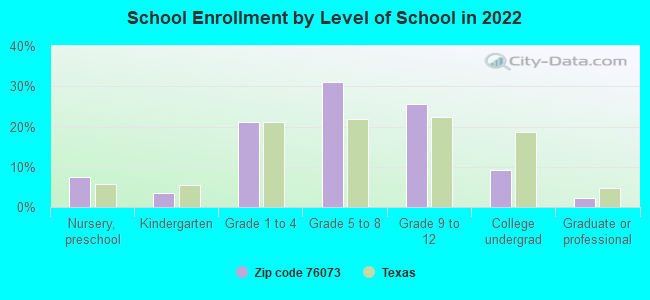
Private vs. public school enrollment:
Students in private schools in grades 1 to 8 (elementary and middle school): 102
Here:
14.6%
Texas:
8.8%
Students in private schools in grades 9 to 12 (high school): 48
Here:
14.3%
Texas:
8.0%
Students in private undergraduate colleges: 24
Here:
19.9%
Texas:
16.2%
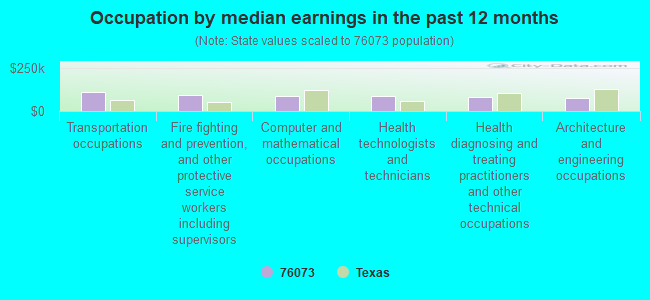
Occupation by median earnings in the past 12 months ($)
112,495Transportation occupations
90,042Fire fighting and prevention, and other protective service workers including supervisors
86,285Computer and mathematical occupations
85,127Health technologists and technicians
82,335Health diagnosing and treating practitioners and other technical occupations
75,207Architecture and engineering occupations
Top industries in this zip code by the number of employees in 2005:
Mining: Support Activities for Oil and Gas Operations (100-249 employees: 1 establishment, 1-4 employees: 1 establishment)
Accommodation and Food Services: Hotels (except Casino Hotels) and Motels (50-99: 1)
Construction: Other Foundation, Structure, and Building Exterior Contractors (10-19: 2, 1-4: 2)
Other Services (except Public Administration): Religious Organizations (10-19: 1, 1-4: 1)
Wholesale Trade: Metal Service Centers and Other Metal Merchant Wholesalers (10-19: 1)
Mining: Industrial Sand Mining (10-19: 1)
Construction: Plumbing, Heating, and Air-Conditioning Contractors (5-9: 1, 1-4: 2)
Information: Cellular and Other Wireless Telecommunications (5-9: 1, 1-4: 1)
Fatal accident statistics in 2013:
Fatal accident count: 1
Vehicles involved in fatal accidents: 2
Fatal accidents caused by drunken drivers: 0
Fatalities: 1
Persons involved in fatal accidents: 2
Pedestrians involved in fatal accidents: 0
Fatal accident statistics in 2012:
Fatal accident count: 1
Vehicles involved in fatal accidents: 2
Fatal accidents caused by drunken drivers: 0
Fatalities: 1
Persons involved in fatal accidents: 2
Pedestrians involved in fatal accidents: 0
Home Mortgage Disclosure Act Aggregated Statistics For Year 2009 (Based on 6 partial tracts)
A) FHA, FSA/RHS & VA Home Purchase Loans
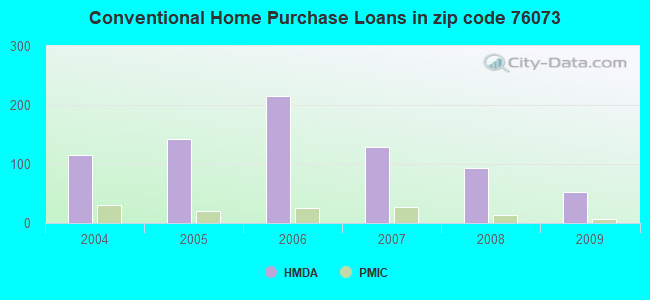
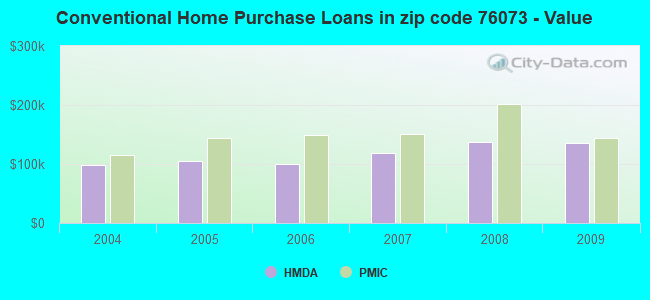
B) Conventional Home Purchase Loans
C) Refinancings
D) Home Improvement Loans
F) Non-occupant Loans on < 5 Family Dwellings (A B C & D)
G) Loans On Manufactured Home Dwelling (A B C & D)
Number
Average Value
Number
Average Value
Number
Average Value
Number
Average Value
Number
Average Value
Number
Average Value
LOANS ORIGINATED
40
$171,351
53
$134,933
133
$163,745
15
$35,930
22
$116,890
17
$80,191
APPLICATIONS APPROVED, NOT ACCEPTED
3
$128,807
5
$97,830
19
$196,771
2
$159,195
4
$133,292
3
$68,073
APPLICATIONS DENIED
9
$176,176
16
$110,141
50
$141,096
16
$44,316
2
$42,315
13
$61,167
APPLICATIONS WITHDRAWN
5
$178,184
11
$148,935
28
$152,600
15
$117,570
1
$95,320
7
$69,964
FILES CLOSED FOR INCOMPLETENESS
1
$134,210
3
$210,707
16
$98,606
7
$105,730
2
$104,610
3
$46,553
Aggregated Statistics For Year 2008 (Based on 6 partial tracts)
A) FHA, FSA/RHS & VA Home Purchase Loans
B) Conventional Home Purchase Loans
C) Refinancings
D) Home Improvement Loans
F) Non-occupant Loans on < 5 Family Dwellings (A B C & D)
G) Loans On Manufactured Home Dwelling (A B C & D)
Number
Average Value
Number
Average Value
Number
Average Value
Number
Average Value
Number
Average Value
Number
Average Value
LOANS ORIGINATED
37
$147,075
94
$137,315
92
$145,147
31
$61,604
21
$124,544
36
$55,548
APPLICATIONS APPROVED, NOT ACCEPTED
2
$174,355
24
$111,895
9
$103,826
5
$61,392
0
$0
15
$74,767
APPLICATIONS DENIED
4
$90,128
25
$103,603
62
$113,435
36
$29,123
7
$97,753
17
$55,488
APPLICATIONS WITHDRAWN
3
$108,410
17
$104,762
27
$114,967
3
$62,867
1
$39,030
7
$60,251
FILES CLOSED FOR INCOMPLETENESS
2
$168,900
3
$156,730
6
$99,108
1
$27,700
0
$0
2
$76,605
Aggregated Statistics For Year 2007 (Based on 6 partial tracts)
A) FHA, FSA/RHS & VA Home Purchase Loans
B) Conventional Home Purchase Loans
C) Refinancings
D) Home Improvement Loans
F) Non-occupant Loans on < 5 Family Dwellings (A B C & D)
G) Loans On Manufactured Home Dwelling (A B C & D)
Number
Average Value
Number
Average Value
Number
Average Value
Number
Average Value
Number
Average Value
Number
Average Value
LOANS ORIGINATED
28
$132,956
128
$118,944
108
$142,452
40
$32,504
25
$121,470
47
$90,013
APPLICATIONS APPROVED, NOT ACCEPTED
1
$83,550
15
$87,657
24
$123,761
12
$70,483
1
$103,040
7
$51,383
APPLICATIONS DENIED
5
$106,960
39
$106,758
123
$126,876
40
$45,010
4
$146,918
26
$52,853
APPLICATIONS WITHDRAWN
5
$133,120
15
$124,695
60
$117,768
7
$16,481
2
$95,095
6
$73,917
FILES CLOSED FOR INCOMPLETENESS
1
$68,820
5
$75,122
20
$199,916
2
$33,215
0
$0
1
$36,660
Aggregated Statistics For Year 2006 (Based on 6 partial tracts)
A) FHA, FSA/RHS & VA Home Purchase Loans
B) Conventional Home Purchase Loans
C) Refinancings
D) Home Improvement Loans
F) Non-occupant Loans on < 5 Family Dwellings (A B C & D)
G) Loans On Manufactured Home Dwelling (A B C & D)
Number
Average Value
Number
Average Value
Number
Average Value
Number
Average Value
Number
Average Value
Number
Average Value
LOANS ORIGINATED
22
$99,493
216
$100,079
117
$129,924
29
$47,055
30
$87,402
44
$66,585
APPLICATIONS APPROVED, NOT ACCEPTED
1
$91,630
22
$81,220
14
$143,085
9
$40,178
5
$84,682
14
$40,718
APPLICATIONS DENIED
9
$116,780
72
$78,933
91
$121,846
33
$26,643
8
$111,710
56
$41,706
APPLICATIONS WITHDRAWN
3
$121,190
18
$114,560
52
$118,224
7
$68,829
0
$0
5
$61,612
FILES CLOSED FOR INCOMPLETENESS
0
$0
1
$201,330
34
$154,066
0
$0
1
$127,370
1
$79,790
Aggregated Statistics For Year 2005 (Based on 6 partial tracts)
A) FHA, FSA/RHS & VA Home Purchase Loans
B) Conventional Home Purchase Loans
C) Refinancings
D) Home Improvement Loans
F) Non-occupant Loans on < 5 Family Dwellings (A B C & D)
G) Loans On Manufactured Home Dwelling (A B C & D)
Number
Average Value
Number
Average Value
Number
Average Value
Number
Average Value
Number
Average Value
Number
Average Value
LOANS ORIGINATED
25
$103,496
143
$104,301
134
$115,053
24
$47,458
28
$91,110
38
$84,595
APPLICATIONS APPROVED, NOT ACCEPTED
5
$80,074
28
$78,698
17
$119,578
6
$28,515
2
$89,575
6
$54,915
APPLICATIONS DENIED
9
$155,472
75
$93,284
142
$126,914
36
$47,908
7
$55,516
65
$70,024
APPLICATIONS WITHDRAWN
6
$88,110
20
$117,084
89
$145,491
10
$142,173
2
$87,485
4
$69,780
FILES CLOSED FOR INCOMPLETENESS
0
$0
5
$109,142
29
$141,446
2
$101,240
1
$279,200
1
$51,780
Aggregated Statistics For Year 2004 (Based on 6 partial tracts)
A) FHA, FSA/RHS & VA Home Purchase Loans
B) Conventional Home Purchase Loans
C) Refinancings
D) Home Improvement Loans
E) Loans on Dwellings For 5+ Families
F) Non-occupant Loans on < 5 Family Dwellings (A B C & D)
G) Loans On Manufactured Home Dwelling (A B C & D)
2002 - 2018 National Fire Incident Reporting System (NFIRS) incidents
According to the data from the years 2002 - 2018 the average number of fires per year is 63. The highest number of reported fires - 133 took place in 2005, and the least - 21 in 2013. The data has an increasing trend.
When looking into fire subcategories, the most reports belonged to: Outside Fires (70.7%), and Structure Fires (20.7%).
Fire incident types reported to NFIRS in Zip Code 76073


 Nearest zip codes: 76082, 76023, 76426, 76487, 76085, 76431.


 According to the data from the years 2002 - 2018 the average number of fires per year is 63. The highest number of reported fires - 133 took place in 2005, and the least - 21 in 2013. The data has an increasing trend.
 When looking into fire subcategories, the most reports belonged to: Outside Fires (70.7%), and Structure Fires (20.7%).