Estimated zip code population in 2022: 2,454 Zip code population in 2010: 3,317 Zip code population in 2000: 3,324
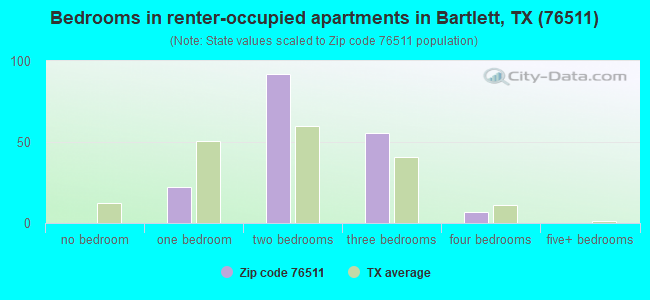
Houses and condos: 1,088 Renter-occupied apartments: 179
% of renters here:
19%
State:
38%
March 2022 cost of living index in zip code 76511: 83.7 (less than average, U.S. average is 100)
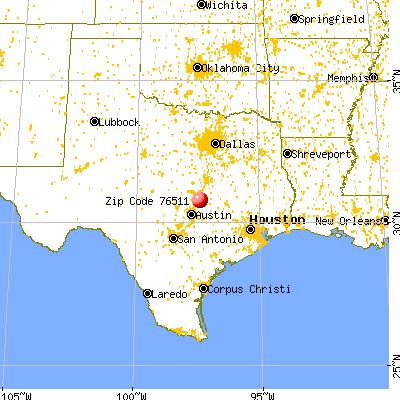
Land area: 78.4 sq. mi. Water area: 0.4 sq. mi.
Population density: 31 people per square mile
(very low).
OSM Map
General Map
Google Map
MSN Map
OSM Map
General Map
Google Map
MSN Map
OSM Map
General Map
Google Map
MSN Map
OSM Map
General Map
Google Map
MSN Map
Please wait while loading the map...
Real estate property taxes paid for housing units in 2022:
This zip code:
1.2% ($2,050)
Texas:
1.5% ($4,050)
Median real estate property taxes paid for housing units with mortgages in 2022: $2,132 (1.1%) Median real estate property taxes paid for housing units with no mortgage in 2022: $1,777 (1.3%)
Business Search- 14 Million verified businesses
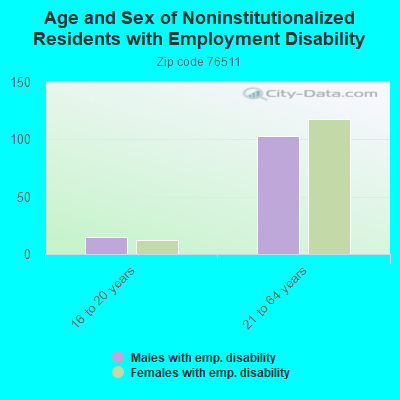
Males: 1,317
(53.7%)
Females: 1,136
(46.3%)
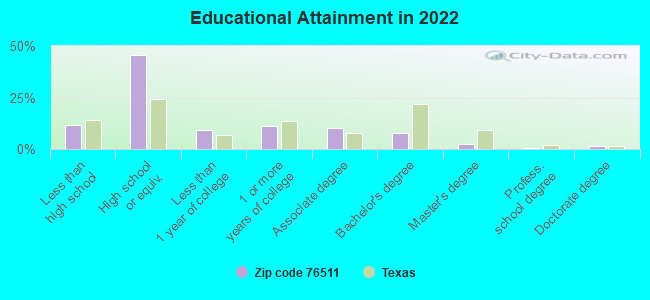
For population 25 years and over in 76511:
High school or higher: 87.0%
Bachelor's degree or higher: 12.0%
Graduate or professional degree: 4.5%
Unemployed: 0.9%
Mean travel time to work (commute): 27.5 minutes
For population 15 years and over in 76511:
Never married: 25.0%
Now married: 55.9%
Separated: 1.3%
Widowed: 8.7%
Divorced: 9.2%
Zip code 76511 compared to state average:
Median house value below state average.
Unemployed percentage significantly below state average.
Black race population percentage below state average.
Median age above state average.
Foreign-born population percentage significantly below state average.
Renting percentage below state average.
Length of stay since moving in significantly above state average.
House age above state average.
Number of college students below state average.
Percentage of population with a bachelor's degree or higher significantly below state average.
Averages for the 2020 tax year for zip code 76511, filed in 2021:
Average Adjusted Gross Income (AGI) in 2020: $53,196 (Individual Income Tax Returns)
Here:
$53,196
State:
$77,054
Salary/wage: $47,441 (reported on 80.4% of returns)
Here:
$47,441
State:
$62,766
(% of AGI for various income ranges: 1248.6% for AGIs below $25k, 3875.6% for AGIs $25k-50k, 6345.5% for AGIs $50k-75k, 10771.7% for AGIs $75k-100k, 18604.3% for AGIs $100k-200k)
Taxable interest for individuals: $695 (reported on 20.6% of returns)
This zip code:
$695
Texas:
$2,665
(% of AGI for various income ranges: 3.6% for AGIs below $25k, 6.0% for AGIs $25k-50k, 37.3% for AGIs $50k-75k, 33.3% for AGIs $75k-100k, 88.6% for AGIs $100k-200k)
Ordinary dividends: $1,745 (reported on 10.8% of returns)
Here:
$1,745
State:
$10,044
(% of AGI for various income ranges: 26.8% for AGIs below $25k, 62.7% for AGIs $50k-75k, 91.4% for AGIs $100k-200k)
Net capital gain/loss in AGI: +$10,783 (reported on 11.8% of returns)
Here:
+$10,783
State:
+$39,590
(% of AGI for various income ranges: 23.2% for AGIs below $25k, 96.4% for AGIs $50k-75k, 1624.3% for AGIs $100k-200k)
Profit/loss from business: +$10,683 (reported on 17.6% of returns)
Here:
+$10,683
State:
+$10,888
(% of AGI for various income ranges: 309.1% for AGIs below $25k, 202.0% for AGIs $25k-50k, 848.3% for AGIs $75k-100k, 327.1% for AGIs $100k-200k)
Taxable individual retirement arrangement distribution: $13,557 (reported on 6.9% of returns)
76511:
$13,557
Texas:
$24,740
(% of AGI for various income ranges: 196.4% for AGIs $25k-50k, 763.3% for AGIs $75k-100k)
Earned income credit: $2,810 (reported on 19.6% of returns)
Here:
$2,810
State:
$2,584
(% of AGI for various income ranges: 172.7% for AGIs below $25k, 72.8% for AGIs $25k-50k)
Percentage of individuals using paid preparers for their 2020 taxes: 87.3%
Here:
87%
State:
92%
(% for various income ranges: 87.5% for AGIs below $25k, 87.5% for AGIs $25k-50k, 86.7% for AGIs $50k-75k, 90.0% for AGIs $75k-100k, 100.0% for AGIs $100k-200k, 0.0% for AGIs over 200k)
Averages for the 2012 tax year for zip code 76511, filed in 2013:
Average Adjusted Gross Income (AGI) in 2012: $39,233 (Individual Income Tax Returns)
Here:
$39,233
State:
$65,384
Salary/wage: $35,700 (reported on 82.6% of returns)
Here:
$35,700
State:
$52,524
(% of AGI for various income ranges: 87.6% for AGIs below $25k, 83.0% for AGIs $25k-50k, 78.7% for AGIs $50k-75k, 72.7% for AGIs $75k-100k, 58.3% for AGIs $100k-200k)
Taxable interest for individuals: $1,100 (reported on 21.7% of returns)
This zip code:
$1,100
Texas:
$2,372
(% of AGI for various income ranges: 0.6% for AGIs below $25k, 1.1% for AGIs $25k-50k, 0.4% for AGIs $50k-75k, 0.7% for AGIs $75k-100k, 0.3% for AGIs $100k-200k)
Ordinary dividends: $2,256 (reported on 9.8% of returns)
Here:
$2,256
State:
$9,721
(% of AGI for various income ranges: 0.4% for AGIs below $25k, 0.6% for AGIs $25k-50k, 1.1% for AGIs $50k-75k, 0.6% for AGIs $100k-200k)
Net capital gain/loss in AGI: +$743 (reported on 7.6% of returns)
Here:
+$743
State:
+$35,319
Profit/loss from business: +$8,487 (reported on 16.3% of returns)
Here:
+$8,487
State:
+$13,732
(% of AGI for various income ranges: 10.4% for AGIs below $25k, 3.0% for AGIs $25k-50k, 2.9% for AGIs $50k-75k, 4.1% for AGIs $75k-100k)
Taxable individual retirement arrangement distribution: $9,800 (reported on 7.6% of returns)
76511:
$9,800
Texas:
$19,511
Total itemized deductions: $16,145 (24% of AGI, reported on 12.0% of returns)
Here:
$16,145
State:
$24,724
Here:
23.8% of AGI
State:
15.9% of AGI
(% of AGI for various income ranges: 7.0% for AGIs $25k-50k, 9.9% for AGIs $50k-75k, 5.3% for AGIs $100k-200k)
Charity contributions: $5,271 (reported on 7.6% of returns)
Here:
$5,271
State:
$6,808
(% of AGI for various income ranges: 1.3% for AGIs below $25k, 2.8% for AGIs $50k-75k, 1.2% for AGIs $100k-200k)
Taxes paid: $3,440 (reported on 10.9% of returns)
76511:
$3,440
State:
$6,921
(% of AGI for various income ranges: 0.8% for AGIs $25k-50k, 2.2% for AGIs $50k-75k, 1.3% for AGIs $100k-200k)
Earned income credit: $2,500 (reported on 27.2% of returns)
Here:
$2,500
State:
$2,570
(% of AGI for various income ranges: 8.7% for AGIs below $25k, 1.7% for AGIs $25k-50k)
Percentage of individuals using paid preparers for their 2012 taxes: 57.6%
Here:
58%
State:
51%
(% for various income ranges: 57.1% for AGIs below $25k, 53.8% for AGIs $25k-50k, 63.6% for AGIs $50k-75k, 57.1% for AGIs $75k-100k, 66.7% for AGIs $100k-200k)
Averages for the 2004 tax year for zip code 76511, filed in 2005:
Average Adjusted Gross Income (AGI) in 2004: $30,104 (Individual Income Tax Returns)
Here:
$30,104
State:
$47,881
Salary/wage: $29,595 (reported on 84.8% of returns)
Here:
$29,595
State:
$41,947
(% of AGI for various income ranges: 107.1% for AGIs below $10k, 85.1% for AGIs $10k-25k, 86.5% for AGIs $25k-50k, 84.7% for AGIs $50k-75k, 77.5% for AGIs $75k-100k, 67.2% for AGIs over 100k)
Taxable interest for individuals: $1,220 (reported on 31.0% of returns)
This zip code:
$1,220
Texas:
$2,255
(% of AGI for various income ranges: 10.0% for AGIs below $10k, 1.6% for AGIs $10k-25k, 1.3% for AGIs $25k-50k, 0.6% for AGIs $50k-75k, 1.0% for AGIs $75k-100k, 0.3% for AGIs over 100k)
Taxable dividends: $930 (reported on 11.0% of returns)
Here:
$930
State:
$4,261
(% of AGI for various income ranges: 1.5% for AGIs below $10k, 0.3% for AGIs $10k-25k, 0.5% for AGIs $25k-50k, 0.1% for AGIs $50k-75k, 0.3% for AGIs $75k-100k)
Net capital gain/loss: +$1,694 (reported on 11.9% of returns)
Here:
+$1,694
State:
+$16,110
(% of AGI for various income ranges: 0.4% for AGIs below $10k, 1.4% for AGIs $10k-25k, 0.3% for AGIs $25k-50k, 0.9% for AGIs $50k-75k, 0.6% for AGIs $75k-100k)
Profit/loss from business: +$3,336 (reported on 12.7% of returns)
Here:
+$3,336
State:
+$11,013
(% of AGI for various income ranges: -12.8% for AGIs below $10k, 4.2% for AGIs $10k-25k, 2.0% for AGIs $25k-50k, 1.6% for AGIs $50k-75k, 0.0% for AGIs $75k-100k)
Total itemized deductions: $15,530 (27% of AGI, reported on 9.1% of returns)
Here:
$15,530
State:
$19,631
Here:
26.7% of AGI
State:
18.9% of AGI
(% of AGI for various income ranges: 3.1% for AGIs $10k-25k, 4.0% for AGIs $25k-50k, 5.2% for AGIs $50k-75k, 9.7% for AGIs $75k-100k)
Charity contributions deductions: $3,536 (6% of AGI, reported on 6.2% of returns)
Here:
$3,536
State:
$4,753
Here:
5.7% of AGI
State:
4.2% of AGI
Total tax: $3,699 (reported on 63.5% of returns)
76511:
$3,699
State:
$9,058
(% of AGI for various income ranges: 2.9% for AGIs below $10k, 3.2% for AGIs $10k-25k, 6.0% for AGIs $25k-50k, 9.0% for AGIs $50k-75k, 11.7% for AGIs $75k-100k, 15.5% for AGIs over 100k)
Earned income credit: $2,010 (reported on 22.0% of returns)
Here:
$2,010
State:
$2,024
Percentage of individuals using paid preparers for their 2004 taxes: 59.8%
Here:
60%
State:
57%
(% for various income ranges: 47.9% for AGIs below $10k, 64.9% for AGIs $10k-25k, 63.9% for AGIs $25k-50k, 62.8% for AGIs $50k-75k, 72.2% for AGIs $75k-100k)
Household received Food Stamps/SNAP in the past 12 months: 72 Household did not receive Food Stamps/SNAP in the past 12 months: 871
Women who had a birth in the past 12 months: 15 (11 now married, 3 unmarried) Women who did not have a birth in the past 12 months: 404 (197 now married, 206 unmarried)
Housing units in zip code 76511 with a mortgage: 346 (12 second mortgage, 11 both second mortgage and home equity loan) Median monthly owner costs for units with a mortgage: $1,254 Median monthly owner costs for units without a mortgage: $568
Residents with income below the poverty level in 2022:
This zip code:
9.3%
Whole state:
14.0%
Residents with income below 50% of the poverty level in 2022:
This zip code:
7.3%
Whole state:
7.4%
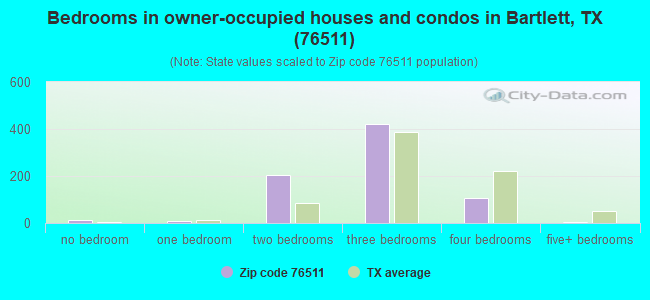
Median number of rooms in houses and condos:
Here:
5.5
State:
6.3
Median number of rooms in apartments:
Here:
4.5
State:
4.0
Notable locations in this zip code not listed on our city pages
Cemeteries: Davilla Cemetery (1), Jackson Cemetery (2), Science Hill Cemetery (3), Bartlett Cemetery (4), Stockton Cemetery (5), Server Cemetery (6). Display/hide their locations on the map
Reservoirs: Soil Conservation Service Site 7 Reservoir (A), Soil Conservation Service Site 8 Reservoir (B), Soil Conservation Service Site 5 Reservoir (C). Display/hide their locations on the map
In group quarters: 77 (-1 institutionalized population)
Size of family households: 306 2-persons, 191 3-persons, 130 4-persons, 46 5-persons, 22 6-persons, 5 7-or-more-persons
Size of nonfamily households: 203 1-person, 36 2-persons, 2 3-persons
265 married couples with children.
247 single-parent households (102 men, 145 women).
78.4% of residents of 76511 zip code speak English at home.
20.5% of residents speak Spanish at home (72% very well, 17% well, 5% not well, 6% not at all).
0.9% of residents speak other Indo-European language at home (100% very well).
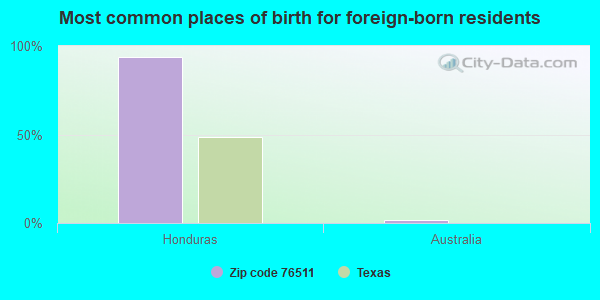
Foreign born population: 175 (7.1%) (48.5% of them are naturalized citizens)
This zip code:
7.1%
Whole state:
17.2%
94%Honduras
2%Australia
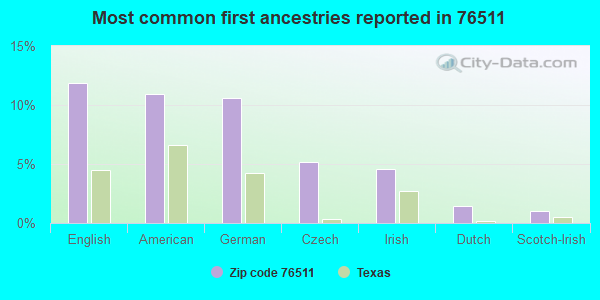
12%English
11%American
11%German
5%Czech
5%Irish
1%Dutch
1%Scotch-Irish
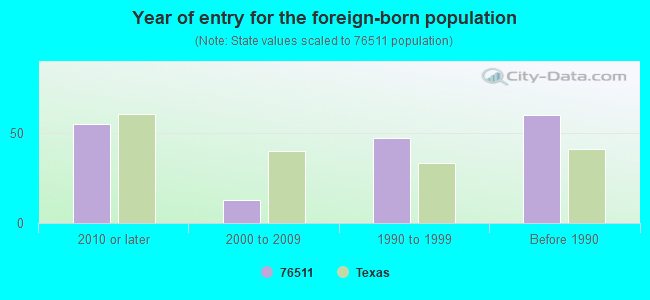
Year of entry for the foreign-born population
552010 or later
132000 to 2009
471990 to 1999
60Before 1990
Facilities with environmental interests located in this zip code:
BARTLETT EL (404 N ROBINSON in BARTLETT, TX)
(National Center for Education Statistics) - STATE ID-014902101 Organizations: BARTLETT ISD (SCHOOL DISTRICT)
BARTLETT H S (404 N ROBINSON in BARTLETT, TX)
(National Center for Education Statistics) - STATE ID-014902001 Organizations: BARTLETT ISD (SCHOOL DISTRICT)
BARTLETT MIDDLE (404 N ROBINSON in BARTLETT, TX)
(National Center for Education Statistics) - STATE ID-014902041 Organizations: BARTLETT ISD (SCHOOL DISTRICT)
BARTLETT ELECTRIC COOPERATIVE (104 E PIETZSCH in BARTLETT, TX)
(Resource Conservation and Recovery Act (tracking hazardous waste)) Business NAICS classification: ELECTRIC POWER DISTRIBUTION. Alternative names: DOWELL SCHLUMBERGER INC
BARTLETT FORD (142 N EVIE in BARTLETT, TX)
(Resource Conservation and Recovery Act (tracking hazardous waste))
BARTLETT ISD (404 NORTH ROBINSON in BARTLETT, TX)
COMPLIANCE ACTIVITY (Tracking inspections of insecticide, fungicide, and rodenticide, and toxic substances)
BARTLETT MUNICIPAL LIGHT (140 W. CLARK ST. in BARTLETT, TX)
COMPLIANCE ACTIVITY (Tracking inspections of insecticide, fungicide, and rodenticide, and toxic substances) Business SIC classification: ELECTRIC SERVICES Alternative names: BARTLETT (MUNICIPAL), CITY OF
Housing units lacking complete plumbing facilities: 3.0% Housing units lacking complete kitchen facilities: 4.7%
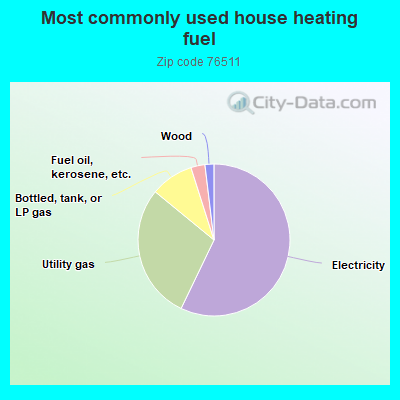
57.3%Electricity
28.9%Utility gas
9.2%Bottled, tank, or LP gas
3.0%Fuel oil, kerosene, etc.
1.9%Wood
Population in 1990: 727. Population change in the 1990s: +2,597 (+357.2%).
Place of birth for U.S.-born residents:
This state: 1,924
Northeast: 49
Midwest: 62
South: 114
West: 107
66% of the 76511 zip code residents lived in the same house 5 years ago. Out of people who lived in different houses, 36% lived in this county. Out of people who lived in different counties, 50% lived in Texas.
88% of the 76511 zip code residents lived in the same house 1 year ago. Out of people who lived in different houses, 63% moved from this county. Out of people who lived in different houses, 6% moved from different county within same state. Out of people who lived in different houses, 29% moved from different state.
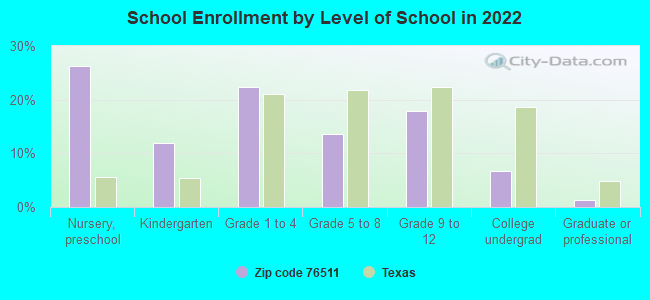
Private vs. public school enrollment:
Students in private schools in grades 1 to 8 (elementary and middle school): 18
Here:
9.9%
Texas:
8.8%
Students in private schools in grades 9 to 12 (high school):
Here:
0.0%
Texas:
8.0%
Students in private undergraduate colleges: 21
Here:
60.2%
Texas:
16.2%
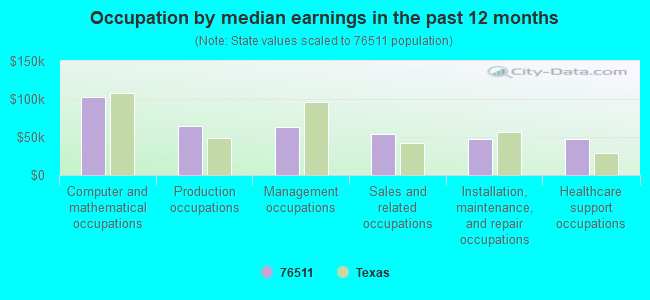
Occupation by median earnings in the past 12 months ($)
102,968Computer and mathematical occupations
64,155Production occupations
63,549Management occupations
54,053Sales and related occupations
47,855Installation, maintenance, and repair occupations
47,272Healthcare support occupations
Top industries in this zip code by the number of employees in 2005:
Administrative and Support and Waste Management and Remediation Services: Facilities Support Services (100-249 employees: 1 establishment)
Health Care and Social Assistance: Nursing Care Facilities (50-99: 1)
Utilities: Electric Power Distribution (20-49: 1)
Finance and Insurance: Commercial Banking (10-19: 1)
Accommodation and Food Services: Limited-Service Restaurants (10-19: 1)
Accommodation and Food Services: Food Service Contractors (5-9: 1)
Educational Services: Elementary and Secondary Schools (5-9: 1)
People in group quarters in 2010:
1,061 people in state prisons
73 people in nursing facilities/skilled-nursing facilities
People in group quarters in 2000:
983 people in state prisons
87 people in nursing homes
Home Mortgage Disclosure Act Aggregated Statistics For Year 2009 (Based on 6 partial tracts)
A) FHA, FSA/RHS & VA Home Purchase Loans
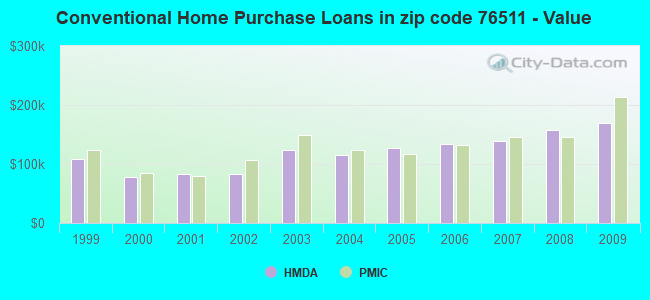
B) Conventional Home Purchase Loans
C) Refinancings
D) Home Improvement Loans
F) Non-occupant Loans on < 5 Family Dwellings (A B C & D)
G) Loans On Manufactured Home Dwelling (A B C & D)
Number
Average Value
Number
Average Value
Number
Average Value
Number
Average Value
Number
Average Value
Number
Average Value
LOANS ORIGINATED
26
$177,666
28
$169,901
67
$191,173
9
$62,460
8
$128,596
4
$49,165
APPLICATIONS APPROVED, NOT ACCEPTED
2
$126,250
1
$324,400
5
$161,400
1
$131,350
0
$0
1
$42,960
APPLICATIONS DENIED
3
$119,193
5
$131,732
20
$181,370
5
$29,158
2
$163,950
2
$40,460
APPLICATIONS WITHDRAWN
3
$136,460
2
$225,405
16
$178,444
1
$89,730
1
$106,320
1
$68,210
FILES CLOSED FOR INCOMPLETENESS
0
$0
1
$46,260
5
$223,374
1
$221,990
0
$0
0
$0
Aggregated Statistics For Year 2008 (Based on 6 partial tracts)
A) FHA, FSA/RHS & VA Home Purchase Loans
B) Conventional Home Purchase Loans
C) Refinancings
D) Home Improvement Loans
F) Non-occupant Loans on < 5 Family Dwellings (A B C & D)
G) Loans On Manufactured Home Dwelling (A B C & D)
Number
Average Value
Number
Average Value
Number
Average Value
Number
Average Value
Number
Average Value
Number
Average Value
LOANS ORIGINATED
20
$144,844
39
$157,920
32
$155,937
12
$88,677
7
$117,904
6
$80,553
APPLICATIONS APPROVED, NOT ACCEPTED
1
$113,730
4
$193,028
5
$135,528
1
$16,910
1
$306,000
2
$61,195
APPLICATIONS DENIED
3
$78,923
8
$86,152
20
$143,122
11
$35,463
2
$63,380
4
$53,120
APPLICATIONS WITHDRAWN
4
$97,102
3
$175,790
11
$138,355
2
$48,135
0
$0
1
$48,810
FILES CLOSED FOR INCOMPLETENESS
0
$0
1
$154,800
3
$154,820
0
$0
0
$0
0
$0
Aggregated Statistics For Year 2007 (Based on 6 partial tracts)
A) FHA, FSA/RHS & VA Home Purchase Loans
B) Conventional Home Purchase Loans
C) Refinancings
D) Home Improvement Loans
F) Non-occupant Loans on < 5 Family Dwellings (A B C & D)
G) Loans On Manufactured Home Dwelling (A B C & D)
Number
Average Value
Number
Average Value
Number
Average Value
Number
Average Value
Number
Average Value
Number
Average Value
LOANS ORIGINATED
13
$157,158
65
$138,786
32
$166,456
12
$64,016
9
$95,233
6
$63,255
APPLICATIONS APPROVED, NOT ACCEPTED
1
$113,660
9
$124,600
7
$199,534
5
$41,258
0
$0
3
$60,350
APPLICATIONS DENIED
1
$116,400
12
$109,817
31
$159,136
20
$63,996
6
$128,812
4
$76,630
APPLICATIONS WITHDRAWN
2
$125,870
5
$144,356
18
$153,907
2
$74,070
0
$0
1
$51,220
FILES CLOSED FOR INCOMPLETENESS
1
$120,380
0
$0
7
$195,046
0
$0
0
$0
0
$0
Aggregated Statistics For Year 2006 (Based on 6 partial tracts)
A) FHA, FSA/RHS & VA Home Purchase Loans
B) Conventional Home Purchase Loans
C) Refinancings
D) Home Improvement Loans
F) Non-occupant Loans on < 5 Family Dwellings (A B C & D)
G) Loans On Manufactured Home Dwelling (A B C & D)
Number
Average Value
Number
Average Value
Number
Average Value
Number
Average Value
Number
Average Value
Number
Average Value
LOANS ORIGINATED
18
$137,917
83
$133,472
35
$159,594
12
$36,949
18
$97,332
8
$62,986
APPLICATIONS APPROVED, NOT ACCEPTED
1
$124,020
10
$97,483
8
$138,216
2
$26,170
1
$99,190
3
$54,410
APPLICATIONS DENIED
1
$58,500
20
$69,254
35
$116,134
16
$52,688
6
$94,718
12
$45,144
APPLICATIONS WITHDRAWN
0
$0
8
$137,476
24
$131,459
4
$71,228
2
$90,425
1
$42,100
FILES CLOSED FOR INCOMPLETENESS
0
$0
1
$92,470
7
$161,999
0
$0
1
$66,860
0
$0
Aggregated Statistics For Year 2005 (Based on 6 partial tracts)
A) FHA, FSA/RHS & VA Home Purchase Loans
B) Conventional Home Purchase Loans
C) Refinancings
D) Home Improvement Loans
F) Non-occupant Loans on < 5 Family Dwellings (A B C & D)
G) Loans On Manufactured Home Dwelling (A B C & D)
Number
Average Value
Number
Average Value
Number
Average Value
Number
Average Value
Number
Average Value
Number
Average Value
LOANS ORIGINATED
17
$124,349
71
$127,612
55
$138,457
12
$86,590
12
$77,478
8
$63,008
APPLICATIONS APPROVED, NOT ACCEPTED
1
$129,420
11
$78,745
6
$190,612
2
$23,195
1
$159,300
5
$51,430
APPLICATIONS DENIED
2
$96,920
24
$82,298
46
$128,920
13
$32,850
4
$56,415
14
$46,863
APPLICATIONS WITHDRAWN
0
$0
8
$144,066
33
$148,207
5
$173,912
2
$106,090
0
$0
FILES CLOSED FOR INCOMPLETENESS
0
$0
2
$118,635
13
$141,607
0
$0
0
$0
1
$42,420
Aggregated Statistics For Year 2004 (Based on 6 partial tracts)
A) FHA, FSA/RHS & VA Home Purchase Loans
B) Conventional Home Purchase Loans
C) Refinancings
D) Home Improvement Loans
F) Non-occupant Loans on < 5 Family Dwellings (A B C & D)
G) Loans On Manufactured Home Dwelling (A B C & D)
Number
Average Value
Number
Average Value
Number
Average Value
Number
Average Value
Number
Average Value
Number
Average Value
LOANS ORIGINATED
18
$117,680
59
$115,678
76
$132,212
10
$52,791
8
$100,259
8
$61,426
APPLICATIONS APPROVED, NOT ACCEPTED
0
$0
6
$76,262
16
$107,896
4
$37,932
1
$97,800
6
$54,612
APPLICATIONS DENIED
1
$87,970
17
$85,634
51
$102,373
15
$51,889
3
$65,210
13
$45,690
APPLICATIONS WITHDRAWN
1
$86,050
4
$112,678
45
$123,088
3
$50,963
1
$80,110
1
$31,000
FILES CLOSED FOR INCOMPLETENESS
0
$0
1
$101,100
5
$108,852
0
$0
0
$0
1
$66,500
Aggregated Statistics For Year 2003 (Based on 6 partial tracts)
A) FHA, FSA/RHS & VA Home Purchase Loans
B) Conventional Home Purchase Loans
C) Refinancings
D) Home Improvement Loans
F) Non-occupant Loans on < 5 Family Dwellings (A B C & D)
Number
Average Value
Number
Average Value
Number
Average Value
Number
Average Value
Number
Average Value
LOANS ORIGINATED
11
$125,665
58
$124,104
127
$118,002
12
$46,030
10
$80,164
APPLICATIONS APPROVED, NOT ACCEPTED
1
$142,590
7
$84,911
13
$121,228
3
$38,537
0
$0
APPLICATIONS DENIED
1
$65,580
16
$87,234
45
$106,736
8
$22,876
4
$63,422
APPLICATIONS WITHDRAWN
1
$111,640
7
$115,443
49
$125,402
1
$23,440
2
$75,280
FILES CLOSED FOR INCOMPLETENESS
0
$0
1
$132,650
6
$121,927
1
$46,300
0
$0
Aggregated Statistics For Year 2002 (Based on 2 partial tracts)
A) FHA, FSA/RHS & VA Home Purchase Loans
B) Conventional Home Purchase Loans
C) Refinancings
D) Home Improvement Loans
F) Non-occupant Loans on < 5 Family Dwellings (A B C & D)
Number
Average Value
Number
Average Value
Number
Average Value
Number
Average Value
Number
Average Value
LOANS ORIGINATED
2
$113,015
10
$83,582
13
$93,953
3
$20,833
2
$37,610
APPLICATIONS APPROVED, NOT ACCEPTED
0
$0
3
$75,223
3
$74,860
1
$9,090
0
$0
APPLICATIONS DENIED
0
$0
6
$59,598
8
$76,905
1
$117,740
0
$0
APPLICATIONS WITHDRAWN
0
$0
1
$21,080
7
$66,606
0
$0
0
$0
FILES CLOSED FOR INCOMPLETENESS
0
$0
0
$0
1
$73,410
0
$0
0
$0
Aggregated Statistics For Year 2001 (Based on 2 partial tracts)
A) FHA, FSA/RHS & VA Home Purchase Loans
B) Conventional Home Purchase Loans
C) Refinancings
D) Home Improvement Loans
F) Non-occupant Loans on < 5 Family Dwellings (A B C & D)
Number
Average Value
Number
Average Value
Number
Average Value
Number
Average Value
Number
Average Value
LOANS ORIGINATED
6
$78,313
9
$83,340
11
$95,541
2
$30,160
1
$27,980
APPLICATIONS APPROVED, NOT ACCEPTED
0
$0
2
$62,685
1
$37,790
1
$29,800
0
$0
APPLICATIONS DENIED
0
$0
6
$47,787
4
$64,323
0
$0
0
$0
APPLICATIONS WITHDRAWN
0
$0
2
$13,080
3
$79,463
0
$0
1
$25,440
FILES CLOSED FOR INCOMPLETENESS
0
$0
0
$0
0
$0
0
$0
0
$0
Aggregated Statistics For Year 2000 (Based on 2 partial tracts)
A) FHA, FSA/RHS & VA Home Purchase Loans
B) Conventional Home Purchase Loans
C) Refinancings
D) Home Improvement Loans
F) Non-occupant Loans on < 5 Family Dwellings (A B C & D)
Number
Average Value
Number
Average Value
Number
Average Value
Number
Average Value
Number
Average Value
LOANS ORIGINATED
1
$73,770
10
$77,913
3
$91,333
1
$11,630
1
$56,330
APPLICATIONS APPROVED, NOT ACCEPTED
0
$0
2
$60,145
1
$92,670
2
$34,340
0
$0
APPLICATIONS DENIED
1
$42,880
8
$48,559
1
$106,840
1
$17,080
0
$0
APPLICATIONS WITHDRAWN
0
$0
0
$0
1
$24,710
1
$71,950
0
$0
FILES CLOSED FOR INCOMPLETENESS
0
$0
0
$0
1
$33,430
0
$0
0
$0
Aggregated Statistics For Year 1999 (Based on 2 partial tracts)
A) FHA, FSA/RHS & VA Home Purchase Loans
B) Conventional Home Purchase Loans
C) Refinancings
D) Home Improvement Loans
F) Non-occupant Loans on < 5 Family Dwellings (A B C & D)
2002 - 2018 National Fire Incident Reporting System (NFIRS) incidents
Based on the data from the years 2002 - 2018 the average number of fire incidents per year is 10. The highest number of reported fire incidents - 31 took place in 2008, and the least - 0 in 2010. The data has a dropping trend.
When looking into fire subcategories, the most incidents belonged to: Outside Fires (59.6%), and Structure Fires (23.0%).
Fire incident types reported to NFIRS in Zip Code 76511


 Nearest zip codes: 76573, 76530, 76534, 76523, 76554, 76537.


 Based on the data from the years 2002 - 2018 the average number of fire incidents per year is 10. The highest number of reported fire incidents - 31 took place in 2008, and the least - 0 in 2010. The data has a dropping trend.
 When looking into fire subcategories, the most incidents belonged to: Outside Fires (59.6%), and Structure Fires (23.0%).