Estimated zip code population in 2022: 2,967 Zip code population in 2010: 2,615 Zip code population in 2000: 2,396
Houses and condos: 1,264 Renter-occupied apartments: 264
% of renters here:
24%
State:
38%
March 2022 cost of living index in zip code 76534: 79.2 (low, U.S. average is 100)
Land area: 88.4 sq. mi. Water area: 0.8 sq. mi.
Population density: 34 people per square mile
(very low).
OSM Map
General Map
Google Map
MSN Map
OSM Map
General Map
Google Map
MSN Map
OSM Map
General Map
Google Map
MSN Map
OSM Map
General Map
Google Map
MSN Map
Please wait while loading the map...
Real estate property taxes paid for housing units in 2022:
This zip code:
1.1% ($2,410)
Texas:
1.5% ($4,050)
Median real estate property taxes paid for housing units with mortgages in 2022: $2,688 (1.1%) Median real estate property taxes paid for housing units with no mortgage in 2022: $1,936 (0.9%)
Business Search- 14 Million verified businesses
Males: 1,452
(48.9%)
Females: 1,515
(51.1%)
For population 25 years and over in 76534:
High school or higher: 86.1%
Bachelor's degree or higher: 24.8%
Graduate or professional degree: 7.2%
Unemployed: 0.6%
Mean travel time to work (commute): 30.5 minutes
For population 15 years and over in 76534:
Never married: 16.1%
Now married: 72.2%
Separated: 2.7%
Widowed: 3.2%
Divorced: 5.9%
Zip code 76534 compared to state average:
Unemployed percentage significantly below state average.
Black race population percentage significantly below state average.
Hispanic race population percentage below state average.
Median age significantly above state average.
Foreign-born population percentage significantly below state average.
Renting percentage below state average.
Length of stay since moving in significantly above state average.
Number of college students significantly below state average.
Estimated median house/condo value in 2022: $214,071
76534:
$214,071
Texas:
$275,400
According to our research of Texas and other state lists, there were 7 registered sex offenders living in 76534 zip code as of May 28, 2024. The ratio of all residents to sex offenders in zip code 76534 is 384 to 1. The ratio of registered sex offenders to all residents in this zip code is near the state average.
Median resident age:
This zip code:
46.9 years
Texas median age:
35.6 years
Average household size:
This zip code:
2.6 people
Texas:
2.6 people
Averages for the 2020 tax year for zip code 76534, filed in 2021:
Average Adjusted Gross Income (AGI) in 2020: $71,795 (Individual Income Tax Returns)
Here:
$71,795
State:
$77,054
Salary/wage: $62,092 (reported on 79.8% of returns)
Here:
$62,092
State:
$62,766
(% of AGI for various income ranges: 1210.0% for AGIs below $25k, 3563.2% for AGIs $25k-50k, 5824.6% for AGIs $50k-75k, 9802.2% for AGIs $75k-100k, 16551.7% for AGIs $100k-200k, 39556.7% for AGIs over 200k)
Taxable interest for individuals: $1,171 (reported on 26.1% of returns)
This zip code:
$1,171
Texas:
$2,665
(% of AGI for various income ranges: 7.2% for AGIs below $25k, 15.0% for AGIs $25k-50k, 33.8% for AGIs $50k-75k, 76.7% for AGIs $75k-100k, 65.0% for AGIs $100k-200k, 403.3% for AGIs over 200k)
Ordinary dividends: $3,693 (reported on 12.6% of returns)
Here:
$3,693
State:
$10,044
(% of AGI for various income ranges: 26.4% for AGIs $25k-50k, 135.4% for AGIs $50k-75k, 134.2% for AGIs $100k-200k, 530.0% for AGIs over 200k)
Net capital gain/loss in AGI: +$17,488 (reported on 14.3% of returns)
Here:
+$17,488
State:
+$39,590
(% of AGI for various income ranges: 35.9% for AGIs $25k-50k, 170.0% for AGIs $50k-75k, 65.6% for AGIs $75k-100k, 637.5% for AGIs $100k-200k, 6163.3% for AGIs over 200k)
Profit/loss from business: +$14,076 (reported on 17.6% of returns)
Here:
+$14,076
State:
+$10,888
(% of AGI for various income ranges: 177.6% for AGIs below $25k, 194.5% for AGIs $25k-50k, 370.0% for AGIs $50k-75k, 606.7% for AGIs $75k-100k, 525.8% for AGIs $100k-200k, 1420.0% for AGIs over 200k)
Taxable individual retirement arrangement distribution: $18,362 (reported on 6.7% of returns)
76534:
$18,362
Texas:
$24,740
(% of AGI for various income ranges: 132.4% for AGIs below $25k, 395.4% for AGIs $50k-75k, 693.3% for AGIs $75k-100k)
Total itemized deductions: $35,225 (reported on 3.4% of returns)
Here:
$35,225
State:
$40,428
(% of AGI for various income ranges: 1174.2% for AGIs $100k-200k)
Charity contributions: $10,233 (reported on 2.5% of returns)
Here:
$10,233
State:
$18,201
(% of AGI for various income ranges: 255.8% for AGIs $100k-200k)
Taxes paid: $7,025 (reported on 3.4% of returns)
76534:
$7,025
State:
$7,821
(% of AGI for various income ranges: 234.2% for AGIs $100k-200k)
Earned income credit: $2,410 (reported on 16.8% of returns)
Here:
$2,410
State:
$2,584
(% of AGI for various income ranges: 122.8% for AGIs below $25k, 79.5% for AGIs $25k-50k)
Percentage of individuals using paid preparers for their 2020 taxes: 93.3%
Here:
93%
State:
92%
(% for various income ranges: 94.3% for AGIs below $25k, 92.9% for AGIs $25k-50k, 89.5% for AGIs $50k-75k, 92.3% for AGIs $75k-100k, 100.0% for AGIs $100k-200k, 83.3% for AGIs over 200k)
Averages for the 2012 tax year for zip code 76534, filed in 2013:
Average Adjusted Gross Income (AGI) in 2012: $53,788 (Individual Income Tax Returns)
Here:
$53,788
State:
$65,384
Salary/wage: $47,821 (reported on 81.7% of returns)
Here:
$47,821
State:
$52,524
(% of AGI for various income ranges: 73.8% for AGIs below $25k, 76.4% for AGIs $25k-50k, 78.9% for AGIs $50k-75k, 80.1% for AGIs $75k-100k, 77.3% for AGIs $100k-200k, 50.4% for AGIs over 200k)
Taxable interest for individuals: $1,171 (reported on 28.4% of returns)
This zip code:
$1,171
Texas:
$2,372
(% of AGI for various income ranges: 0.6% for AGIs below $25k, 0.4% for AGIs $25k-50k, 0.3% for AGIs $50k-75k, 0.3% for AGIs $75k-100k, 0.6% for AGIs $100k-200k, 1.5% for AGIs over 200k)
Ordinary dividends: $2,258 (reported on 11.0% of returns)
Here:
$2,258
State:
$9,721
(% of AGI for various income ranges: 0.6% for AGIs $25k-50k, 0.2% for AGIs $50k-75k, 1.3% for AGIs $100k-200k)
Net capital gain/loss in AGI: +$4,418 (reported on 10.1% of returns)
Here:
+$4,418
State:
+$35,319
(% of AGI for various income ranges: 0.8% for AGIs $50k-75k, 2.9% for AGIs $100k-200k)
Profit/loss from business: +$8,823 (reported on 20.2% of returns)
Here:
+$8,823
State:
+$13,732
(% of AGI for various income ranges: 11.7% for AGIs below $25k, 4.5% for AGIs $25k-50k, 2.0% for AGIs $50k-75k, 1.8% for AGIs $75k-100k, 4.0% for AGIs $100k-200k)
Taxable individual retirement arrangement distribution: $16,025 (reported on 11.0% of returns)
76534:
$16,025
Texas:
$19,511
(% of AGI for various income ranges: 5.4% for AGIs below $25k, 2.4% for AGIs $25k-50k, 5.8% for AGIs $50k-75k, 5.8% for AGIs $100k-200k)
Total itemized deductions: $19,572 (18% of AGI, reported on 16.5% of returns)
Here:
$19,572
State:
$24,724
Here:
17.8% of AGI
State:
15.9% of AGI
(% of AGI for various income ranges: 6.2% for AGIs $25k-50k, 4.8% for AGIs $50k-75k, 6.4% for AGIs $75k-100k, 8.1% for AGIs $100k-200k, 6.5% for AGIs over 200k)
Charity contributions: $5,177 (reported on 11.9% of returns)
Here:
$5,177
State:
$6,808
(% of AGI for various income ranges: 1.5% for AGIs below $25k, 0.8% for AGIs $50k-75k, 0.8% for AGIs $75k-100k, 3.1% for AGIs $100k-200k)
Taxes paid: $4,650 (reported on 16.5% of returns)
76534:
$4,650
State:
$6,921
(% of AGI for various income ranges: 1.2% for AGIs $25k-50k, 1.0% for AGIs $50k-75k, 1.8% for AGIs $75k-100k, 2.0% for AGIs $100k-200k, 1.6% for AGIs over 200k)
Earned income credit: $2,467 (reported on 22.0% of returns)
Here:
$2,467
State:
$2,570
(% of AGI for various income ranges: 8.5% for AGIs below $25k, 1.8% for AGIs $25k-50k)
Percentage of individuals using paid preparers for their 2012 taxes: 57.8%
Here:
58%
State:
51%
(% for various income ranges: 55.0% for AGIs below $25k, 51.7% for AGIs $25k-50k, 62.5% for AGIs $50k-75k, 60.0% for AGIs $75k-100k, 63.6% for AGIs $100k-200k, 100.0% for AGIs over 200k)
Averages for the 2004 tax year for zip code 76534, filed in 2005:
Average Adjusted Gross Income (AGI) in 2004: $38,658 (Individual Income Tax Returns)
Here:
$38,658
State:
$47,881
Salary/wage: $36,234 (reported on 84.9% of returns)
Here:
$36,234
State:
$41,947
(% of AGI for various income ranges: 173.6% for AGIs below $10k, 79.1% for AGIs $10k-25k, 82.6% for AGIs $25k-50k, 85.7% for AGIs $50k-75k, 88.0% for AGIs $75k-100k, 58.3% for AGIs over 100k)
Taxable interest for individuals: $1,332 (reported on 35.2% of returns)
This zip code:
$1,332
Texas:
$2,255
(% of AGI for various income ranges: 8.9% for AGIs below $10k, 2.1% for AGIs $10k-25k, 1.1% for AGIs $25k-50k, 1.2% for AGIs $50k-75k, 0.3% for AGIs $75k-100k, 1.1% for AGIs over 100k)
Taxable dividends: $1,274 (reported on 11.2% of returns)
Here:
$1,274
State:
$4,261
(% of AGI for various income ranges: 0.6% for AGIs $10k-25k, 0.1% for AGIs $25k-50k, 0.2% for AGIs $50k-75k, 0.1% for AGIs $75k-100k, 0.9% for AGIs over 100k)
Net capital gain/loss: +$7,738 (reported on 12.4% of returns)
Here:
+$7,738
State:
+$16,110
(% of AGI for various income ranges: 1.2% for AGIs below $10k, 1.6% for AGIs $10k-25k, 1.2% for AGIs $25k-50k, 0.3% for AGIs $50k-75k, 0.4% for AGIs $75k-100k, 8.1% for AGIs over 100k)
Profit/loss from business: +$3,577 (reported on 13.6% of returns)
Here:
+$3,577
State:
+$11,013
(% of AGI for various income ranges: 7.7% for AGIs below $10k, 6.4% for AGIs $10k-25k, 3.2% for AGIs $25k-50k, -1.2% for AGIs $50k-75k, -0.7% for AGIs $75k-100k)
IRA payment deduction: $1,688 (reported on 1.5% of returns)
76534:
$1,688
Texas:
$3,120
Total itemized deductions: $16,430 (21% of AGI, reported on 15.8% of returns)
Here:
$16,430
State:
$19,631
Here:
20.7% of AGI
State:
18.9% of AGI
(% of AGI for various income ranges: 3.8% for AGIs $10k-25k, 5.6% for AGIs $25k-50k, 7.6% for AGIs $50k-75k, 8.2% for AGIs $75k-100k, 7.8% for AGIs over 100k)
Charity contributions deductions: $3,375 (4% of AGI, reported on 12.2% of returns)
Here:
$3,375
State:
$4,753
Here:
3.9% of AGI
State:
4.2% of AGI
(% of AGI for various income ranges: 0.7% for AGIs $10k-25k, 0.7% for AGIs $25k-50k, 1.2% for AGIs $50k-75k, 1.3% for AGIs $75k-100k, 1.5% for AGIs over 100k)
Total tax: $5,147 (reported on 73.0% of returns)
76534:
$5,147
State:
$9,058
(% of AGI for various income ranges: 4.3% for AGIs below $10k, 3.9% for AGIs $10k-25k, 6.4% for AGIs $25k-50k, 8.1% for AGIs $50k-75k, 10.5% for AGIs $75k-100k, 17.5% for AGIs over 100k)
Earned income credit: $1,865 (reported on 18.5% of returns)
Here:
$1,865
State:
$2,024
Percentage of individuals using paid preparers for their 2004 taxes: 59.3%
Here:
59%
State:
57%
(% for various income ranges: 50.5% for AGIs below $10k, 61.7% for AGIs $10k-25k, 61.0% for AGIs $25k-50k, 60.1% for AGIs $50k-75k, 56.8% for AGIs $75k-100k, 75.5% for AGIs over 100k)
Household received Food Stamps/SNAP in the past 12 months: 130 Household did not receive Food Stamps/SNAP in the past 12 months: 995
Women who had a birth in the past 12 months: 7 (4 now married, 2 unmarried) Women who did not have a birth in the past 12 months: 564 (337 now married, 224 unmarried)
Housing units in zip code 76534 with a mortgage: 496 (66 second mortgage, 72 both second mortgage and home equity loan) Median monthly owner costs for units with a mortgage: $1,450 Median monthly owner costs for units without a mortgage: $591
Residents with income below the poverty level in 2022:
This zip code:
7.8%
Whole state:
14.0%
Residents with income below 50% of the poverty level in 2022:
This zip code:
5.1%
Whole state:
7.4%
Median number of rooms in houses and condos:
Here:
6.1
State:
6.3
Median number of rooms in apartments:
Here:
3.9
State:
4.0
Notable locations in this zip code not listed on our city pages
Notable locations in zip code 76534: JB Rodeo Arena (A), La Iglesia Pentecostes El Cristo (B), Holland Substation (C), Mayfield-Dobbs Museum (D), BJ Hill Library (E), Holland City Hall (F), Bell County Justice of the Peace Number 2 Courthouse (G), Kuhlmann Civic Center (H), Holland Volunteer Fire Department / Ambulance Service (I). Display/hide their locations on the map
Churches in zip code 76534 include: Val Verde Church (A), Iglesia Bautista Nueva Esperanza (B), First Baptist Church (C), First United Methodist Church (D), Holland Church of Christ (E). Display/hide their locations on the map
Cemeteries: Roucker Cemetery (1), Sunshine Cemetery (2), Holland Cemetery (3), Simmons Cemetery (4), Hennington Cemetery (5), Volo Cemetery (6), Center Lake Cemetery (7). Display/hide their locations on the map
Streams, rivers, and creeks: Willow Creek (A), Server Branch (B), Town Branch (C), Cathey Creek (D), Runnells Creek (E), Pennington Branch (F), Indian Creek (G), Georgia Branch (H), Darrs Creek (I). Display/hide their locations on the map
Size of family households: 482 2-persons, 156 3-persons, 121 4-persons, 77 5-persons, 20 6-persons, 3 7-or-more-persons
Size of nonfamily households: 225 1-person, 39 2-persons
490 married couples with children.
116 single-parent households (5 men, 111 women).
92.5% of residents of 76534 zip code speak English at home.
7.8% of residents speak Spanish at home (87% very well, 2% well, 11% not at all).
0.1% of residents speak Asian or Pacific Island language at home (100% very well).
Foreign born population: 109 (3.7%) (51.2% of them are naturalized citizens)
This zip code:
3.7%
Whole state:
17.2%
59%Honduras
15%Sweden
13%Bhutan
2%Japan
17%German
16%American
9%English
6%Irish
3%Czech
3%Northern European
2%Scottish
Year of entry for the foreign-born population
02010 or later
122000 to 2009
351990 to 1999
74Before 1990
Housing units lacking complete plumbing facilities: 4.2% Housing units lacking complete kitchen facilities: 7.6%
81.7%Electricity
13.2%Utility gas
5.1%Bottled, tank, or LP gas
Population in 1990: 2,223. Population change in the 1990s: +173 (+7.8%).
Place of birth for U.S.-born residents:
This state: 2,379
Northeast: 45
Midwest: 114
South: 146
West: 125
60% of the 76534 zip code residents lived in the same house 5 years ago. Out of people who lived in different houses, 67% lived in this county. Out of people who lived in different counties, 50% lived in Texas.
92% of the 76534 zip code residents lived in the same house 1 year ago. Out of people who lived in different houses, 26% moved from this county. Out of people who lived in different houses, 56% moved from different county within same state. Out of people who lived in different houses, 16% moved from different state. Out of people who lived in different houses, 7% moved from abroad.
Private vs. public school enrollment:
Students in private schools in grades 1 to 8 (elementary and middle school): 28
Here:
8.6%
Texas:
8.8%
Students in private schools in grades 9 to 12 (high school): 7
Here:
5.1%
Texas:
8.0%
Students in private undergraduate colleges: 10
Here:
24.1%
Texas:
16.2%
Occupation by median earnings in the past 12 months ($)
115,238Architecture and engineering occupations
97,172Business and financial operations occupations
84,037Management occupations
70,111Computer and mathematical occupations
69,530Health technologists and technicians
64,598Health diagnosing and treating practitioners and other technical occupations
Top industries in this zip code by the number of employees in 2005:
Wholesale Trade: Motor Vehicle Parts (Used) Merchant Wholesalers (20-49 employees: 1 establishment)
Arts, Entertainment, and Recreation: Other Gambling Industries (10-19: 1)
Arts, Entertainment, and Recreation: All Other Amusement and Recreation Industries (10-19: 1)
Wholesale Trade: Recyclable Material Merchant Wholesalers (10-19: 1)
Utilities: Water Supply and Irrigation Systems (5-9: 1)
Finance and Insurance: Commercial Banking (5-9: 1)
Other Services (except Public Administration): Religious Organizations (5-9: 1)
Fatal accident statistics in 2013:
Fatal accident count: 4
Vehicles involved in fatal accidents: 6
Fatal accidents caused by drunken drivers: 2
Fatalities: 4
Persons involved in fatal accidents: 6
Pedestrians involved in fatal accidents: 1
Fatal accident statistics in 2011:
Fatal accident count: 1
Vehicles involved in fatal accidents: 1
Fatal accidents caused by drunken drivers: 0
Fatalities: 1
Persons involved in fatal accidents: 1
Pedestrians involved in fatal accidents: 0
Home Mortgage Disclosure Act Aggregated Statistics For Year 2009 (Based on 4 partial tracts)
A) FHA, FSA/RHS & VA Home Purchase Loans
B) Conventional Home Purchase Loans
C) Refinancings
D) Home Improvement Loans
F) Non-occupant Loans on < 5 Family Dwellings (A B C & D)
G) Loans On Manufactured Home Dwelling (A B C & D)
Number
Average Value
Number
Average Value
Number
Average Value
Number
Average Value
Number
Average Value
Number
Average Value
LOANS ORIGINATED
32
$176,333
32
$160,374
81
$183,050
9
$68,036
8
$78,686
6
$53,435
APPLICATIONS APPROVED, NOT ACCEPTED
3
$95,403
1
$303,420
5
$149,078
1
$136,610
0
$0
1
$105,550
APPLICATIONS DENIED
3
$117,617
9
$95,360
22
$183,312
6
$31,377
1
$272,640
4
$44,272
APPLICATIONS WITHDRAWN
2
$175,350
2
$189,910
19
$170,607
0
$0
1
$86,280
1
$72,760
FILES CLOSED FOR INCOMPLETENESS
0
$0
0
$0
7
$216,403
2
$177,150
0
$0
0
$0
Aggregated Statistics For Year 2008 (Based on 4 partial tracts)
A) FHA, FSA/RHS & VA Home Purchase Loans
B) Conventional Home Purchase Loans
C) Refinancings
D) Home Improvement Loans
F) Non-occupant Loans on < 5 Family Dwellings (A B C & D)
G) Loans On Manufactured Home Dwelling (A B C & D)
Number
Average Value
Number
Average Value
Number
Average Value
Number
Average Value
Number
Average Value
Number
Average Value
LOANS ORIGINATED
23
$143,822
45
$152,612
37
$153,583
12
$83,824
8
$91,286
8
$65,732
APPLICATIONS APPROVED, NOT ACCEPTED
2
$121,175
5
$204,778
4
$166,378
1
$19,260
1
$326,430
2
$69,795
APPLICATIONS DENIED
3
$90,707
9
$80,200
29
$122,451
16
$32,354
2
$72,035
5
$62,754
APPLICATIONS WITHDRAWN
3
$87,783
4
$169,130
15
$136,113
1
$73,630
0
$0
2
$50,590
FILES CLOSED FOR INCOMPLETENESS
0
$0
1
$108,350
3
$169,387
0
$0
0
$0
1
$26,390
Aggregated Statistics For Year 2007 (Based on 4 partial tracts)
A) FHA, FSA/RHS & VA Home Purchase Loans
B) Conventional Home Purchase Loans
C) Refinancings
D) Home Improvement Loans
F) Non-occupant Loans on < 5 Family Dwellings (A B C & D)
G) Loans On Manufactured Home Dwelling (A B C & D)
Number
Average Value
Number
Average Value
Number
Average Value
Number
Average Value
Number
Average Value
Number
Average Value
LOANS ORIGINATED
15
$159,957
70
$147,771
35
$162,408
14
$53,652
10
$100,053
8
$68,441
APPLICATIONS APPROVED, NOT ACCEPTED
1
$79,380
11
$125,344
6
$230,372
8
$40,029
0
$0
5
$60,228
APPLICATIONS DENIED
3
$70,600
14
$104,325
37
$145,411
24
$67,455
6
$121,640
6
$63,100
APPLICATIONS WITHDRAWN
1
$195,280
5
$155,306
21
$146,041
4
$64,950
0
$0
1
$54,640
FILES CLOSED FOR INCOMPLETENESS
1
$205,820
0
$0
6
$234,585
0
$0
0
$0
1
$136,800
Aggregated Statistics For Year 2006 (Based on 4 partial tracts)
A) FHA, FSA/RHS & VA Home Purchase Loans
B) Conventional Home Purchase Loans
C) Refinancings
D) Home Improvement Loans
F) Non-occupant Loans on < 5 Family Dwellings (A B C & D)
G) Loans On Manufactured Home Dwelling (A B C & D)
Number
Average Value
Number
Average Value
Number
Average Value
Number
Average Value
Number
Average Value
Number
Average Value
LOANS ORIGINATED
24
$133,465
100
$125,334
32
$178,829
14
$34,706
17
$96,295
12
$55,655
APPLICATIONS APPROVED, NOT ACCEPTED
1
$132,300
12
$90,368
9
$145,428
3
$21,757
2
$68,820
3
$32,197
APPLICATIONS DENIED
3
$47,913
29
$58,561
37
$113,812
17
$41,660
7
$90,756
16
$41,926
APPLICATIONS WITHDRAWN
0
$0
10
$121,160
35
$120,463
3
$71,603
3
$86,287
2
$47,605
FILES CLOSED FOR INCOMPLETENESS
1
$27,080
1
$98,650
9
$145,477
0
$0
1
$71,320
0
$0
Aggregated Statistics For Year 2005 (Based on 4 partial tracts)
A) FHA, FSA/RHS & VA Home Purchase Loans
B) Conventional Home Purchase Loans
C) Refinancings
D) Home Improvement Loans
F) Non-occupant Loans on < 5 Family Dwellings (A B C & D)
G) Loans On Manufactured Home Dwelling (A B C & D)
Number
Average Value
Number
Average Value
Number
Average Value
Number
Average Value
Number
Average Value
Number
Average Value
LOANS ORIGINATED
20
$130,422
82
$127,814
63
$136,282
15
$94,835
12
$77,875
10
$61,792
APPLICATIONS APPROVED, NOT ACCEPTED
1
$110,150
14
$85,747
7
$168,689
3
$19,377
2
$88,505
7
$46,006
APPLICATIONS DENIED
1
$233,790
32
$78,448
58
$119,202
13
$32,639
5
$58,704
22
$47,645
APPLICATIONS WITHDRAWN
1
$161,800
11
$131,388
33
$144,366
5
$218,068
2
$113,170
1
$21,530
FILES CLOSED FOR INCOMPLETENESS
0
$0
3
$95,507
12
$156,286
0
$0
0
$0
0
$0
Aggregated Statistics For Year 2004 (Based on 4 partial tracts)
A) FHA, FSA/RHS & VA Home Purchase Loans
B) Conventional Home Purchase Loans
C) Refinancings
D) Home Improvement Loans
F) Non-occupant Loans on < 5 Family Dwellings (A B C & D)
G) Loans On Manufactured Home Dwelling (A B C & D)
Number
Average Value
Number
Average Value
Number
Average Value
Number
Average Value
Number
Average Value
Number
Average Value
LOANS ORIGINATED
23
$118,180
68
$115,930
80
$131,732
11
$52,857
10
$86,447
8
$56,346
APPLICATIONS APPROVED, NOT ACCEPTED
0
$0
6
$90,382
17
$104,621
6
$38,572
2
$77,225
8
$49,974
APPLICATIONS DENIED
3
$48,440
17
$93,262
56
$97,641
14
$65,671
4
$58,152
15
$55,549
APPLICATIONS WITHDRAWN
1
$51,480
4
$107,982
51
$117,754
2
$27,030
1
$127,510
1
$49,180
FILES CLOSED FOR INCOMPLETENESS
0
$0
1
$107,850
3
$133,447
1
$33,330
0
$0
0
$0
Aggregated Statistics For Year 2003 (Based on 4 partial tracts)
A) FHA, FSA/RHS & VA Home Purchase Loans
B) Conventional Home Purchase Loans
C) Refinancings
D) Home Improvement Loans
F) Non-occupant Loans on < 5 Family Dwellings (A B C & D)
Number
Average Value
Number
Average Value
Number
Average Value
Number
Average Value
Number
Average Value
LOANS ORIGINATED
14
$116,940
66
$121,758
148
$112,324
11
$47,710
11
$77,620
APPLICATIONS APPROVED, NOT ACCEPTED
2
$82,510
8
$68,665
14
$109,899
3
$46,250
0
$0
APPLICATIONS DENIED
1
$54,070
21
$60,964
53
$104,118
9
$24,311
4
$69,840
APPLICATIONS WITHDRAWN
2
$80,985
8
$130,034
51
$118,686
1
$33,360
1
$104,400
FILES CLOSED FOR INCOMPLETENESS
0
$0
1
$114,750
7
$110,134
0
$0
0
$0
Aggregated Statistics For Year 1999 (Based on 1 partial tract)
A) FHA, FSA/RHS & VA Home Purchase Loans
B) Conventional Home Purchase Loans
C) Refinancings
D) Home Improvement Loans
F) Non-occupant Loans on < 5 Family Dwellings (A B C & D)
Detailed PMIC statistics for the following Tracts:0234.01
, 0234.02
2002 - 2018 National Fire Incident Reporting System (NFIRS) incidents
According to the data from the years 2002 - 2018 the average number of fires per year is 6. The highest number of reported fire incidents - 12 took place in 2004, and the least - 1 in 2015. The data has a decreasing trend.
When looking into fire subcategories, the most incidents belonged to: Outside Fires (58.0%), and Structure Fires (30.0%).
Fire incident types reported to NFIRS in Zip Code 76534

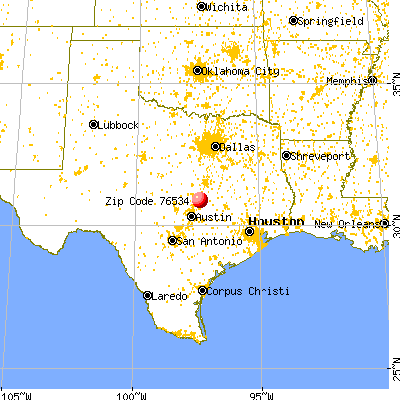


 Nearest zip codes: 76554, 76511, 76523, 76573, 76569, 76530.


 According to the data from the years 2002 - 2018 the average number of fires per year is 6. The highest number of reported fire incidents - 12 took place in 2004, and the least - 1 in 2015. The data has a decreasing trend.
 When looking into fire subcategories, the most incidents belonged to: Outside Fires (58.0%), and Structure Fires (30.0%).