Estimated median house/condo value in 2022: $198,913
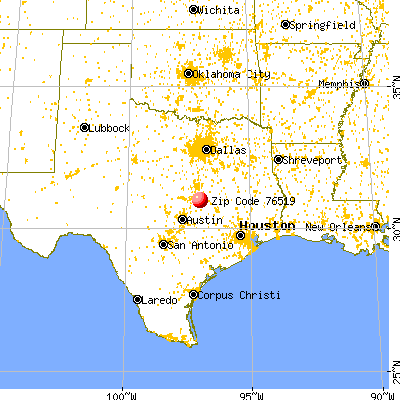
76519:
$198,913
Texas:
$275,400
According to our research of Texas and other state lists, there was 1 registered sex offender living in 76519 zip code as of May 28, 2024. The ratio of all residents to sex offenders in zip code 76519 is 720 to 1. The ratio of registered sex offenders to all residents in this zip code is lower than the state average.
Median resident age:
This zip code:
40.0 years
Texas median age:
35.6 years
Average household size:
This zip code:
2.6 people
Texas:
2.6 people
Averages for the 2020 tax year for zip code 76519, filed in 2021:
Average Adjusted Gross Income (AGI) in 2020: $55,877 (Individual Income Tax Returns)
Here:
$55,877
State:
$77,054
Salary/wage: $53,525 (reported on 76.9% of returns)
Here:
$53,525
State:
$62,766
(% of AGI for various income ranges: 1452.5% for AGIs below $25k, 3244.0% for AGIs $25k-50k, 8677.5% for AGIs $50k-75k, 25155.0% for AGIs $100k-200k)
Taxable interest for individuals: $475 (reported on 30.8% of returns)
This zip code:
$475
Texas:
$2,665
(% of AGI for various income ranges: 35.0% for AGIs below $25k, 27.5% for AGIs $50k-75k, 65.0% for AGIs $100k-200k)
Ordinary dividends: $2,180 (reported on 19.2% of returns)
Here:
$2,180
State:
$10,044
(% of AGI for various income ranges: 272.5% for AGIs $50k-75k)
Net capital gain/loss in AGI: +$2,000 (reported on 15.4% of returns)
Here:
+$2,000
State:
+$39,590
(% of AGI for various income ranges: 200.0% for AGIs $50k-75k)
Profit/loss from business: +$11,075 (reported on 15.4% of returns)
Here:
+$11,075
State:
+$10,888
(% of AGI for various income ranges: 886.0% for AGIs $25k-50k)
Taxable individual retirement arrangement distribution: $13,050 (reported on 7.7% of returns)
76519:
$13,050
Texas:
$24,740
(% of AGI for various income ranges: 522.0% for AGIs $25k-50k)
Earned income credit: $1,700 (reported on 11.5% of returns)
Here:
$1,700
State:
$2,584
(% of AGI for various income ranges: 127.5% for AGIs below $25k)
Percentage of individuals using paid preparers for their 2020 taxes: 92.3%
Here:
92%
State:
92%
(% for various income ranges: 87.5% for AGIs below $25k, 100.0% for AGIs $25k-50k, 120.0% for AGIs $50k-75k, 0.0% for AGIs $75k-100k, 100.0% for AGIs $100k-200k)
Averages for the 2012 tax year for zip code 76519, filed in 2013:
Average Adjusted Gross Income (AGI) in 2012: $41,885 (Individual Income Tax Returns)
Here:
$41,885
State:
$65,384
Salary/wage: $38,545 (reported on 76.9% of returns)
Here:
$38,545
State:
$52,524
(% of AGI for various income ranges: 70.5% for AGIs below $25k, 78.1% for AGIs $25k-50k, 84.2% for AGIs $50k-75k, 80.9% for AGIs $75k-100k, 52.1% for AGIs $100k-200k)
Taxable interest for individuals: $580 (reported on 38.5% of returns)
This zip code:
$580
Texas:
$2,372
(% of AGI for various income ranges: 1.3% for AGIs below $25k, 1.1% for AGIs $25k-50k, 0.6% for AGIs $75k-100k)
Ordinary dividends: $1,800 (reported on 15.4% of returns)
Here:
$1,800
State:
$9,721
Net capital gain/loss in AGI: +$1,350 (reported on 15.4% of returns)
Here:
+$1,350
State:
+$35,319
Profit/loss from business: +$8,900 (reported on 11.5% of returns)
Here:
+$8,900
State:
+$13,732
Taxable individual retirement arrangement distribution: $6,900 (reported on 7.7% of returns)
76519:
$6,900
Texas:
$19,511
Total itemized deductions: $16,600 (21% of AGI, reported on 11.5% of returns)
Here:
$16,600
State:
$24,724
Here:
21.0% of AGI
State:
15.9% of AGI
Charity contributions: $3,800 (reported on 7.7% of returns)
Here:
$3,800
State:
$6,808
Taxes paid: $5,200 (reported on 7.7% of returns)
76519:
$5,200
State:
$6,921
Earned income credit: $2,500 (reported on 15.4% of returns)
Here:
$2,500
State:
$2,570
(% of AGI for various income ranges: 8.1% for AGIs below $25k)
Percentage of individuals using paid preparers for their 2012 taxes: 69.2%
Here:
69%
State:
51%
(% for various income ranges: 72.7% for AGIs below $25k, 62.5% for AGIs $25k-50k, 66.7% for AGIs $50k-75k, 150.0% for AGIs $75k-100k)
Averages for the 2004 tax year for zip code 76519, filed in 2005:
Average Adjusted Gross Income (AGI) in 2004: $31,540 (Individual Income Tax Returns)
Here:
$31,540
State:
$47,881
Salary/wage: $34,311 (reported on 73.2% of returns)
Here:
$34,311
State:
$41,947
(% of AGI for various income ranges: 217.3% for AGIs below $10k, 75.6% for AGIs $10k-25k, 84.3% for AGIs $25k-50k, 71.6% for AGIs $50k-75k, 78.7% for AGIs $75k-100k)
Taxable interest for individuals: $1,383 (reported on 48.0% of returns)
This zip code:
$1,383
Texas:
$2,255
(% of AGI for various income ranges: 21.0% for AGIs below $10k, 5.7% for AGIs $10k-25k, 1.5% for AGIs $25k-50k, 1.7% for AGIs $50k-75k, 0.6% for AGIs $75k-100k)
Taxable dividends: $655 (reported on 22.0% of returns)
Here:
$655
State:
$4,261
Profit/loss from business: +$1,853 (reported on 13.6% of returns)
Here:
+$1,853
State:
+$11,013
Total itemized deductions: $12,824 (25% of AGI, reported on 6.8% of returns)
Here:
$12,824
State:
$19,631
Here:
24.5% of AGI
State:
18.9% of AGI
Total tax: $4,649 (reported on 67.2% of returns)
76519:
$4,649
State:
$9,058
(% of AGI for various income ranges: 14.8% for AGIs below $10k, 4.0% for AGIs $10k-25k, 6.4% for AGIs $25k-50k, 9.1% for AGIs $50k-75k, 16.1% for AGIs $75k-100k)
Earned income credit: $1,775 (reported on 16.0% of returns)
Here:
$1,775
State:
$2,024
Percentage of individuals using paid preparers for their 2004 taxes: 69.2%
Here:
69%
State:
57%
(% for various income ranges: 69.2% for AGIs below $10k, 71.8% for AGIs $10k-25k, 64.5% for AGIs $25k-50k, 75.9% for AGIs $50k-75k, 65.2% for AGIs $75k-100k)
Household received Food Stamps/SNAP in the past 12 months: 0 Household did not receive Food Stamps/SNAP in the past 12 months: 185
Women who did not have a birth in the past 12 months: 64 (63 now married, 0 unmarried)
Housing units in zip code 76519 with a mortgage: 78 (24 second mortgage) Median monthly owner costs for units with a mortgage: $2,474 Median monthly owner costs for units without a mortgage: $553
Residents with income below the poverty level in 2022:
This zip code:
2.6%
Whole state:
14.0%
Median number of rooms in houses and condos:
Here:
5.5
State:
6.3
Notable locations in this zip code not listed on our city pages
Cemeteries: Elm Grove Cemetery (1), Saint Joseph Cemetery (2), Saint Michaels Cemetery (3), Vogel-Sang Cemetery (4), Burlington Cemetery (5), Bentsch Cemetery (6), Burlington-Black Cemetery (7). Display/hide their locations on the map
Size of family households: 98 2-persons, 17 3-persons, 37 5-persons
Size of nonfamily households: 32 1-person
122 married couples with children.
0 single-parent households ().
95.8% of residents of 76519 zip code speak English at home.
4.5% of residents speak Spanish at home (100% very well).
Foreign born population: 0 (0.0%)
:
0.0%
Whole state:
17.2%
21%European
20%German
18%English
14%American
8%Polish
Housing units lacking complete plumbing facilities: 31.0% Housing units lacking complete kitchen facilities: 37.0%
65.9%Bottled, tank, or LP gas
24.4%Electricity
10.2%Other fuel
Population in 1990: 1,312.
Place of birth for U.S.-born residents:
This state: 396
Midwest: 14
South: 80
69% of the 76519 zip code residents lived in the same house 5 years ago. Out of people who lived in different houses, 50% lived in this county. Out of people who lived in different counties, 50% lived in Texas.
89% of the 76519 zip code residents lived in the same house 1 year ago. Out of people who lived in different houses, 115% moved from different state.
Private vs. public school enrollment:
Students in private schools in grades 1 to 8 (elementary and middle school):
Here:
0.0%
Texas:
8.8%
Students in private schools in grades 9 to 12 (high school):
Here:
0.0%
Texas:
8.0%
Top industries in this zip code by the number of employees in 2005:
Other Services (except Public Administration): Religious Organizations (1-4 employees: 1 establishment)
Other Services (except Public Administration): General Automotive Repair (1-4: 1)
Accommodation and Food Services: Full-Service Restaurants (1-4: 1)
Finance and Insurance: Insurance Agencies and Brokerages (1-4: 1)
Construction: Electrical Contractors (1-4: 1)
Administrative and Support and Waste Management and Remediation Services: Remediation Services (1-4: 1)
Fatal accident statistics in 2014:
Fatal accident count: 1
Vehicles involved in fatal accidents: 2
Fatal accidents caused by drunken drivers: 0
Fatalities: 1
Persons involved in fatal accidents: 2
Pedestrians involved in fatal accidents: 0
Fatal accident statistics in 2010:
Fatal accident count: 1
Vehicles involved in fatal accidents: 3
Fatal accidents caused by drunken drivers: 1
Fatalities: 1
Persons involved in fatal accidents: 4
Pedestrians involved in fatal accidents: 0
Home Mortgage Disclosure Act Aggregated Statistics For Year 2009 (Based on 2 partial tracts)
A) FHA, FSA/RHS & VA Home Purchase Loans
B) Conventional Home Purchase Loans
C) Refinancings
D) Home Improvement Loans
F) Non-occupant Loans on < 5 Family Dwellings (A B C & D)
G) Loans On Manufactured Home Dwelling (A B C & D)
Number
Average Value
Number
Average Value
Number
Average Value
Number
Average Value
Number
Average Value
Number
Average Value
LOANS ORIGINATED
10
$128,703
5
$121,554
13
$137,233
4
$38,885
2
$83,025
0
$0
APPLICATIONS APPROVED, NOT ACCEPTED
1
$112,370
0
$0
1
$87,020
1
$10,050
0
$0
0
$0
APPLICATIONS DENIED
2
$97,870
1
$91,130
6
$136,317
2
$15,875
0
$0
1
$34,950
APPLICATIONS WITHDRAWN
1
$156,680
0
$0
3
$112,907
0
$0
0
$0
0
$0
FILES CLOSED FOR INCOMPLETENESS
0
$0
0
$0
2
$122,310
0
$0
0
$0
0
$0
Aggregated Statistics For Year 2008 (Based on 2 partial tracts)
A) FHA, FSA/RHS & VA Home Purchase Loans
B) Conventional Home Purchase Loans
C) Refinancings
D) Home Improvement Loans
F) Non-occupant Loans on < 5 Family Dwellings (A B C & D)
G) Loans On Manufactured Home Dwelling (A B C & D)
Number
Average Value
Number
Average Value
Number
Average Value
Number
Average Value
Number
Average Value
Number
Average Value
LOANS ORIGINATED
9
$109,201
6
$136,088
5
$113,286
3
$31,063
2
$46,595
2
$78,455
APPLICATIONS APPROVED, NOT ACCEPTED
0
$0
1
$136,810
2
$107,120
1
$9,590
0
$0
1
$63,950
APPLICATIONS DENIED
2
$94,445
3
$86,563
7
$97,429
4
$42,882
1
$28,090
2
$61,440
APPLICATIONS WITHDRAWN
0
$0
2
$68,175
2
$150,860
1
$59,610
0
$0
0
$0
FILES CLOSED FOR INCOMPLETENESS
0
$0
0
$0
1
$148,230
0
$0
0
$0
0
$0
Aggregated Statistics For Year 2007 (Based on 2 partial tracts)
A) FHA, FSA/RHS & VA Home Purchase Loans
B) Conventional Home Purchase Loans
C) Refinancings
D) Home Improvement Loans
F) Non-occupant Loans on < 5 Family Dwellings (A B C & D)
G) Loans On Manufactured Home Dwelling (A B C & D)
Number
Average Value
Number
Average Value
Number
Average Value
Number
Average Value
Number
Average Value
Number
Average Value
LOANS ORIGINATED
8
$104,036
12
$93,892
10
$116,004
4
$38,885
3
$114,047
4
$70,232
APPLICATIONS APPROVED, NOT ACCEPTED
0
$0
2
$90,790
1
$135,900
1
$58,240
0
$0
2
$48,990
APPLICATIONS DENIED
0
$0
4
$91,588
11
$94,059
7
$41,111
1
$105,750
3
$59,537
APPLICATIONS WITHDRAWN
0
$0
2
$72,860
4
$95,528
1
$60,750
0
$0
0
$0
FILES CLOSED FOR INCOMPLETENESS
0
$0
0
$0
2
$102,550
0
$0
0
$0
0
$0
Aggregated Statistics For Year 2006 (Based on 2 partial tracts)
A) FHA, FSA/RHS & VA Home Purchase Loans
B) Conventional Home Purchase Loans
C) Refinancings
D) Home Improvement Loans
F) Non-occupant Loans on < 5 Family Dwellings (A B C & D)
G) Loans On Manufactured Home Dwelling (A B C & D)
Number
Average Value
Number
Average Value
Number
Average Value
Number
Average Value
Number
Average Value
Number
Average Value
LOANS ORIGINATED
9
$102,679
15
$102,521
6
$123,755
2
$61,895
3
$76,287
5
$78,022
APPLICATIONS APPROVED, NOT ACCEPTED
0
$0
4
$76,858
3
$72,783
0
$0
0
$0
2
$33,690
APPLICATIONS DENIED
1
$94,100
7
$67,704
9
$90,472
5
$51,482
2
$63,495
5
$62,398
APPLICATIONS WITHDRAWN
0
$0
3
$74,460
8
$111,116
1
$74,230
0
$0
0
$0
FILES CLOSED FOR INCOMPLETENESS
0
$0
1
$55,500
1
$161,940
0
$0
0
$0
0
$0
Aggregated Statistics For Year 2005 (Based on 2 partial tracts)
A) FHA, FSA/RHS & VA Home Purchase Loans
B) Conventional Home Purchase Loans
C) Refinancings
D) Home Improvement Loans
F) Non-occupant Loans on < 5 Family Dwellings (A B C & D)
G) Loans On Manufactured Home Dwelling (A B C & D)
Number
Average Value
Number
Average Value
Number
Average Value
Number
Average Value
Number
Average Value
Number
Average Value
LOANS ORIGINATED
10
$92,251
15
$98,364
11
$111,168
6
$44,120
4
$59,782
4
$60,412
APPLICATIONS APPROVED, NOT ACCEPTED
0
$0
2
$73,775
3
$95,547
1
$24,900
0
$0
1
$37,910
APPLICATIONS DENIED
1
$90,450
4
$55,558
14
$93,056
4
$45,052
1
$89,300
4
$48,020
APPLICATIONS WITHDRAWN
1
$90,220
3
$103,997
7
$110,056
1
$180,210
0
$0
0
$0
FILES CLOSED FOR INCOMPLETENESS
0
$0
0
$0
3
$94,330
0
$0
0
$0
0
$0
Aggregated Statistics For Year 2004 (Based on 2 partial tracts)
A) FHA, FSA/RHS & VA Home Purchase Loans
B) Conventional Home Purchase Loans
C) Refinancings
D) Home Improvement Loans
F) Non-occupant Loans on < 5 Family Dwellings (A B C & D)
G) Loans On Manufactured Home Dwelling (A B C & D)
Number
Average Value
Number
Average Value
Number
Average Value
Number
Average Value
Number
Average Value
Number
Average Value
LOANS ORIGINATED
7
$77,101
14
$80,201
17
$90,890
4
$27,350
4
$50,078
5
$69,570
APPLICATIONS APPROVED, NOT ACCEPTED
0
$0
3
$75,600
3
$86,107
1
$38,830
0
$0
1
$42,940
APPLICATIONS DENIED
1
$99,130
5
$59,246
12
$89,514
5
$43,214
1
$68,060
5
$49,334
APPLICATIONS WITHDRAWN
0
$0
1
$87,480
9
$83,798
1
$46,820
0
$0
0
$0
FILES CLOSED FOR INCOMPLETENESS
0
$0
1
$46,140
2
$118,995
0
$0
0
$0
0
$0
Aggregated Statistics For Year 2003 (Based on 2 partial tracts)
A) FHA, FSA/RHS & VA Home Purchase Loans
B) Conventional Home Purchase Loans
C) Refinancings
D) Home Improvement Loans
F) Non-occupant Loans on < 5 Family Dwellings (A B C & D)
Number
Average Value
Number
Average Value
Number
Average Value
Number
Average Value
Number
Average Value
LOANS ORIGINATED
8
$70,832
15
$76,560
25
$97,956
5
$30,652
3
$56,567
APPLICATIONS APPROVED, NOT ACCEPTED
1
$116,940
1
$41,340
3
$70,423
1
$17,820
0
$0
APPLICATIONS DENIED
0
$0
5
$77,336
13
$69,434
3
$24,363
1
$81,540
APPLICATIONS WITHDRAWN
1
$46,370
2
$81,880
10
$82,658
0
$0
0
$0
FILES CLOSED FOR INCOMPLETENESS
0
$0
0
$0
1
$89,760
0
$0
0
$0
Aggregated Statistics For Year 2002 (Based on 2 partial tracts)
A) FHA, FSA/RHS & VA Home Purchase Loans
B) Conventional Home Purchase Loans
C) Refinancings
D) Home Improvement Loans
F) Non-occupant Loans on < 5 Family Dwellings (A B C & D)
Number
Average Value
Number
Average Value
Number
Average Value
Number
Average Value
Number
Average Value
LOANS ORIGINATED
6
$90,675
12
$67,302
20
$80,956
4
$24,095
2
$52,075
APPLICATIONS APPROVED, NOT ACCEPTED
1
$44,770
1
$98,670
3
$88,087
0
$0
0
$0
APPLICATIONS DENIED
1
$37,910
3
$58,927
10
$65,711
2
$15,645
0
$0
APPLICATIONS WITHDRAWN
1
$82,220
1
$68,520
7
$78,830
1
$59,380
0
$0
FILES CLOSED FOR INCOMPLETENESS
0
$0
0
$0
1
$64,410
0
$0
0
$0
Aggregated Statistics For Year 2001 (Based on 2 partial tracts)
A) FHA, FSA/RHS & VA Home Purchase Loans
B) Conventional Home Purchase Loans
C) Refinancings
D) Home Improvement Loans
F) Non-occupant Loans on < 5 Family Dwellings (A B C & D)
Number
Average Value
Number
Average Value
Number
Average Value
Number
Average Value
Number
Average Value
LOANS ORIGINATED
4
$81,882
19
$70,948
17
$88,767
3
$11,420
1
$77,430
APPLICATIONS APPROVED, NOT ACCEPTED
0
$0
3
$38,523
3
$49,410
1
$5,940
0
$0
APPLICATIONS DENIED
1
$40,880
12
$56,738
9
$62,759
3
$4,567
1
$25,350
APPLICATIONS WITHDRAWN
1
$92,500
2
$60,185
6
$59,650
1
$27,640
0
$0
FILES CLOSED FOR INCOMPLETENESS
0
$0
1
$55,730
1
$107,800
0
$0
0
$0
Aggregated Statistics For Year 2000 (Based on 2 partial tracts)
A) FHA, FSA/RHS & VA Home Purchase Loans
B) Conventional Home Purchase Loans
C) Refinancings
D) Home Improvement Loans
F) Non-occupant Loans on < 5 Family Dwellings (A B C & D)
Number
Average Value
Number
Average Value
Number
Average Value
Number
Average Value
Number
Average Value
LOANS ORIGINATED
3
$94,787
17
$70,495
6
$71,298
1
$9,360
2
$66,120
APPLICATIONS APPROVED, NOT ACCEPTED
0
$0
2
$66,010
3
$47,050
0
$0
0
$0
APPLICATIONS DENIED
1
$68,290
16
$48,778
5
$60,892
3
$12,563
1
$50,930
APPLICATIONS WITHDRAWN
1
$80,400
2
$66,235
3
$36,850
0
$0
0
$0
FILES CLOSED FOR INCOMPLETENESS
1
$51,620
1
$62,350
0
$0
0
$0
0
$0
Aggregated Statistics For Year 1999 (Based on 1 partial tract)
A) FHA, FSA/RHS & VA Home Purchase Loans
B) Conventional Home Purchase Loans
C) Refinancings
D) Home Improvement Loans
F) Non-occupant Loans on < 5 Family Dwellings (A B C & D)


 Nearest zip codes: 76569, 76501, 76518, 76570, 76656, 76579.


