Estimated zip code population in 2022: 3,392 Zip code population in 2010: 2,498 Zip code population in 2000: 2,489
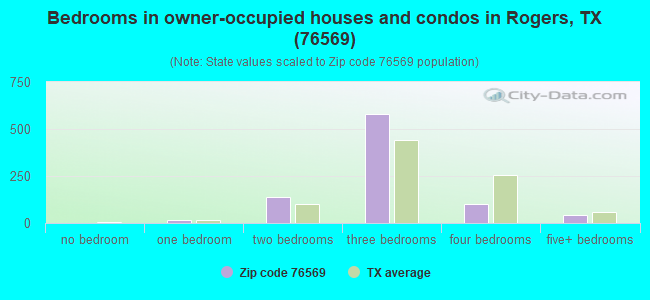
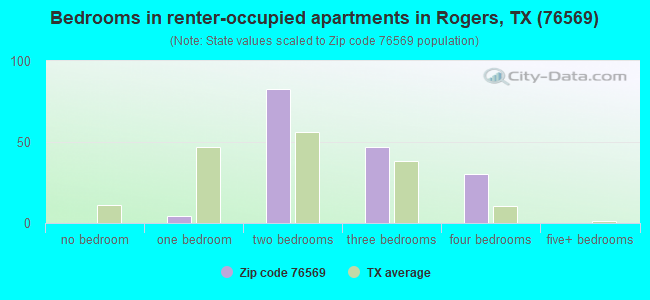
Houses and condos: 1,168 Renter-occupied apartments: 166
% of renters here:
16%
State:
38%
March 2022 cost of living index in zip code 76569: 78.3 (low, U.S. average is 100)
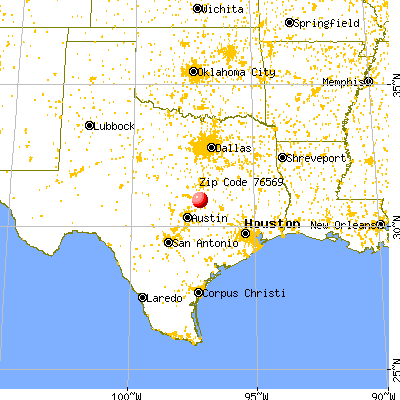
Land area: 81.5 sq. mi. Water area: 0.9 sq. mi.
Population density: 42 people per square mile
(very low).
OSM Map
General Map
Google Map
MSN Map
OSM Map
General Map
Google Map
MSN Map
OSM Map
General Map
Google Map
MSN Map
OSM Map
General Map
Google Map
MSN Map
Please wait while loading the map...
Real estate property taxes paid for housing units in 2022:
This zip code:
1.4% ($1,721)
Texas:
1.5% ($4,050)
Median real estate property taxes paid for housing units with mortgages in 2022: $2,480 (1.5%) Median real estate property taxes paid for housing units with no mortgage in 2022: $999 (1.0%)
Business Search- 14 Million verified businesses
Males: 1,738
(51.3%)
Females: 1,653
(48.7%)
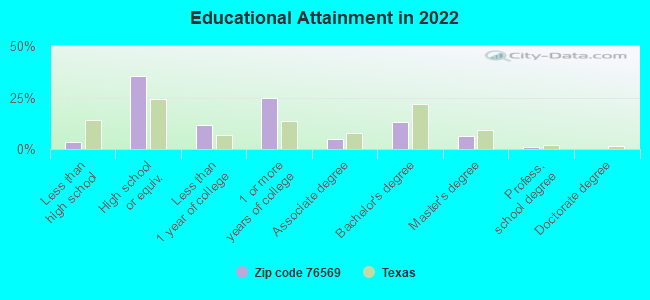
For population 25 years and over in 76569:
High school or higher: 95.9%
Bachelor's degree or higher: 20.5%
Graduate or professional degree: 7.4%
Unemployed: 2.1%
Mean travel time to work (commute): 31.9 minutes
For population 15 years and over in 76569:
Never married: 30.0%
Now married: 52.4%
Separated: 0.1%
Widowed: 3.0%
Divorced: 14.4%
Zip code 76569 compared to state average:
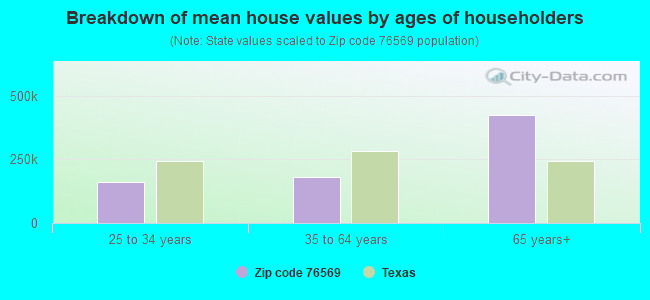
Median house value significantly below state average.
Unemployed percentage below state average.
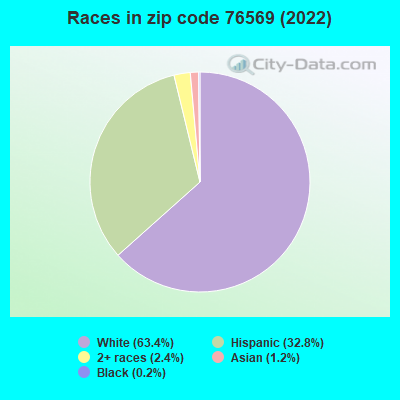
Black race population percentage significantly below state average.
Median age above state average.
Foreign-born population percentage significantly below state average.
Renting percentage significantly below state average.
Length of stay since moving in significantly above state average.
Percentage of population with a bachelor's degree or higher below state average.
Averages for the 2020 tax year for zip code 76569, filed in 2021:
Average Adjusted Gross Income (AGI) in 2020: $55,594 (Individual Income Tax Returns)
Here:
$55,594
State:
$77,054
Salary/wage: $51,759 (reported on 79.8% of returns)
Here:
$51,759
State:
$62,766
(% of AGI for various income ranges: 1082.1% for AGIs below $25k, 3463.3% for AGIs $25k-50k, 6371.5% for AGIs $50k-75k, 9592.2% for AGIs $75k-100k, 14988.2% for AGIs $100k-200k)
Taxable interest for individuals: $755 (reported on 23.4% of returns)
This zip code:
$755
Texas:
$2,665
(% of AGI for various income ranges: 17.9% for AGIs below $25k, 16.3% for AGIs $25k-50k, 31.5% for AGIs $50k-75k, 30.0% for AGIs $75k-100k, 29.1% for AGIs $100k-200k)
Ordinary dividends: $1,385 (reported on 10.5% of returns)
Here:
$1,385
State:
$10,044
(% of AGI for various income ranges: 8.3% for AGIs below $25k, 86.9% for AGIs $50k-75k, 39.1% for AGIs $100k-200k)
Net capital gain/loss in AGI: +$6,807 (reported on 11.3% of returns)
Here:
+$6,807
State:
+$39,590
(% of AGI for various income ranges: 14.8% for AGIs below $25k, 156.2% for AGIs $50k-75k, 642.7% for AGIs $100k-200k)
Profit/loss from business: +$10,526 (reported on 18.5% of returns)
Here:
+$10,526
State:
+$10,888
(% of AGI for various income ranges: 233.8% for AGIs below $25k, 190.0% for AGIs $25k-50k, 266.2% for AGIs $50k-75k, 275.6% for AGIs $75k-100k, 578.2% for AGIs $100k-200k)
Taxable individual retirement arrangement distribution: $16,945 (reported on 8.9% of returns)
76569:
$16,945
Texas:
$24,740
(% of AGI for various income ranges: 125.5% for AGIs below $25k, 669.2% for AGIs $50k-75k, 572.7% for AGIs $100k-200k)
Total itemized deductions: $41,200 (reported on 1.6% of returns)
Here:
$41,200
State:
$40,428
(% of AGI for various income ranges: 915.6% for AGIs $75k-100k)
Taxes paid: $6,950 (reported on 1.6% of returns)
76569:
$6,950
State:
$7,821
(% of AGI for various income ranges: 154.4% for AGIs $75k-100k)
Earned income credit: $2,668 (reported on 20.2% of returns)
Here:
$2,668
State:
$2,584
(% of AGI for various income ranges: 121.7% for AGIs below $25k, 116.3% for AGIs $25k-50k)
Percentage of individuals using paid preparers for their 2020 taxes: 92.7%
Here:
93%
State:
92%
(% for various income ranges: 90.2% for AGIs below $25k, 93.9% for AGIs $25k-50k, 88.9% for AGIs $50k-75k, 100.0% for AGIs $75k-100k, 93.8% for AGIs $100k-200k, 100.0% for AGIs over 200k)
Averages for the 2012 tax year for zip code 76569, filed in 2013:
Average Adjusted Gross Income (AGI) in 2012: $43,714 (Individual Income Tax Returns)
Here:
$43,714
State:
$65,384
Salary/wage: $39,379 (reported on 87.6% of returns)
Here:
$39,379
State:
$52,524
(% of AGI for various income ranges: 76.9% for AGIs below $25k, 85.5% for AGIs $25k-50k, 84.8% for AGIs $50k-75k, 81.4% for AGIs $75k-100k, 70.5% for AGIs $100k-200k)
Taxable interest for individuals: $579 (reported on 25.7% of returns)
This zip code:
$579
Texas:
$2,372
(% of AGI for various income ranges: 0.6% for AGIs below $25k, 0.5% for AGIs $25k-50k, 0.3% for AGIs $50k-75k, 0.1% for AGIs $75k-100k, 0.3% for AGIs $100k-200k)
Ordinary dividends: $992 (reported on 11.5% of returns)
Here:
$992
State:
$9,721
(% of AGI for various income ranges: 0.7% for AGIs below $25k, 0.3% for AGIs $25k-50k, 0.2% for AGIs $50k-75k, 0.3% for AGIs $100k-200k)
Net capital gain/loss in AGI: +$940 (reported on 8.8% of returns)
Here:
+$940
State:
+$35,319
(% of AGI for various income ranges: 0.2% for AGIs $25k-50k, 0.4% for AGIs $50k-75k, 0.2% for AGIs $100k-200k)
Profit/loss from business: +$6,690 (reported on 17.7% of returns)
Here:
+$6,690
State:
+$13,732
(% of AGI for various income ranges: 9.8% for AGIs below $25k, 2.0% for AGIs $25k-50k, 2.2% for AGIs $50k-75k, 4.4% for AGIs $75k-100k)
Taxable individual retirement arrangement distribution: $14,911 (reported on 8.0% of returns)
76569:
$14,911
Texas:
$19,511
Total itemized deductions: $18,962 (21% of AGI, reported on 14.2% of returns)
Here:
$18,962
State:
$24,724
Here:
20.6% of AGI
State:
15.9% of AGI
(% of AGI for various income ranges: 5.4% for AGIs $25k-50k, 7.8% for AGIs $50k-75k, 5.8% for AGIs $75k-100k, 8.2% for AGIs $100k-200k)
Charity contributions: $4,342 (reported on 10.6% of returns)
Here:
$4,342
State:
$6,808
(% of AGI for various income ranges: 0.5% for AGIs $25k-50k, 1.7% for AGIs $50k-75k, 2.0% for AGIs $100k-200k)
Taxes paid: $4,094 (reported on 14.2% of returns)
76569:
$4,094
State:
$6,921
(% of AGI for various income ranges: 1.1% for AGIs $25k-50k, 1.4% for AGIs $50k-75k, 1.2% for AGIs $75k-100k, 2.1% for AGIs $100k-200k)
Earned income credit: $2,493 (reported on 25.7% of returns)
Here:
$2,493
State:
$2,570
(% of AGI for various income ranges: 9.0% for AGIs below $25k, 1.7% for AGIs $25k-50k)
Percentage of individuals using paid preparers for their 2012 taxes: 61.1%
Here:
61%
State:
51%
(% for various income ranges: 61.2% for AGIs below $25k, 60.0% for AGIs $25k-50k, 64.3% for AGIs $50k-75k, 55.6% for AGIs $75k-100k, 63.6% for AGIs $100k-200k)
Averages for the 2004 tax year for zip code 76569, filed in 2005:
Average Adjusted Gross Income (AGI) in 2004: $34,500 (Individual Income Tax Returns)
Here:
$34,500
State:
$47,881
Salary/wage: $33,257 (reported on 85.7% of returns)
Here:
$33,257
State:
$41,947
(% of AGI for various income ranges: 172.5% for AGIs below $10k, 81.8% for AGIs $10k-25k, 86.7% for AGIs $25k-50k, 84.3% for AGIs $50k-75k, 90.4% for AGIs $75k-100k, 57.7% for AGIs over 100k)
Taxable interest for individuals: $1,029 (reported on 32.2% of returns)
This zip code:
$1,029
Texas:
$2,255
(% of AGI for various income ranges: 8.0% for AGIs below $10k, 1.1% for AGIs $10k-25k, 1.3% for AGIs $25k-50k, 0.6% for AGIs $50k-75k, 0.3% for AGIs $75k-100k, 0.9% for AGIs over 100k)
Taxable dividends: $603 (reported on 12.9% of returns)
Here:
$603
State:
$4,261
(% of AGI for various income ranges: 2.4% for AGIs below $10k, 0.2% for AGIs $10k-25k, 0.3% for AGIs $25k-50k, 0.1% for AGIs $50k-75k, 0.0% for AGIs $75k-100k, 0.2% for AGIs over 100k)
Net capital gain/loss: +$3,413 (reported on 13.1% of returns)
Here:
+$3,413
State:
+$16,110
(% of AGI for various income ranges: 4.4% for AGIs below $10k, -0.3% for AGIs $10k-25k, 0.6% for AGIs $25k-50k, -0.0% for AGIs $50k-75k, 0.5% for AGIs $75k-100k, 6.1% for AGIs over 100k)
Profit/loss from business: +$5,534 (reported on 14.0% of returns)
Here:
+$5,534
State:
+$11,013
(% of AGI for various income ranges: -13.8% for AGIs below $10k, 5.9% for AGIs $10k-25k, 1.8% for AGIs $25k-50k, 4.3% for AGIs $50k-75k, 0.6% for AGIs $75k-100k, 0.5% for AGIs over 100k)
Total itemized deductions: $13,958 (19% of AGI, reported on 13.5% of returns)
Here:
$13,958
State:
$19,631
Here:
19.4% of AGI
State:
18.9% of AGI
(% of AGI for various income ranges: 2.4% for AGIs $10k-25k, 6.0% for AGIs $25k-50k, 5.3% for AGIs $50k-75k, 7.6% for AGIs $75k-100k, 5.6% for AGIs over 100k)
Charity contributions deductions: $3,945 (5% of AGI, reported on 10.4% of returns)
Here:
$3,945
State:
$4,753
Here:
5.2% of AGI
State:
4.2% of AGI
(% of AGI for various income ranges: 1.0% for AGIs $25k-50k, 1.1% for AGIs $50k-75k, 1.5% for AGIs $75k-100k, 2.4% for AGIs over 100k)
Total tax: $4,658 (reported on 69.1% of returns)
76569:
$4,658
State:
$9,058
(% of AGI for various income ranges: 4.6% for AGIs below $10k, 3.7% for AGIs $10k-25k, 5.6% for AGIs $25k-50k, 9.1% for AGIs $50k-75k, 10.4% for AGIs $75k-100k, 19.1% for AGIs over 100k)
Earned income credit: $1,946 (reported on 21.2% of returns)
Here:
$1,946
State:
$2,024
Percentage of individuals using paid preparers for their 2004 taxes: 62.8%
Here:
63%
State:
57%
(% for various income ranges: 58.1% for AGIs below $10k, 63.6% for AGIs $10k-25k, 62.8% for AGIs $25k-50k, 65.4% for AGIs $50k-75k, 70.9% for AGIs $75k-100k, 61.5% for AGIs over 100k)
Likely homosexual households (counted as self-reported same-sex unmarried-partner households)
Lesbian couples: 0.3% of all households
Gay men: 0.0% of all households
Household received Food Stamps/SNAP in the past 12 months: 61 Household did not receive Food Stamps/SNAP in the past 12 months: 982
Women who had a birth in the past 12 months: 25 (26 now married, 0 unmarried) Women who did not have a birth in the past 12 months: 659 (312 now married, 347 unmarried)
Housing units in zip code 76569 with a mortgage: 420 (26 second mortgage, 28 both second mortgage and home equity loan) Houses without a mortgage: 41
Median monthly owner costs for units with a mortgage: $1,217 Median monthly owner costs for units without a mortgage: $398
Residents with income below the poverty level in 2022:
This zip code:
11.2%
Whole state:
14.0%
Residents with income below 50% of the poverty level in 2022:
This zip code:
6.6%
Whole state:
7.4%
Median number of rooms in houses and condos:
Here:
6.2
State:
6.3
Median number of rooms in apartments:
Here:
4.6
State:
4.0
Notable locations in this zip code not listed on our city pages
Cemeteries: McCann Cemetery (1), Reed Cemetery (2), Rogers Cemetery (3), Reeds Lake Cemetery (4), Taplin View Cemetery (5). Display/hide their locations on the map
Reservoirs: Zane Lake (A), Lansham Lake (B), Prewitt Lake 5 (C), Prewitt Lake 3 (D), Prewitt Lake 2 (E), Rogers Lake (F). Display/hide their locations on the map
Streams, rivers, and creeks: Boggy Creek (A), Anderson Branch (B), Cubhunt Branch (C), Whatley Branch (D), Camp Creek (E), Knob Creek (F). Display/hide their locations on the map
Size of family households: 437 2-persons, 160 3-persons, 165 4-persons, 96 5-persons, 31 6-persons, 37 7-or-more-persons
Size of nonfamily households: 93 1-person, 19 2-persons
582 married couples with children.
192 single-parent households (19 men, 173 women).
85.0% of residents of 76569 zip code speak English at home.
12.9% of residents speak Spanish at home (35% very well, 24% well, 41% not well).
0.9% of residents speak other Indo-European language at home (100% very well).
1.3% of residents speak Asian or Pacific Island language at home (19% very well, 81% well).
Foreign born population: 116 (3.4%) (46.4% of them are naturalized citizens)
This zip code:
3.4%
Whole state:
17.2%
43%Chile
28%Malaysia
25%Honduras
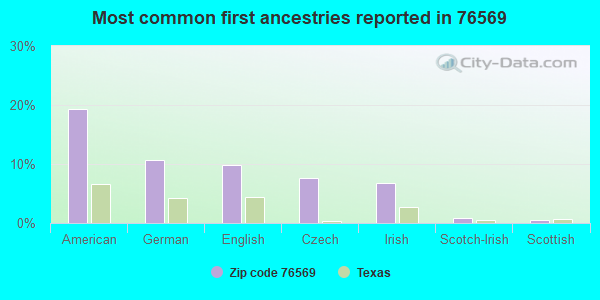
19%American
11%German
10%English
8%Czech
7%Irish
1%Scotch-Irish
0%Scottish
Year of entry for the foreign-born population
422010 or later
1262000 to 2009
471990 to 1999
56Before 1990
Housing units lacking complete plumbing facilities: 4.2% Housing units lacking complete kitchen facilities: 7.1%
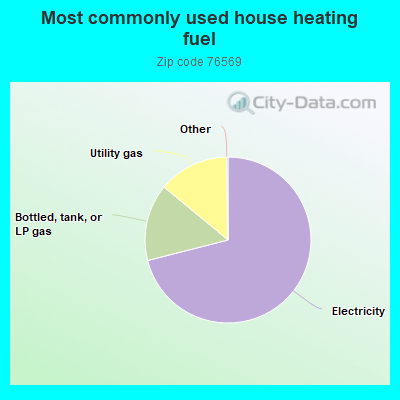
71.1%Electricity
15.0%Bottled, tank, or LP gas
13.7%Utility gas
Population in 1990: 2,565.
Place of birth for U.S.-born residents:
This state: 2,600
Northeast: 23
Midwest: 101
South: 125
West: 241
61% of the 76569 zip code residents lived in the same house 5 years ago. Out of people who lived in different houses, 68% lived in this county. Out of people who lived in different counties, 50% lived in Texas.
96% of the 76569 zip code residents lived in the same house 1 year ago. Out of people who lived in different houses, 83% moved from this county. Out of people who lived in different houses, 19% moved from different state.
Private vs. public school enrollment:
Students in private schools in grades 1 to 8 (elementary and middle school): 10
Here:
3.2%
Texas:
8.8%
Students in private schools in grades 9 to 12 (high school): 28
Here:
8.3%
Texas:
8.0%
Students in private undergraduate colleges: 121
Here:
55.1%
Texas:
16.2%
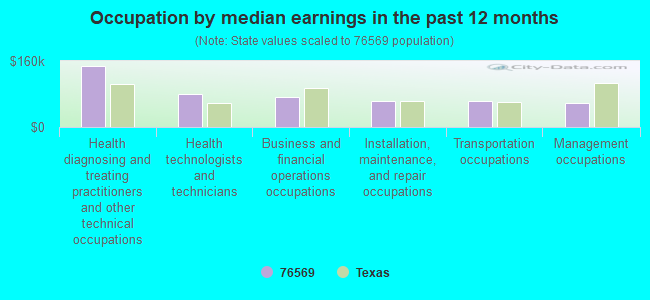
Occupation by median earnings in the past 12 months ($)
148,394Health diagnosing and treating practitioners and other technical occupations
80,588Health technologists and technicians
71,705Business and financial operations occupations
63,715Installation, maintenance, and repair occupations
62,398Transportation occupations
59,041Management occupations
Companies with federal contracts located in this zip code:
DALE WALZEL CONSTRUCTION (10 E SANTA FE in ROGERS, TX; small business) : $1,725,362 in 115 contractsfrom 2000 to 2006
Contracts for Maintenance, Repair or Alteration of Real Property -- Miscellaneous Buildings, Maintenance, Repair or Alteration of Real Property -- Other Non-Building Facilities by Army, U.S. Army Corps of Engineers - civil program financing only Signed by year:2000: $397,161; 2001: $246,187; 2002: $204,050; 2003: $243,253; 2004: $397,425; 2005: $157,677; 2006: $79,609.
Biggest contracts:
$117,453 with Army for Maintenance, Repair or Alteration of Real Property -- Miscellaneous Buildings. Signed on 2004-04-15. Completion date: 2004-11-26.
$63,265 with U.S. Army Corps of Engineers - civil program financing only for Maintenance, Repair or Alteration of Real Property -- Other Non-Building Facilities. Signed on 2000-03-13. Completion date: 2000-06-07.
$60,334 with Army for Maintenance, Repair or Alteration of Real Property -- Miscellaneous Buildings. Signed on 2004-02-10. Completion date: 2004-06-15.
$60,334 with U.S. Army Corps of Engineers - civil program financing only for Maintenance, Repair or Alteration of Real Property -- Miscellaneous Buildings. Signed on 2004-02-10. Completion date: 2004-06-15.
KATHERINE MH RICE (9433 EAST U S HWY 190 in ROGERS, TX; small business) : $54,738 in 13 contractsfrom 2002 to 2004
Contracts for Forage and Feed by Army Signed by year:2000: $0; 2001: $0; 2002: $20,530; 2003: $28,560; 2004: $5,648; 2005: $0; 2006: $0.
Biggest contracts:
$18,061 with Army for Forage and Feed. Signed on 2004-05-10. Completion date: 2004-09-30.
$12,240, same as above.Signed on 2003-06-19. Completion date: 2003-09-30.
$8,160, same as above.Signed on 2003-12-08. Completion date: 2004-03-15.
$8,160, same as above.Signed on 2003-01-14. Completion date: 2003-04-15.
Top industries in this zip code by the number of employees in 2005:
Construction: Tile and Terrazzo Contractors (10-19 employees: 1 establishment)
Construction: Site Preparation Contractors (5-9: 1, 1-4: 1)
Construction: Commercial and Institutional Building Construction (5-9: 1)
Arts, Entertainment, and Recreation: Independent Artists, Writers, and Performers (5-9: 1)
Construction: Painting and Wall Covering Contractors (1-4: 3)
Other Services (except Public Administration): Religious Organizations (1-4: 3)
Fatal accident statistics in 2012:
Fatal accident count: 1
Vehicles involved in fatal accidents: 2
Fatal accidents caused by drunken drivers: 1
Fatalities: 1
Persons involved in fatal accidents: 2
Pedestrians involved in fatal accidents: 0
Home Mortgage Disclosure Act Aggregated Statistics For Year 2009 (Based on 2 partial tracts)
A) FHA, FSA/RHS & VA Home Purchase Loans
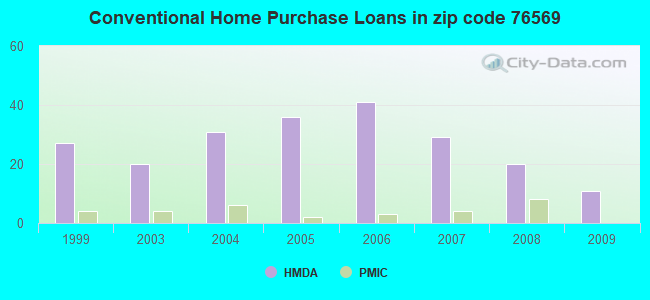
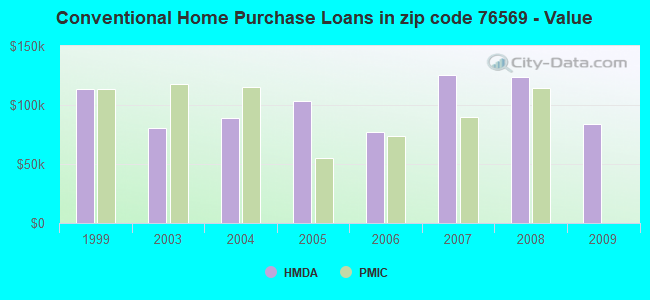
B) Conventional Home Purchase Loans
C) Refinancings
D) Home Improvement Loans
F) Non-occupant Loans on < 5 Family Dwellings (A B C & D)
G) Loans On Manufactured Home Dwelling (A B C & D)
Number
Average Value
Number
Average Value
Number
Average Value
Number
Average Value
Number
Average Value
Number
Average Value
LOANS ORIGINATED
15
$136,739
11
$83,727
34
$147,716
4
$54,510
4
$27,865
5
$58,416
APPLICATIONS APPROVED, NOT ACCEPTED
2
$44,340
0
$0
2
$122,445
1
$56,950
0
$0
2
$61,835
APPLICATIONS DENIED
2
$36,205
7
$46,027
13
$134,619
4
$36,612
0
$0
4
$46,985
APPLICATIONS WITHDRAWN
1
$67,530
1
$193,640
8
$150,414
0
$0
0
$0
0
$0
FILES CLOSED FOR INCOMPLETENESS
0
$0
0
$0
3
$223,197
2
$121,635
0
$0
0
$0
Aggregated Statistics For Year 2008 (Based on 2 partial tracts)
A) FHA, FSA/RHS & VA Home Purchase Loans
B) Conventional Home Purchase Loans
C) Refinancings
D) Home Improvement Loans
F) Non-occupant Loans on < 5 Family Dwellings (A B C & D)
G) Loans On Manufactured Home Dwelling (A B C & D)
Number
Average Value
Number
Average Value
Number
Average Value
Number
Average Value
Number
Average Value
Number
Average Value
LOANS ORIGINATED
12
$111,192
20
$123,545
19
$107,609
7
$55,673
5
$68,016
6
$54,782
APPLICATIONS APPROVED, NOT ACCEPTED
2
$125,295
3
$189,840
0
$0
1
$9,760
0
$0
1
$77,290
APPLICATIONS DENIED
2
$72,815
7
$79,849
21
$92,479
11
$21,227
2
$54,920
5
$56,138
APPLICATIONS WITHDRAWN
2
$75,260
2
$176,960
9
$117,791
0
$0
0
$0
2
$50,850
FILES CLOSED FOR INCOMPLETENESS
0
$0
1
$30,920
2
$81,360
0
$0
0
$0
1
$30,920
Aggregated Statistics For Year 2007 (Based on 2 partial tracts)
A) FHA, FSA/RHS & VA Home Purchase Loans
B) Conventional Home Purchase Loans
C) Refinancings
D) Home Improvement Loans
F) Non-occupant Loans on < 5 Family Dwellings (A B C & D)
G) Loans On Manufactured Home Dwelling (A B C & D)
Number
Average Value
Number
Average Value
Number
Average Value
Number
Average Value
Number
Average Value
Number
Average Value
LOANS ORIGINATED
8
$121,634
29
$125,322
15
$124,915
8
$27,662
6
$83,393
5
$71,760
APPLICATIONS APPROVED, NOT ACCEPTED
0
$0
6
$77,563
1
$61,020
7
$37,426
0
$0
4
$68,750
APPLICATIONS DENIED
2
$90,715
7
$70,783
20
$94,052
21
$74,038
4
$43,528
4
$62,038
APPLICATIONS WITHDRAWN
0
$0
2
$56,950
14
$110,301
2
$105,360
0
$0
0
$0
FILES CLOSED FOR INCOMPLETENESS
1
$160,280
0
$0
2
$140,345
0
$0
0
$0
1
$160,280
Aggregated Statistics For Year 2006 (Based on 2 partial tracts)
A) FHA, FSA/RHS & VA Home Purchase Loans
B) Conventional Home Purchase Loans
C) Refinancings
D) Home Improvement Loans
F) Non-occupant Loans on < 5 Family Dwellings (A B C & D)
G) Loans On Manufactured Home Dwelling (A B C & D)
Number
Average Value
Number
Average Value
Number
Average Value
Number
Average Value
Number
Average Value
Number
Average Value
LOANS ORIGINATED
16
$113,802
41
$77,193
12
$112,955
5
$39,052
7
$31,963
10
$54,999
APPLICATIONS APPROVED, NOT ACCEPTED
0
$0
6
$57,765
4
$97,632
2
$9,765
2
$32,950
2
$29,290
APPLICATIONS DENIED
3
$56,140
24
$55,698
27
$100,917
11
$33,284
5
$46,700
12
$43,257
APPLICATIONS WITHDRAWN
0
$0
7
$85,196
28
$98,359
1
$5,700
3
$61,563
2
$52,070
FILES CLOSED FOR INCOMPLETENESS
1
$31,730
0
$0
3
$117,430
0
$0
0
$0
0
$0
Aggregated Statistics For Year 2005 (Based on 2 partial tracts)
A) FHA, FSA/RHS & VA Home Purchase Loans
B) Conventional Home Purchase Loans
C) Refinancings
D) Home Improvement Loans
F) Non-occupant Loans on < 5 Family Dwellings (A B C & D)
G) Loans On Manufactured Home Dwelling (A B C & D)
Number
Average Value
Number
Average Value
Number
Average Value
Number
Average Value
Number
Average Value
Number
Average Value
LOANS ORIGINATED
12
$102,513
36
$103,553
32
$112,760
11
$88,016
6
$21,697
7
$59,044
APPLICATIONS APPROVED, NOT ACCEPTED
0
$0
11
$82,100
2
$55,730
2
$8,950
1
$14,640
6
$40,815
APPLICATIONS DENIED
1
$219,670
23
$58,261
38
$81,017
8
$18,001
4
$47,392
19
$45,733
APPLICATIONS WITHDRAWN
1
$189,570
6
$96,277
15
$102,459
2
$381,985
0
$0
1
$25,220
FILES CLOSED FOR INCOMPLETENESS
0
$0
1
$69,160
6
$110,243
0
$0
0
$0
0
$0
Aggregated Statistics For Year 2004 (Based on 2 partial tracts)
A) FHA, FSA/RHS & VA Home Purchase Loans
B) Conventional Home Purchase Loans
C) Refinancings
D) Home Improvement Loans
F) Non-occupant Loans on < 5 Family Dwellings (A B C & D)
G) Loans On Manufactured Home Dwelling (A B C & D)
Number
Average Value
Number
Average Value
Number
Average Value
Number
Average Value
Number
Average Value
Number
Average Value
LOANS ORIGINATED
15
$90,309
31
$89,312
37
$93,168
4
$31,730
5
$33,684
5
$42,144
APPLICATIONS APPROVED, NOT ACCEPTED
0
$0
3
$74,310
9
$55,867
5
$41,494
2
$68,750
6
$45,833
APPLICATIONS DENIED
2
$53,290
9
$72,139
31
$84,168
10
$70,620
3
$33,900
11
$59,466
APPLICATIONS WITHDRAWN
0
$0
2
$57,765
26
$74,538
2
$21,560
1
$87,060
1
$33,360
FILES CLOSED FOR INCOMPLETENESS
0
$0
0
$0
0
$0
1
$39,050
0
$0
0
$0
Aggregated Statistics For Year 2003 (Based on 2 partial tracts)
A) FHA, FSA/RHS & VA Home Purchase Loans
B) Conventional Home Purchase Loans
C) Refinancings
D) Home Improvement Loans
F) Non-occupant Loans on < 5 Family Dwellings (A B C & D)
Number
Average Value
Number
Average Value
Number
Average Value
Number
Average Value
Number
Average Value
LOANS ORIGINATED
8
$92,140
20
$80,750
67
$79,842
2
$84,210
6
$35,257
APPLICATIONS APPROVED, NOT ACCEPTED
1
$78,110
5
$40,842
4
$46,985
2
$24,000
0
$0
APPLICATIONS DENIED
0
$0
18
$52,071
31
$78,027
7
$24,060
1
$30,100
APPLICATIONS WITHDRAWN
2
$77,700
5
$104,466
23
$81,219
1
$33,360
0
$0
FILES CLOSED FOR INCOMPLETENESS
0
$0
0
$0
4
$98,445
0
$0
0
$0
Aggregated Statistics For Year 1999 (Based on 1 partial tract)
A) FHA, FSA/RHS & VA Home Purchase Loans
B) Conventional Home Purchase Loans
C) Refinancings
D) Home Improvement Loans
F) Non-occupant Loans on < 5 Family Dwellings (A B C & D)
Detailed PMIC statistics for the following Tracts:0234.02
2003 - 2018 National Fire Incident Reporting System (NFIRS) incidents
According to the data from the years 2003 - 2018 the average number of fires per year is 28. The highest number of fires - 77 took place in 2011, and the least - 1 in 2004. The data has a growing trend.
When looking into fire subcategories, the most incidents belonged to: Outside Fires (73.0%), and Structure Fires (14.5%).
Fire incident types reported to NFIRS in Zip Code 76569


 Nearest zip codes: 76518, 76519, 76501, 76554, 76534, 76523.


 : $1,725,362 in 115 contracts from 2000 to 2006


 According to the data from the years 2003 - 2018 the average number of fires per year is 28. The highest number of fires - 77 took place in 2011, and the least - 1 in 2004. The data has a growing trend.
 When looking into fire subcategories, the most incidents belonged to: Outside Fires (73.0%), and Structure Fires (14.5%).