Estimated zip code population in 2022: 2,103 Zip code population in 2010: 1,995 Zip code population in 2000: 1,952
Houses and condos: 816 Renter-occupied apartments: 169
% of renters here:
23%
State:
38%
March 2022 cost of living index in zip code 76861: 78.8 (low, U.S. average is 100)
Land area: 171.5 sq. mi. Water area: 0.1 sq. mi.
Population density: 12 people per square mile
(very low).
OSM Map
General Map
Google Map
MSN Map
OSM Map
General Map
Google Map
MSN Map
OSM Map
General Map
Google Map
MSN Map
OSM Map
General Map
Google Map
MSN Map
Please wait while loading the map...
Real estate property taxes paid for housing units in 2022:
This zip code:
0.9% ($1,606)
Texas:
1.5% ($4,050)
Median real estate property taxes paid for housing units with mortgages in 2022: $2,567 (1.2%) Median real estate property taxes paid for housing units with no mortgage in 2022: $1,304 (1.0%)
Business Search- 14 Million verified businesses
Males: 1,139
(54.2%)
Females: 964
(45.8%)
For population 25 years and over in 76861:
High school or higher: 83.2%
Bachelor's degree or higher: 23.3%
Graduate or professional degree: 5.1%
Unemployed: 2.4%
Mean travel time to work (commute): 27.6 minutes
For population 15 years and over in 76861:
Never married: 30.9%
Now married: 57.7%
Separated: 2.4%
Widowed: 2.7%
Divorced: 6.3%
Zip code 76861 compared to state average:
Median house value below state average.
Unemployed percentage below state average.
Black race population percentage significantly below state average.
Foreign-born population percentage below state average.
Renting percentage below state average.
Length of stay since moving in significantly above state average.
Averages for the 2020 tax year for zip code 76861, filed in 2021:
Average Adjusted Gross Income (AGI) in 2020: $65,290 (Individual Income Tax Returns)
Here:
$65,290
State:
$77,054
Salary/wage: $56,362 (reported on 82.8% of returns)
Here:
$56,362
State:
$62,766
(% of AGI for various income ranges: 1509.0% for AGIs below $25k, 4048.9% for AGIs $25k-50k, 7063.0% for AGIs $50k-75k, 9751.7% for AGIs $75k-100k, 16775.6% for AGIs $100k-200k)
Taxable interest for individuals: $1,354 (reported on 28.3% of returns)
This zip code:
$1,354
Texas:
$2,665
(% of AGI for various income ranges: 24.3% for AGIs below $25k, 9.4% for AGIs $25k-50k, 27.0% for AGIs $50k-75k, 91.7% for AGIs $75k-100k, 81.1% for AGIs $100k-200k)
Ordinary dividends: $3,923 (reported on 13.1% of returns)
Here:
$3,923
State:
$10,044
(% of AGI for various income ranges: 37.2% for AGIs $25k-50k, 111.7% for AGIs $75k-100k, 417.8% for AGIs $100k-200k)
Net capital gain/loss in AGI: +$9,979 (reported on 14.1% of returns)
Here:
+$9,979
State:
+$39,590
(% of AGI for various income ranges: 43.9% for AGIs $25k-50k, 101.7% for AGIs $75k-100k, 248.9% for AGIs $100k-200k)
Profit/loss from business: +$12,771 (reported on 17.2% of returns)
Here:
+$12,771
State:
+$10,888
(% of AGI for various income ranges: 94.3% for AGIs below $25k, 177.8% for AGIs $25k-50k, 373.0% for AGIs $50k-75k, 266.7% for AGIs $75k-100k, 1244.4% for AGIs $100k-200k)
Taxable individual retirement arrangement distribution: $13,100 (reported on 7.1% of returns)
76861:
$13,100
Texas:
$24,740
(% of AGI for various income ranges: 118.1% for AGIs below $25k, 311.0% for AGIs $50k-75k, 397.8% for AGIs $100k-200k)
Total itemized deductions: $43,350 (reported on 2.0% of returns)
Here:
$43,350
State:
$40,428
(% of AGI for various income ranges: 867.0% for AGIs $50k-75k)
Earned income credit: $2,547 (reported on 15.2% of returns)
Here:
$2,547
State:
$2,584
(% of AGI for various income ranges: 97.6% for AGIs below $25k, 98.3% for AGIs $25k-50k)
Percentage of individuals using paid preparers for their 2020 taxes: 90.9%
Here:
91%
State:
92%
(% for various income ranges: 90.9% for AGIs below $25k, 87.5% for AGIs $25k-50k, 92.9% for AGIs $50k-75k, 100.0% for AGIs $75k-100k, 93.3% for AGIs $100k-200k, 75.0% for AGIs over 200k)
Averages for the 2012 tax year for zip code 76861, filed in 2013:
Average Adjusted Gross Income (AGI) in 2012: $47,338 (Individual Income Tax Returns)
Here:
$47,338
State:
$65,384
Salary/wage: $41,499 (reported on 81.8% of returns)
Here:
$41,499
State:
$52,524
(% of AGI for various income ranges: 82.4% for AGIs below $25k, 80.3% for AGIs $25k-50k, 71.0% for AGIs $50k-75k, 72.5% for AGIs $75k-100k, 63.4% for AGIs $100k-200k)
Taxable interest for individuals: $1,104 (reported on 29.5% of returns)
This zip code:
$1,104
Texas:
$2,372
(% of AGI for various income ranges: 0.9% for AGIs below $25k, 0.6% for AGIs $25k-50k, 0.9% for AGIs $50k-75k, 0.4% for AGIs $75k-100k, 0.7% for AGIs $100k-200k)
Ordinary dividends: $1,646 (reported on 14.8% of returns)
Here:
$1,646
State:
$9,721
(% of AGI for various income ranges: 0.5% for AGIs below $25k, 0.2% for AGIs $25k-50k, 0.6% for AGIs $50k-75k, 1.1% for AGIs $75k-100k, 0.3% for AGIs $100k-200k)
Net capital gain/loss in AGI: +$8,033 (reported on 13.6% of returns)
Here:
+$8,033
State:
+$35,319
(% of AGI for various income ranges: 0.5% for AGIs below $25k, 2.3% for AGIs $75k-100k, 5.5% for AGIs $100k-200k)
Profit/loss from business: +$11,650 (reported on 22.7% of returns)
Here:
+$11,650
State:
+$13,732
(% of AGI for various income ranges: 9.3% for AGIs below $25k, 6.2% for AGIs $25k-50k, 9.3% for AGIs $50k-75k, 2.2% for AGIs $75k-100k, 3.8% for AGIs $100k-200k)
Taxable individual retirement arrangement distribution: $9,000 (reported on 8.0% of returns)
76861:
$9,000
Texas:
$19,511
Total itemized deductions: $17,744 (21% of AGI, reported on 10.2% of returns)
Here:
$17,744
State:
$24,724
Here:
20.9% of AGI
State:
15.9% of AGI
(% of AGI for various income ranges: 8.3% for AGIs below $25k, 6.6% for AGIs $50k-75k, 5.0% for AGIs $100k-200k)
Charity contributions: $3,733 (reported on 6.8% of returns)
Here:
$3,733
State:
$6,808
Taxes paid: $3,344 (reported on 10.2% of returns)
76861:
$3,344
State:
$6,921
(% of AGI for various income ranges: 1.4% for AGIs below $25k, 1.4% for AGIs $50k-75k, 0.9% for AGIs $100k-200k)
Earned income credit: $2,567 (reported on 20.5% of returns)
Here:
$2,567
State:
$2,570
(% of AGI for various income ranges: 7.0% for AGIs below $25k, 1.7% for AGIs $25k-50k)
Percentage of individuals using paid preparers for their 2012 taxes: 69.3%
Here:
69%
State:
51%
(% for various income ranges: 66.7% for AGIs below $25k, 63.6% for AGIs $25k-50k, 75.0% for AGIs $50k-75k, 66.7% for AGIs $75k-100k, 88.9% for AGIs $100k-200k)
Averages for the 2004 tax year for zip code 76861, filed in 2005:
Average Adjusted Gross Income (AGI) in 2004: $31,354 (Individual Income Tax Returns)
Here:
$31,354
State:
$47,881
Salary/wage: $30,881 (reported on 82.7% of returns)
Here:
$30,881
State:
$41,947
(% of AGI for various income ranges: 479.5% for AGIs below $10k, 85.9% for AGIs $10k-25k, 82.3% for AGIs $25k-50k, 82.4% for AGIs $50k-75k, 76.0% for AGIs $75k-100k, 60.2% for AGIs over 100k)
Taxable interest for individuals: $1,714 (reported on 38.1% of returns)
This zip code:
$1,714
Texas:
$2,255
(% of AGI for various income ranges: 26.5% for AGIs below $10k, 1.9% for AGIs $10k-25k, 1.6% for AGIs $25k-50k, 2.2% for AGIs $50k-75k, 2.5% for AGIs $75k-100k, 1.2% for AGIs over 100k)
Taxable dividends: $1,412 (reported on 16.5% of returns)
Here:
$1,412
State:
$4,261
(% of AGI for various income ranges: 9.3% for AGIs below $10k, 1.3% for AGIs $10k-25k, 0.7% for AGIs $25k-50k, 0.1% for AGIs $50k-75k, 1.0% for AGIs $75k-100k, 0.3% for AGIs over 100k)
Net capital gain/loss: +$2,701 (reported on 15.4% of returns)
Here:
+$2,701
State:
+$16,110
(% of AGI for various income ranges: 71.2% for AGIs below $10k, 3.6% for AGIs $10k-25k, -0.4% for AGIs $25k-50k, 0.4% for AGIs $50k-75k, 0.8% for AGIs $75k-100k, 0.2% for AGIs over 100k)
Profit/loss from business: +$4,270 (reported on 19.7% of returns)
Here:
+$4,270
State:
+$11,013
(% of AGI for various income ranges: 67.0% for AGIs below $10k, 5.2% for AGIs $10k-25k, 1.7% for AGIs $25k-50k, 2.2% for AGIs $50k-75k, 2.0% for AGIs over 100k)
IRA payment deduction: $3,462 (reported on 3.1% of returns)
76861:
$3,462
Texas:
$3,120
Total itemized deductions: $15,414 (22% of AGI, reported on 8.5% of returns)
Here:
$15,414
State:
$19,631
Here:
21.8% of AGI
State:
18.9% of AGI
(% of AGI for various income ranges: 59.5% for AGIs below $10k, 3.4% for AGIs $25k-50k, 2.9% for AGIs $50k-75k, 6.4% for AGIs $75k-100k, 6.1% for AGIs over 100k)
Charity contributions deductions: $4,056 (5% of AGI, reported on 6.5% of returns)
Here:
$4,056
State:
$4,753
Here:
5.0% of AGI
State:
4.2% of AGI
Total tax: $4,216 (reported on 70.0% of returns)
76861:
$4,216
State:
$9,058
(% of AGI for various income ranges: 21.9% for AGIs below $10k, 3.7% for AGIs $10k-25k, 6.2% for AGIs $25k-50k, 8.8% for AGIs $50k-75k, 10.8% for AGIs $75k-100k, 19.1% for AGIs over 100k)
Earned income credit: $2,006 (reported on 21.7% of returns)
Here:
$2,006
State:
$2,024
Percentage of individuals using paid preparers for their 2004 taxes: 74.1%
Here:
74%
State:
57%
(% for various income ranges: 72.2% for AGIs below $10k, 77.0% for AGIs $10k-25k, 67.1% for AGIs $25k-50k, 79.8% for AGIs $50k-75k, 72.5% for AGIs $75k-100k, 96.7% for AGIs over 100k)
Household received Food Stamps/SNAP in the past 12 months: 9 Household did not receive Food Stamps/SNAP in the past 12 months: 715
Women who had a birth in the past 12 months: 40 (35 now married, 4 unmarried) Women who did not have a birth in the past 12 months: 416 (195 now married, 219 unmarried)
Housing units in zip code 76861 with a mortgage: 189 Houses without a mortgage: 6
Median monthly owner costs for units with a mortgage: $1,347 Median monthly owner costs for units without a mortgage: $516
Residents with income below the poverty level in 2022:
This zip code:
10.8%
Whole state:
14.0%
Residents with income below 50% of the poverty level in 2022:
This zip code:
4.1%
Whole state:
7.4%
Median number of rooms in houses and condos:
Here:
5.8
State:
6.3
Median number of rooms in apartments:
Here:
4.7
State:
4.0
Notable locations in this zip code not listed on our city pages
Reservoirs: Jeschke Lake (A), Krall Reservoir (B), Stoker Lake (C), Baca Lake (D), Soil Conservation Service Site Number 1 Reservoir (E), Soil Conservation Service Site Number 2 Reservoir (F). Display/hide their locations on the map
Streams, rivers, and creeks: Battle Creek (A), Willow Creek (B), Valentine Branch (C), Crows Nest Creek (D), Puddle Creek (E), Dry Lipan Creek (F). Display/hide their locations on the map
Size of family households: 282 2-persons, 80 3-persons, 125 4-persons, 52 5-persons, 6 6-persons, 7 7-or-more-persons
Size of nonfamily households: 150 1-person, 6 2-persons, 15 3-persons
364 married couples with children.
114 single-parent households (28 men, 86 women).
65.6% of residents of 76861 zip code speak English at home.
34.0% of residents speak Spanish at home (74% very well, 13% well, 13% not well, 1% not at all).
Foreign born population: 208 (9.9%) (50.7% of them are naturalized citizens)
This zip code:
9.9%
Whole state:
17.2%
95%Honduras
17%German
10%Irish
4%English
3%European
3%American
2%Scottish
1%Czech
Year of entry for the foreign-born population
562010 or later
282000 to 2009
201990 to 1999
116Before 1990
Facilities with environmental interests located in this zip code:
ADOLF TAPIA DAIRY (13153 N KLATTENHOOF RD in MILES, TX)
National Pollutant Discharge Elimination System NON-MAJOR (Tracking pollutant discharge elimination systems) - permit Business SIC classification: DAIRY FARMS Organizations: ADOLFO TAPIA (CONTACT/OWNER)
Alternative names: ADOLFO TAPIA
Housing units lacking complete plumbing facilities: 5.5% Housing units lacking complete kitchen facilities: 7.7%
71.0%Electricity
20.4%Utility gas
7.4%Bottled, tank, or LP gas
0.9%Other fuel
0.7%Wood
Population in 1990: 1,102. Population change in the 1990s: +850 (+77.1%).
Place of birth for U.S.-born residents:
This state: 1,609
Northeast: 4
Midwest: 62
South: 95
West: 90
64% of the 76861 zip code residents lived in the same house 5 years ago. Out of people who lived in different houses, 45% lived in this county. Out of people who lived in different counties, 50% lived in Texas.
89% of the 76861 zip code residents lived in the same house 1 year ago. Out of people who lived in different houses, 24% moved from this county. Out of people who lived in different houses, 54% moved from different county within same state. Out of people who lived in different houses, 24% moved from different state.
Private vs. public school enrollment:
Students in private schools in grades 1 to 8 (elementary and middle school): 21
Here:
9.0%
Texas:
8.8%
Students in private schools in grades 9 to 12 (high school): 5
Here:
3.9%
Texas:
8.0%
Students in private undergraduate colleges: 2
Here:
3.3%
Texas:
16.2%
Occupation by median earnings in the past 12 months ($)
112,872Law enforcement workers including supervisors
67,958Business and financial operations occupations
62,799Construction and extraction occupations
61,551Health diagnosing and treating practitioners and other technical occupations
60,086Production occupations
53,037Education, training, and library occupations
Top industries in this zip code by the number of employees in 2005:
Finance and Insurance: Commercial Banking (20-49 employees: 1 establishment)
Professional, Scientific, and Technical Services: Research and Development in the Physical, Engineering, and Life Sciences (20-49: 1)
Accommodation and Food Services: Snack and Nonalcoholic Beverage Bars (10-19: 1)
Construction: Site Preparation Contractors (5-9: 1, 1-4: 1)
Other Services (except Public Administration): Religious Organizations (1-4: 2)
Fatal accident statistics in 2014:
Fatal accident count: 1
Vehicles involved in fatal accidents: 2
Fatal accidents caused by drunken drivers: 1
Fatalities: 1
Persons involved in fatal accidents: 3
Pedestrians involved in fatal accidents: 0
Home Mortgage Disclosure Act Aggregated Statistics For Year 2009 (Based on 2 partial tracts)
A) FHA, FSA/RHS & VA Home Purchase Loans
B) Conventional Home Purchase Loans
C) Refinancings
D) Home Improvement Loans
F) Non-occupant Loans on < 5 Family Dwellings (A B C & D)
G) Loans On Manufactured Home Dwelling (A B C & D)
Number
Average Value
Number
Average Value
Number
Average Value
Number
Average Value
Number
Average Value
Number
Average Value
LOANS ORIGINATED
4
$103,318
6
$178,607
16
$181,860
3
$112,397
1
$459,030
0
$0
APPLICATIONS APPROVED, NOT ACCEPTED
0
$0
0
$0
0
$0
1
$55,770
0
$0
0
$0
APPLICATIONS DENIED
1
$123,550
2
$81,795
4
$108,250
1
$30,600
0
$0
0
$0
APPLICATIONS WITHDRAWN
0
$0
0
$0
2
$109,250
0
$0
0
$0
1
$94,090
FILES CLOSED FOR INCOMPLETENESS
0
$0
0
$0
1
$66,350
0
$0
0
$0
0
$0
Aggregated Statistics For Year 2008 (Based on 2 partial tracts)
A) FHA, FSA/RHS & VA Home Purchase Loans
B) Conventional Home Purchase Loans
C) Refinancings
D) Home Improvement Loans
F) Non-occupant Loans on < 5 Family Dwellings (A B C & D)
G) Loans On Manufactured Home Dwelling (A B C & D)
Number
Average Value
Number
Average Value
Number
Average Value
Number
Average Value
Number
Average Value
Number
Average Value
LOANS ORIGINATED
2
$218,645
9
$125,300
9
$126,031
5
$41,184
1
$72,640
1
$45,470
APPLICATIONS APPROVED, NOT ACCEPTED
1
$113,540
0
$0
1
$38,610
0
$0
0
$0
1
$86,660
APPLICATIONS DENIED
0
$0
1
$187,620
5
$151,180
3
$27,550
1
$42,330
1
$28,600
APPLICATIONS WITHDRAWN
0
$0
1
$29,170
3
$123,267
1
$70,070
0
$0
0
$0
FILES CLOSED FOR INCOMPLETENESS
0
$0
0
$0
0
$0
0
$0
0
$0
0
$0
Aggregated Statistics For Year 2007 (Based on 2 partial tracts)
A) FHA, FSA/RHS & VA Home Purchase Loans
B) Conventional Home Purchase Loans
C) Refinancings
D) Home Improvement Loans
F) Non-occupant Loans on < 5 Family Dwellings (A B C & D)
G) Loans On Manufactured Home Dwelling (A B C & D)
Number
Average Value
Number
Average Value
Number
Average Value
Number
Average Value
Number
Average Value
Number
Average Value
LOANS ORIGINATED
2
$103,820
8
$138,710
7
$153,173
5
$37,122
2
$109,680
1
$45,470
APPLICATIONS APPROVED, NOT ACCEPTED
0
$0
1
$86,660
1
$236,240
1
$13,440
0
$0
1
$28,600
APPLICATIONS DENIED
1
$66,640
3
$71,403
8
$104,819
3
$34,510
0
$0
2
$43,760
APPLICATIONS WITHDRAWN
0
$0
1
$211,930
3
$120,500
1
$34,610
0
$0
0
$0
FILES CLOSED FOR INCOMPLETENESS
0
$0
0
$0
0
$0
1
$3,720
0
$0
0
$0
Aggregated Statistics For Year 2006 (Based on 2 partial tracts)
A) FHA, FSA/RHS & VA Home Purchase Loans
B) Conventional Home Purchase Loans
C) Refinancings
D) Home Improvement Loans
F) Non-occupant Loans on < 5 Family Dwellings (A B C & D)
G) Loans On Manufactured Home Dwelling (A B C & D)
Number
Average Value
Number
Average Value
Number
Average Value
Number
Average Value
Number
Average Value
Number
Average Value
LOANS ORIGINATED
2
$161,020
11
$93,548
7
$103,777
5
$30,888
1
$69,780
1
$43,190
APPLICATIONS APPROVED, NOT ACCEPTED
0
$0
2
$63,920
1
$58,920
0
$0
0
$0
0
$0
APPLICATIONS DENIED
0
$0
4
$69,712
12
$87,373
4
$28,958
1
$55,480
1
$77,790
APPLICATIONS WITHDRAWN
0
$0
3
$114,877
6
$94,523
1
$27,170
0
$0
0
$0
FILES CLOSED FOR INCOMPLETENESS
0
$0
0
$0
1
$158,160
0
$0
0
$0
0
$0
Aggregated Statistics For Year 2005 (Based on 2 partial tracts)
A) FHA, FSA/RHS & VA Home Purchase Loans
B) Conventional Home Purchase Loans
C) Refinancings
D) Home Improvement Loans
F) Non-occupant Loans on < 5 Family Dwellings (A B C & D)
G) Loans On Manufactured Home Dwelling (A B C & D)
Number
Average Value
Number
Average Value
Number
Average Value
Number
Average Value
Number
Average Value
Number
Average Value
LOANS ORIGINATED
2
$98,670
12
$94,762
8
$106,785
6
$72,548
1
$68,640
0
$0
APPLICATIONS APPROVED, NOT ACCEPTED
0
$0
4
$83,370
2
$50,620
0
$0
0
$0
0
$0
APPLICATIONS DENIED
0
$0
6
$62,825
9
$81,606
2
$47,760
1
$28,600
1
$77,510
APPLICATIONS WITHDRAWN
1
$108,680
4
$127,700
2
$81,225
1
$198,200
1
$135,280
0
$0
FILES CLOSED FOR INCOMPLETENESS
0
$0
0
$0
3
$87,040
0
$0
0
$0
0
$0
Aggregated Statistics For Year 2004 (Based on 2 partial tracts)
A) FHA, FSA/RHS & VA Home Purchase Loans
B) Conventional Home Purchase Loans
C) Refinancings
D) Home Improvement Loans
F) Non-occupant Loans on < 5 Family Dwellings (A B C & D)
G) Loans On Manufactured Home Dwelling (A B C & D)
Number
Average Value
Number
Average Value
Number
Average Value
Number
Average Value
Number
Average Value
Number
Average Value
LOANS ORIGINATED
1
$107,250
10
$93,179
13
$79,112
3
$38,800
3
$51,860
2
$47,475
APPLICATIONS APPROVED, NOT ACCEPTED
0
$0
2
$98,385
3
$79,030
1
$17,730
0
$0
1
$36,610
APPLICATIONS DENIED
0
$0
4
$75,218
13
$80,982
3
$18,590
0
$0
3
$39,753
APPLICATIONS WITHDRAWN
0
$0
3
$97,337
9
$84,243
1
$10,010
1
$36,890
1
$49,480
FILES CLOSED FOR INCOMPLETENESS
0
$0
0
$0
1
$72,360
0
$0
0
$0
0
$0
Aggregated Statistics For Year 2003 (Based on 2 partial tracts)
A) FHA, FSA/RHS & VA Home Purchase Loans
B) Conventional Home Purchase Loans
C) Refinancings
D) Home Improvement Loans
F) Non-occupant Loans on < 5 Family Dwellings (A B C & D)
Number
Average Value
Number
Average Value
Number
Average Value
Number
Average Value
Number
Average Value
LOANS ORIGINATED
2
$93,810
8
$73,395
23
$101,120
6
$59,917
1
$185,040
APPLICATIONS APPROVED, NOT ACCEPTED
0
$0
0
$0
2
$93,235
1
$17,160
0
$0
APPLICATIONS DENIED
0
$0
5
$39,812
12
$84,513
3
$27,550
0
$0
APPLICATIONS WITHDRAWN
0
$0
1
$174,460
6
$88,040
0
$0
0
$0
FILES CLOSED FOR INCOMPLETENESS
0
$0
1
$37,750
1
$91,520
0
$0
0
$0
Aggregated Statistics For Year 2002 (Based on 2 partial tracts)
A) FHA, FSA/RHS & VA Home Purchase Loans
B) Conventional Home Purchase Loans
C) Refinancings
D) Home Improvement Loans
F) Non-occupant Loans on < 5 Family Dwellings (A B C & D)
Number
Average Value
Number
Average Value
Number
Average Value
Number
Average Value
Number
Average Value
LOANS ORIGINATED
3
$77,887
8
$105,605
18
$110,682
4
$28,815
1
$90,090
APPLICATIONS APPROVED, NOT ACCEPTED
1
$33,180
1
$34,610
3
$65,683
1
$20,020
1
$28,890
APPLICATIONS DENIED
0
$0
5
$58,858
5
$44,558
2
$32,320
0
$0
APPLICATIONS WITHDRAWN
1
$50,910
1
$25,170
5
$62,862
1
$21,740
0
$0
FILES CLOSED FOR INCOMPLETENESS
0
$0
0
$0
1
$129,270
0
$0
0
$0
Aggregated Statistics For Year 2001 (Based on 2 partial tracts)
A) FHA, FSA/RHS & VA Home Purchase Loans
B) Conventional Home Purchase Loans
C) Refinancings
D) Home Improvement Loans
F) Non-occupant Loans on < 5 Family Dwellings (A B C & D)
Number
Average Value
Number
Average Value
Number
Average Value
Number
Average Value
Number
Average Value
LOANS ORIGINATED
4
$90,590
9
$78,173
14
$76,934
2
$20,735
1
$52,340
APPLICATIONS APPROVED, NOT ACCEPTED
0
$0
2
$38,040
1
$30,600
1
$41,760
0
$0
APPLICATIONS DENIED
0
$0
7
$64,104
5
$71,614
2
$9,580
1
$44,040
APPLICATIONS WITHDRAWN
1
$86,660
1
$91,230
4
$73,430
0
$0
0
$0
FILES CLOSED FOR INCOMPLETENESS
0
$0
0
$0
1
$286,860
0
$0
0
$0
Aggregated Statistics For Year 2000 (Based on 2 partial tracts)
A) FHA, FSA/RHS & VA Home Purchase Loans
B) Conventional Home Purchase Loans
C) Refinancings
D) Home Improvement Loans
F) Non-occupant Loans on < 5 Family Dwellings (A B C & D)
Number
Average Value
Number
Average Value
Number
Average Value
Number
Average Value
Number
Average Value
LOANS ORIGINATED
3
$78,747
6
$70,118
4
$71,215
4
$14,085
1
$21,450
APPLICATIONS APPROVED, NOT ACCEPTED
1
$48,910
3
$57,297
1
$20,590
1
$17,730
1
$42,040
APPLICATIONS DENIED
0
$0
13
$49,808
4
$95,095
2
$15,445
1
$46,620
APPLICATIONS WITHDRAWN
1
$68,640
1
$15,730
2
$43,330
0
$0
0
$0
FILES CLOSED FOR INCOMPLETENESS
0
$0
1
$38,040
1
$39,180
0
$0
0
$0
Aggregated Statistics For Year 1999 (Based on 1 partial tract)
Detailed PMIC statistics for the following Tracts:0016.00
2002 - 2014 National Fire Incident Reporting System (NFIRS) incidents
According to the data from the years 2002 - 2014 the average number of fires per year is 11. The highest number of reported fire incidents - 27 took place in 2005, and the least - 0 in 2003. The data has a rising trend.
When looking into fire subcategories, the most reports belonged to: Outside Fires (68.8%), and Structure Fires (13.0%).
Fire incident types reported to NFIRS in Zip Code 76861

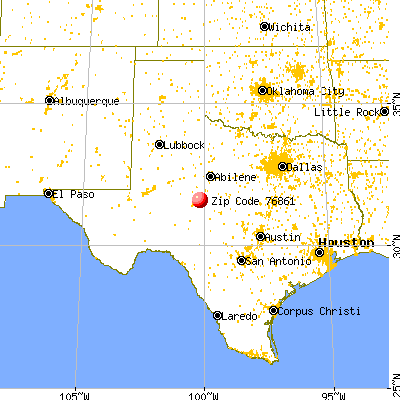


 Nearest zip codes: 76905, 76940, 76953, 76875, 76937, 76957.


 According to the data from the years 2002 - 2014 the average number of fires per year is 11. The highest number of reported fire incidents - 27 took place in 2005, and the least - 0 in 2003. The data has a rising trend.
 When looking into fire subcategories, the most reports belonged to: Outside Fires (68.8%), and Structure Fires (13.0%).