Estimated zip code population in 2022: 13,784 Zip code population in 2010: 11,335 Zip code population in 2000: 11,328
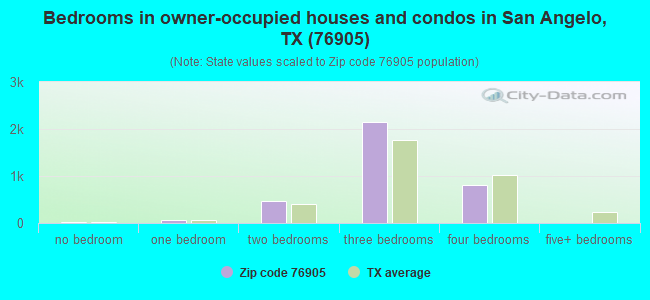
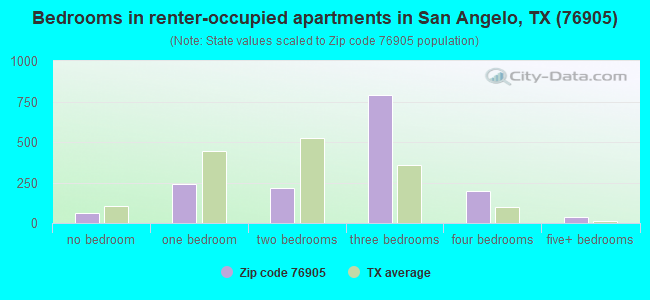
Houses and condos: 5,503 Renter-occupied apartments: 1,551
% of renters here:
31%
State:
38%
March 2022 cost of living index in zip code 76905: 84.8 (less than average, U.S. average is 100)
Land area: 207.9 sq. mi. Water area: 0.0 sq. mi.
Population density: 66 people per square mile
(very low).
OSM Map
General Map
Google Map
MSN Map
OSM Map
General Map
Google Map
MSN Map
OSM Map
General Map
Google Map
MSN Map
OSM Map
General Map
Google Map
MSN Map
Please wait while loading the map...
Real estate property taxes paid for housing units in 2022:
This zip code:
1.2% ($2,173)
Texas:
1.5% ($4,050)
Median real estate property taxes paid for housing units with mortgages in 2022: $3,010 (1.4%) Median real estate property taxes paid for housing units with no mortgage in 2022: $1,433 (1.0%)
Business Search- 14 Million verified businesses
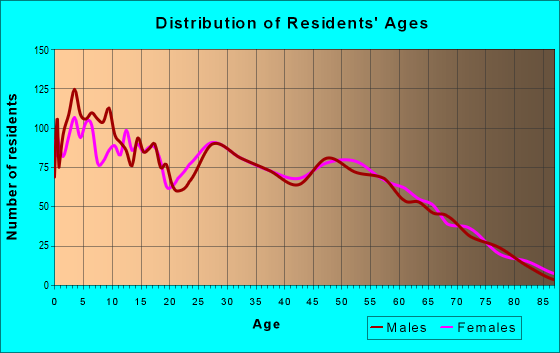
Males: 7,305
(53.0%)
Females: 6,479
(47.0%)
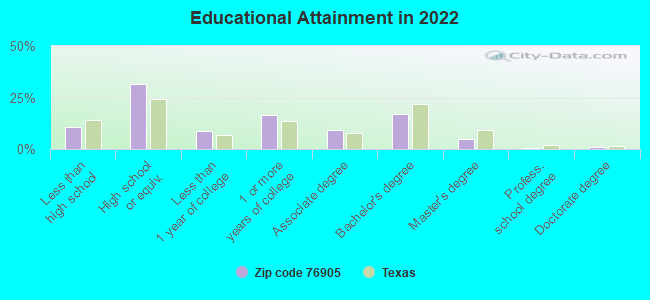
For population 25 years and over in 76905:
High school or higher: 88.9%
Bachelor's degree or higher: 22.7%
Graduate or professional degree: 5.9%
Unemployed: 3.2%
Mean travel time to work (commute): 21.7 minutes
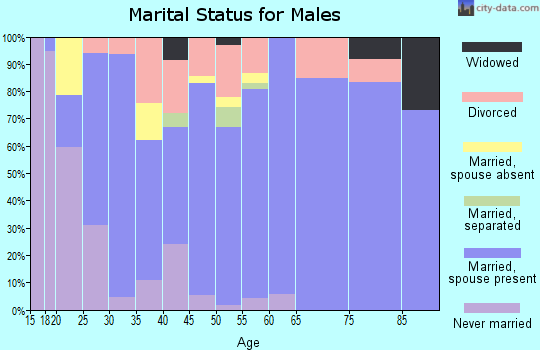
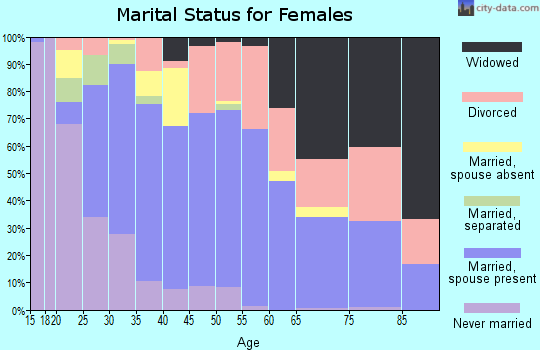
For population 15 years and over in 76905:
Never married: 26.2%
Now married: 58.9%
Separated: 0.9%
Widowed: 3.6%
Divorced: 10.5%
Zip code 76905 compared to state average:
Median house value below state average.
Black race population percentage significantly below state average.
Foreign-born population percentage significantly below state average.
Length of stay since moving in significantly above state average.
Percentage of population with a bachelor's degree or higher below state average.
Averages for the 2020 tax year for zip code 76905, filed in 2021:
Average Adjusted Gross Income (AGI) in 2020: $55,916 (Individual Income Tax Returns)
Here:
$55,916
State:
$77,054
Salary/wage: $46,498 (reported on 86.0% of returns)
Here:
$46,498
State:
$62,766
(% of AGI for various income ranges: 1279.2% for AGIs below $25k, 3592.6% for AGIs $25k-50k, 6346.0% for AGIs $50k-75k, 8765.5% for AGIs $75k-100k, 15792.1% for AGIs $100k-200k, 80070.0% for AGIs over 200k)
Taxable interest for individuals: $991 (reported on 20.1% of returns)
This zip code:
$991
Texas:
$2,665
(% of AGI for various income ranges: 8.8% for AGIs below $25k, 11.7% for AGIs $25k-50k, 19.6% for AGIs $50k-75k, 40.3% for AGIs $75k-100k, 111.6% for AGIs $100k-200k, 455.0% for AGIs over 200k)
Ordinary dividends: $3,049 (reported on 12.0% of returns)
Here:
$3,049
State:
$10,044
(% of AGI for various income ranges: 8.0% for AGIs below $25k, 17.3% for AGIs $25k-50k, 31.0% for AGIs $50k-75k, 40.3% for AGIs $75k-100k, 116.6% for AGIs $100k-200k, 4185.0% for AGIs over 200k)
Net capital gain/loss in AGI: +$8,835 (reported on 11.4% of returns)
Here:
+$8,835
State:
+$39,590
(% of AGI for various income ranges: 8.4% for AGIs below $25k, 21.0% for AGIs $25k-50k, 59.9% for AGIs $50k-75k, 191.8% for AGIs $75k-100k, 547.4% for AGIs $100k-200k, 9350.0% for AGIs over 200k)
Profit/loss from business: +$11,374 (reported on 15.7% of returns)
Here:
+$11,374
State:
+$10,888
(% of AGI for various income ranges: 89.3% for AGIs below $25k, 57.1% for AGIs $25k-50k, 201.2% for AGIs $50k-75k, 342.9% for AGIs $75k-100k, 436.6% for AGIs $100k-200k, 16515.0% for AGIs over 200k)
Taxable individual retirement arrangement distribution: $12,918 (reported on 6.1% of returns)
76905:
$12,918
Texas:
$24,740
(% of AGI for various income ranges: 39.0% for AGIs below $25k, 57.2% for AGIs $25k-50k, 112.9% for AGIs $50k-75k, 170.0% for AGIs $75k-100k, 407.1% for AGIs $100k-200k)
Total itemized deductions: $31,557 (reported on 2.6% of returns)
Here:
$31,557
State:
$40,428
(% of AGI for various income ranges: 50.0% for AGIs $25k-50k, 154.1% for AGIs $50k-75k, 335.0% for AGIs $100k-200k, 7285.0% for AGIs over 200k)
Charity contributions: $15,080 (reported on 1.8% of returns)
Here:
$15,080
State:
$18,201
(% of AGI for various income ranges: 49.4% for AGIs $50k-75k, 104.7% for AGIs $100k-200k, 3870.0% for AGIs over 200k)
Taxes paid: $6,000 (reported on 2.4% of returns)
76905:
$6,000
State:
$7,821
(% of AGI for various income ranges: 5.5% for AGIs below $25k, 31.3% for AGIs $50k-75k, 55.0% for AGIs $100k-200k, 1390.0% for AGIs over 200k)
Earned income credit: $2,510 (reported on 21.5% of returns)
Here:
$2,510
State:
$2,584
(% of AGI for various income ranges: 119.6% for AGIs below $25k, 91.2% for AGIs $25k-50k, 3.4% for AGIs $50k-75k)
Percentage of individuals using paid preparers for their 2020 taxes: 95.4%
Here:
95%
State:
92%
(% for various income ranges: 94.6% for AGIs below $25k, 96.7% for AGIs $25k-50k, 95.4% for AGIs $50k-75k, 94.0% for AGIs $75k-100k, 96.7% for AGIs $100k-200k, 90.0% for AGIs over 200k)
Averages for the 2012 tax year for zip code 76905, filed in 2013:
Average Adjusted Gross Income (AGI) in 2012: $45,009 (Individual Income Tax Returns)
Here:
$45,009
State:
$65,384
Salary/wage: $39,945 (reported on 88.4% of returns)
Here:
$39,945
State:
$52,524
(% of AGI for various income ranges: 83.6% for AGIs below $25k, 85.8% for AGIs $25k-50k, 82.9% for AGIs $50k-75k, 81.0% for AGIs $75k-100k, 75.0% for AGIs $100k-200k, 44.1% for AGIs over 200k)
Taxable interest for individuals: $839 (reported on 20.1% of returns)
This zip code:
$839
Texas:
$2,372
(% of AGI for various income ranges: 0.5% for AGIs below $25k, 0.2% for AGIs $25k-50k, 0.3% for AGIs $50k-75k, 0.2% for AGIs $75k-100k, 0.6% for AGIs $100k-200k, 0.7% for AGIs over 200k)
Ordinary dividends: $2,525 (reported on 10.2% of returns)
Here:
$2,525
State:
$9,721
(% of AGI for various income ranges: 0.7% for AGIs below $25k, 0.3% for AGIs $25k-50k, 0.4% for AGIs $50k-75k, 0.4% for AGIs $75k-100k, 0.7% for AGIs $100k-200k, 1.5% for AGIs over 200k)
Net capital gain/loss in AGI: +$3,341 (reported on 8.2% of returns)
Here:
+$3,341
State:
+$35,319
(% of AGI for various income ranges: 0.1% for AGIs below $25k, 0.3% for AGIs $25k-50k, 0.5% for AGIs $50k-75k, 0.6% for AGIs $75k-100k, 1.0% for AGIs $100k-200k, 1.6% for AGIs over 200k)
Profit/loss from business: +$14,189 (reported on 15.1% of returns)
Here:
+$14,189
State:
+$13,732
(% of AGI for various income ranges: 4.4% for AGIs below $25k, 2.5% for AGIs $25k-50k, 2.1% for AGIs $50k-75k, 3.5% for AGIs $75k-100k, 12.9% for AGIs $100k-200k)
Taxable individual retirement arrangement distribution: $12,310 (reported on 6.2% of returns)
76905:
$12,310
Texas:
$19,511
(% of AGI for various income ranges: 1.6% for AGIs below $25k, 1.6% for AGIs $25k-50k, 1.3% for AGIs $50k-75k, 2.9% for AGIs $75k-100k, 2.1% for AGIs $100k-200k)
Total itemized deductions: $18,394 (20% of AGI, reported on 12.4% of returns)
Here:
$18,394
State:
$24,724
Here:
20.1% of AGI
State:
15.9% of AGI
(% of AGI for various income ranges: 2.7% for AGIs below $25k, 3.5% for AGIs $25k-50k, 5.0% for AGIs $50k-75k, 6.2% for AGIs $75k-100k, 7.4% for AGIs $100k-200k, 4.8% for AGIs over 200k)
Charity contributions: $5,130 (reported on 8.8% of returns)
Here:
$5,130
State:
$6,808
(% of AGI for various income ranges: 0.3% for AGIs below $25k, 0.6% for AGIs $25k-50k, 0.9% for AGIs $50k-75k, 1.0% for AGIs $75k-100k, 1.7% for AGIs $100k-200k, 1.6% for AGIs over 200k)
Taxes paid: $4,108 (reported on 11.8% of returns)
76905:
$4,108
State:
$6,921
(% of AGI for various income ranges: 0.3% for AGIs below $25k, 0.7% for AGIs $25k-50k, 1.0% for AGIs $50k-75k, 1.3% for AGIs $75k-100k, 1.8% for AGIs $100k-200k, 1.4% for AGIs over 200k)
Earned income credit: $2,391 (reported on 25.5% of returns)
Here:
$2,391
State:
$2,570
(% of AGI for various income ranges: 8.1% for AGIs below $25k, 1.8% for AGIs $25k-50k)
Percentage of individuals using paid preparers for their 2012 taxes: 51.6%
Here:
52%
State:
51%
(% for various income ranges: 50.2% for AGIs below $25k, 48.5% for AGIs $25k-50k, 50.0% for AGIs $50k-75k, 54.5% for AGIs $75k-100k, 63.9% for AGIs $100k-200k, 100.0% for AGIs over 200k)
Averages for the 2004 tax year for zip code 76905, filed in 2005:
Average Adjusted Gross Income (AGI) in 2004: $32,779 (Individual Income Tax Returns)
Here:
$32,779
State:
$47,881
Salary/wage: $30,789 (reported on 88.7% of returns)
Here:
$30,789
State:
$41,947
(% of AGI for various income ranges: 117.6% for AGIs below $10k, 84.4% for AGIs $10k-25k, 85.6% for AGIs $25k-50k, 83.8% for AGIs $50k-75k, 81.6% for AGIs $75k-100k, 71.5% for AGIs over 100k)
Taxable interest for individuals: $953 (reported on 28.9% of returns)
This zip code:
$953
Texas:
$2,255
(% of AGI for various income ranges: 5.2% for AGIs below $10k, 0.9% for AGIs $10k-25k, 0.6% for AGIs $25k-50k, 0.5% for AGIs $50k-75k, 1.3% for AGIs $75k-100k, 0.7% for AGIs over 100k)
Taxable dividends: $1,020 (reported on 13.1% of returns)
Here:
$1,020
State:
$4,261
(% of AGI for various income ranges: 1.0% for AGIs below $10k, 0.3% for AGIs $10k-25k, 0.3% for AGIs $25k-50k, 0.3% for AGIs $50k-75k, 0.9% for AGIs $75k-100k, 0.4% for AGIs over 100k)
Net capital gain/loss: +$2,663 (reported on 10.2% of returns)
Here:
+$2,663
State:
+$16,110
(% of AGI for various income ranges: -0.8% for AGIs below $10k, 0.0% for AGIs $10k-25k, 0.4% for AGIs $25k-50k, 0.9% for AGIs $50k-75k, 0.3% for AGIs $75k-100k, 3.7% for AGIs over 100k)
Profit/loss from business: +$7,417 (reported on 16.0% of returns)
Here:
+$7,417
State:
+$11,013
(% of AGI for various income ranges: 4.0% for AGIs below $10k, 4.1% for AGIs $10k-25k, 2.4% for AGIs $25k-50k, 2.3% for AGIs $50k-75k, 4.1% for AGIs $75k-100k, 7.9% for AGIs over 100k)
IRA payment deduction: $2,637 (reported on 2.4% of returns)
76905:
$2,637
Texas:
$3,120
(% of AGI for various income ranges: 0.2% for AGIs $10k-25k, 0.2% for AGIs $25k-50k, 0.2% for AGIs $50k-75k, 0.4% for AGIs $75k-100k)
Self-employed pension: $10,250 (reported on 0.3% of returns)
Here:
$10,250
Texas:
$16,401
Total itemized deductions: $14,833 (23% of AGI, reported on 11.6% of returns)
Here:
$14,833
State:
$19,631
Here:
22.9% of AGI
State:
18.9% of AGI
(% of AGI for various income ranges: 3.2% for AGIs below $10k, 3.0% for AGIs $10k-25k, 4.3% for AGIs $25k-50k, 6.3% for AGIs $50k-75k, 6.9% for AGIs $75k-100k, 6.7% for AGIs over 100k)
Charity contributions deductions: $4,171 (6% of AGI, reported on 9.4% of returns)
Here:
$4,171
State:
$4,753
Here:
6.1% of AGI
State:
4.2% of AGI
(% of AGI for various income ranges: 0.5% for AGIs $10k-25k, 0.9% for AGIs $25k-50k, 1.4% for AGIs $50k-75k, 1.7% for AGIs $75k-100k, 2.0% for AGIs over 100k)
Total tax: $3,951 (reported on 68.6% of returns)
76905:
$3,951
State:
$9,058
(% of AGI for various income ranges: 3.6% for AGIs below $10k, 3.6% for AGIs $10k-25k, 5.8% for AGIs $25k-50k, 8.0% for AGIs $50k-75k, 10.8% for AGIs $75k-100k, 18.5% for AGIs over 100k)
Earned income credit: $1,949 (reported on 23.6% of returns)
Here:
$1,949
State:
$2,024
Percentage of individuals using paid preparers for their 2004 taxes: 64.8%
Here:
65%
State:
57%
(% for various income ranges: 60.8% for AGIs below $10k, 69.2% for AGIs $10k-25k, 65.0% for AGIs $25k-50k, 59.3% for AGIs $50k-75k, 65.4% for AGIs $75k-100k, 67.2% for AGIs over 100k)
Likely homosexual households (counted as self-reported same-sex unmarried-partner households)
Lesbian couples: 0.4% of all households
Gay men: 0.5% of all households
Household received Food Stamps/SNAP in the past 12 months: 380 Household did not receive Food Stamps/SNAP in the past 12 months: 4,681
Women who had a birth in the past 12 months: 347 (318 now married, 33 unmarried) Women who did not have a birth in the past 12 months: 2,438 (1,357 now married, 1,072 unmarried)
Housing units in zip code 76905 with a mortgage: 1,775 (24 second mortgage, 26 both second mortgage and home equity loan) Houses without a mortgage: 65
Median monthly owner costs for units with a mortgage: $1,414 Median monthly owner costs for units without a mortgage: $515
Residents with income below the poverty level in 2022:
This zip code:
13.3%
Whole state:
14.0%
Residents with income below 50% of the poverty level in 2022:
This zip code:
6.3%
Whole state:
7.4%
Median number of rooms in houses and condos:
Here:
6.0
State:
6.3
Median number of rooms in apartments:
Here:
4.8
State:
4.0
Notable locations in this zip code not listed on our city pages
Notable locations in zip code 76905: Harriet School (A), Skinner School (B), Wooland Siding (C), East Concho Volunteer Fire Department (D), San Angelo Fire Department Station 3 (E), Quail Valley Volunteer Fire Department (F). Display/hide their locations on the map
Churches in zip code 76905 include: Belmore Baptist Church (A), Grace Church (B), Quail Baptist Church (C), Paul Ann Baptist Church (D), Harriett Baptist Church (E), Belmore Baptist Church (F). Display/hide their locations on the map
Streams, rivers, and creeks: Red Creek (A), Little Crows Nest Creek (B), Tenmile Creek (C), Sales Branch (D), Ninemile Creek (E). Display/hide their locations on the map
In group quarters: 42 (-1 institutionalized population)
Size of family households: 1,440 2-persons, 729 3-persons, 914 4-persons, 503 5-persons, 148 6-persons, 43 7-or-more-persons
Size of nonfamily households: 1,119 1-person, 123 2-persons, 20 4-persons
2,827 married couples with children.
1,204 single-parent households (371 men, 833 women).
79.5% of residents of 76905 zip code speak English at home.
18.6% of residents speak Spanish at home (63% very well, 29% well, 6% not well, 2% not at all).
1.1% of residents speak other Indo-European language at home (100% very well).
1.1% of residents speak Asian or Pacific Island language at home (33% very well, 43% well, 24% not well).
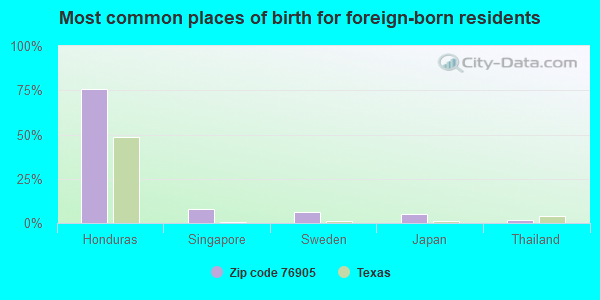
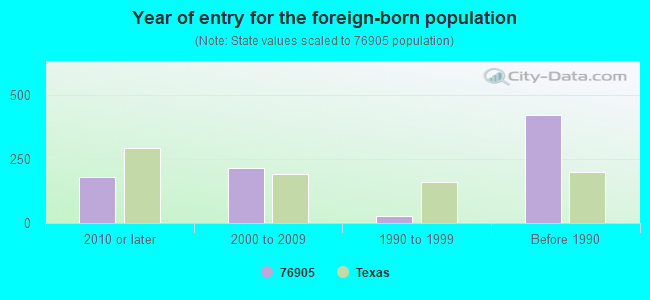
Foreign born population: 598 (4.3%) (54.8% of them are naturalized citizens)
Housing units lacking complete plumbing facilities: 3.7% Housing units lacking complete kitchen facilities: 3.4%
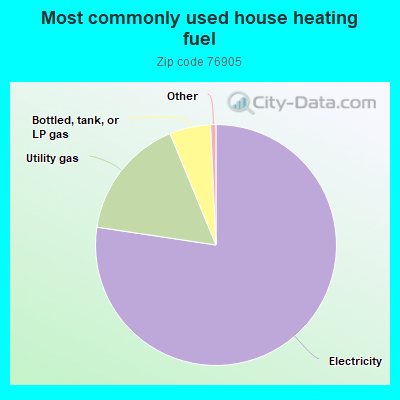
77.3%Electricity
16.4%Utility gas
5.5%Bottled, tank, or LP gas
Population in 1990: 11,284. Population change in the 1990s: +44 (+0.4%).
Place of birth for U.S.-born residents:
This state: 9,968
Northeast: 251
Midwest: 626
South: 525
West: 1,510
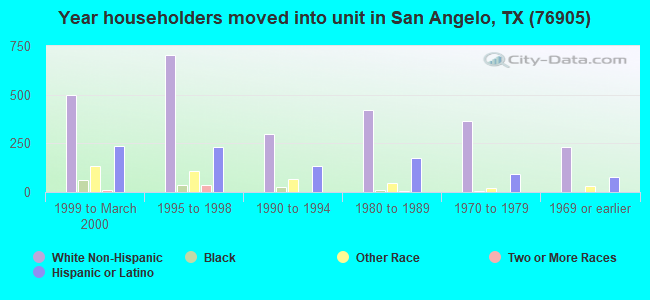
51% of the 76905 zip code residents lived in the same house 5 years ago. Out of people who lived in different houses, 50% lived in this county. Out of people who lived in different counties, 50% lived in Texas.
88% of the 76905 zip code residents lived in the same house 1 year ago. Out of people who lived in different houses, 47% moved from this county. Out of people who lived in different houses, 27% moved from different county within same state. Out of people who lived in different houses, 23% moved from different state. Out of people who lived in different houses, 3% moved from abroad.
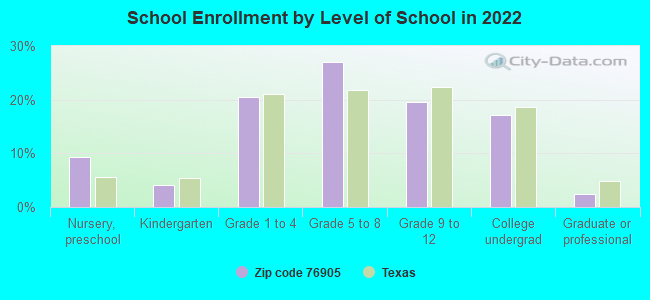
Private vs. public school enrollment:
Students in private schools in grades 1 to 8 (elementary and middle school): 139
Here:
8.1%
Texas:
8.8%
Students in private schools in grades 9 to 12 (high school): 175
Here:
24.5%
Texas:
8.0%
Students in private undergraduate colleges: 24
Here:
4.0%
Texas:
16.2%
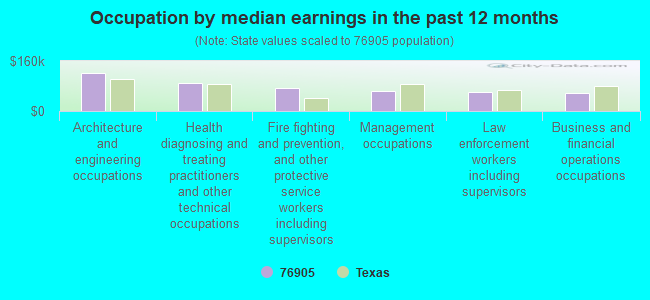
Occupation by median earnings in the past 12 months ($)
120,073Architecture and engineering occupations
90,960Health diagnosing and treating practitioners and other technical occupations
73,134Fire fighting and prevention, and other protective service workers including supervisors
65,155Management occupations
59,522Law enforcement workers including supervisors
58,249Business and financial operations occupations
Companies with federal contracts located in this zip code:
CHARLES BROOKS (7546 ORIENT RD in SAN ANGELO, TX; small business) : $183,257 in 8 contractsfrom 2005 to 2006
Contracts for Telephone and/or Communications Services (includes Telegraph, Telex, and Cablevision Services), Maintenance, Repair and Rebuilding of Equipment -- Fiber Optics Materials, Components, Assemblies, and Accessories, Maintenance, Repair and Rebuilding of Equipment -- Communication, Detection, and Coherent Radiation Equipment, Wire and Cable, Electrical, and moreby Air Force Signed by year:2000: $0; 2001: $0; 2002: $0; 2003: $0; 2004: $0; 2005: $151,457; 2006: $31,800.
Biggest contracts:
$51,782 with Air Force for Telephone and/or Communications Services (includes Telegraph, Telex, and Cablevision Services). Signed on 2005-01-25. Completion date: 2005-02-15.
$44,500 with Air Force for Maintenance, Repair and Rebuilding of Equipment -- Fiber Optics Materials, Components, Assemblies, and Accessories. Signed on 2005-09-20. Completion date: 2005-11-15.
$34,675 with Air Force for Telephone and/or Communications Services (includes Telegraph, Telex, and Cablevision Services). Signed on 2005-09-16. Completion date: 2005-12-30.
$24,900 with Air Force for Maintenance, Repair and Rebuilding of Equipment -- Communication, Detection, and Coherent Radiation Equipment. Signed on 2006-01-13. Completion date: 2006-01-31.
WILLOW RUN APARTMENTS (555 SMITH BLVD in SAN ANGELO, TX; small business)
$67,980 with Air Force for Lease or Rental of Facilities -- Troop Housing Facilities. Signed on 2003-03-01. Completion date: 2004-02-29.
Top industries in this zip code by the number of employees in 2005:
Health Care and Social Assistance: Offices of Physicians (except Mental Health Specialists) (50-99 employees: 1 establishment, 5-9 employees: 1 establishment)
Professional, Scientific, and Technical Services: Testing Laboratories (50-99: 1)
Accommodation and Food Services: Limited-Service Restaurants (20-49: 1, 10-19: 1)
Other Services (except Public Administration): Other Personal and Household Goods Repair and Maintenance (20-49: 1, 5-9: 1)
Accommodation and Food Services: Full-Service Restaurants (20-49: 1, 1-4: 1)
Health Care and Social Assistance: Specialty (except Psychiatric and Substance Abuse) Hospitals (20-49: 1)
People in group quarters in 2010:
6 people in group homes intended for adults
People in group quarters in 2000:
372 people in military barracks, etc.
130 people in military transient quarters for temporary residents
8 people in religious group quarters
Fatal accident statistics in 2014:
Fatal accident count: 1
Vehicles involved in fatal accidents: 3
Fatal accidents caused by drunken drivers: 0
Fatalities: 1
Persons involved in fatal accidents: 3
Pedestrians involved in fatal accidents: 0
Fatal accident statistics in 2013:
Fatal accident count: 1
Vehicles involved in fatal accidents: 2
Fatal accidents caused by drunken drivers: 0
Fatalities: 1
Persons involved in fatal accidents: 2
Pedestrians involved in fatal accidents: 0
Home Mortgage Disclosure Act Aggregated Statistics For Year 2009 (Based on 8 partial tracts)
A) FHA, FSA/RHS & VA Home Purchase Loans
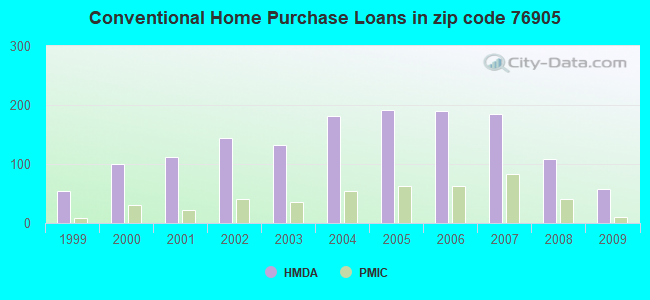
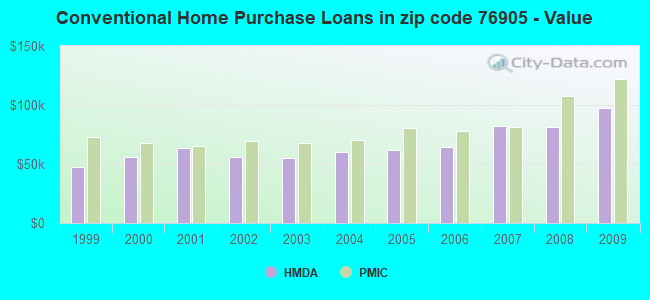
B) Conventional Home Purchase Loans
C) Refinancings
D) Home Improvement Loans
E) Loans on Dwellings For 5+ Families
F) Non-occupant Loans on < 5 Family Dwellings (A B C & D)
G) Loans On Manufactured Home Dwelling (A B C & D)
Number
Average Value
Number
Average Value
Number
Average Value
Number
Average Value
Number
Average Value
Number
Average Value
Number
Average Value
LOANS ORIGINATED
118
$104,105
58
$97,524
149
$111,160
28
$60,693
1
$597,480
43
$82,773
2
$37,810
APPLICATIONS APPROVED, NOT ACCEPTED
5
$126,596
2
$37,575
7
$72,903
4
$87,140
0
$0
0
$0
1
$21,390
APPLICATIONS DENIED
16
$107,087
13
$53,038
82
$71,098
33
$27,282
0
$0
7
$35,470
3
$102,527
APPLICATIONS WITHDRAWN
7
$117,771
7
$86,280
31
$81,079
10
$73,330
1
$4,022,860
5
$57,556
3
$90,110
FILES CLOSED FOR INCOMPLETENESS
0
$0
2
$98,030
16
$71,897
0
$0
0
$0
0
$0
0
$0
Aggregated Statistics For Year 2008 (Based on 10 partial tracts)
A) FHA, FSA/RHS & VA Home Purchase Loans
B) Conventional Home Purchase Loans
C) Refinancings
D) Home Improvement Loans
F) Non-occupant Loans on < 5 Family Dwellings (A B C & D)
G) Loans On Manufactured Home Dwelling (A B C & D)
Number
Average Value
Number
Average Value
Number
Average Value
Number
Average Value
Number
Average Value
Number
Average Value
LOANS ORIGINATED
144
$105,494
109
$81,128
106
$83,983
42
$34,206
58
$55,321
3
$57,873
APPLICATIONS APPROVED, NOT ACCEPTED
7
$84,823
5
$94,614
9
$51,464
10
$37,603
2
$24,785
2
$119,775
APPLICATIONS DENIED
16
$88,660
33
$66,688
81
$70,657
73
$31,834
7
$42,519
3
$53,447
APPLICATIONS WITHDRAWN
7
$98,057
9
$76,997
27
$82,206
3
$103,593
4
$49,748
0
$0
FILES CLOSED FOR INCOMPLETENESS
3
$62,423
4
$59,535
7
$94,349
4
$23,928
1
$14,170
0
$0
Aggregated Statistics For Year 2007 (Based on 10 partial tracts)
A) FHA, FSA/RHS & VA Home Purchase Loans
B) Conventional Home Purchase Loans
C) Refinancings
D) Home Improvement Loans
E) Loans on Dwellings For 5+ Families
F) Non-occupant Loans on < 5 Family Dwellings (A B C & D)
G) Loans On Manufactured Home Dwelling (A B C & D)
Number
Average Value
Number
Average Value
Number
Average Value
Number
Average Value
Number
Average Value
Number
Average Value
Number
Average Value
LOANS ORIGINATED
125
$92,756
185
$82,301
115
$74,058
69
$33,193
1
$1,983,800
74
$57,532
3
$54,600
APPLICATIONS APPROVED, NOT ACCEPTED
4
$81,435
18
$86,584
28
$83,306
9
$29,979
0
$0
6
$86,880
3
$57,327
APPLICATIONS DENIED
12
$88,301
55
$66,829
143
$63,549
78
$32,693
0
$0
23
$47,845
10
$52,637
APPLICATIONS WITHDRAWN
5
$87,216
18
$86,087
46
$71,362
9
$29,706
0
$0
6
$54,048
0
$0
FILES CLOSED FOR INCOMPLETENESS
1
$264,820
4
$65,175
18
$59,084
3
$22,320
0
$0
0
$0
0
$0
Aggregated Statistics For Year 2006 (Based on 10 partial tracts)
A) FHA, FSA/RHS & VA Home Purchase Loans
B) Conventional Home Purchase Loans
C) Refinancings
D) Home Improvement Loans
E) Loans on Dwellings For 5+ Families
F) Non-occupant Loans on < 5 Family Dwellings (A B C & D)
G) Loans On Manufactured Home Dwelling (A B C & D)
Number
Average Value
Number
Average Value
Number
Average Value
Number
Average Value
Number
Average Value
Number
Average Value
Number
Average Value
LOANS ORIGINATED
72
$87,586
189
$64,669
106
$57,121
69
$23,711
1
$1,381,570
68
$43,733
3
$56,520
APPLICATIONS APPROVED, NOT ACCEPTED
3
$89,207
24
$51,839
19
$42,304
12
$22,257
0
$0
7
$39,384
2
$38,660
APPLICATIONS DENIED
11
$81,931
77
$57,116
148
$66,018
87
$24,411
0
$0
21
$40,383
9
$52,697
APPLICATIONS WITHDRAWN
23
$77,056
67
$70,955
81
$66,772
12
$36,455
0
$0
3
$33,537
1
$9,290
FILES CLOSED FOR INCOMPLETENESS
1
$160,490
4
$54,940
17
$71,751
1
$39,030
0
$0
1
$37,170
0
$0
Aggregated Statistics For Year 2005 (Based on 8 partial tracts)
A) FHA, FSA/RHS & VA Home Purchase Loans
B) Conventional Home Purchase Loans
C) Refinancings
D) Home Improvement Loans
E) Loans on Dwellings For 5+ Families
F) Non-occupant Loans on < 5 Family Dwellings (A B C & D)
G) Loans On Manufactured Home Dwelling (A B C & D)
Number
Average Value
Number
Average Value
Number
Average Value
Number
Average Value
Number
Average Value
Number
Average Value
Number
Average Value
LOANS ORIGINATED
81
$80,276
192
$61,654
126
$63,838
65
$50,448
3
$213,967
82
$42,721
1
$63,250
APPLICATIONS APPROVED, NOT ACCEPTED
1
$30,830
23
$62,853
38
$53,112
4
$21,018
0
$0
3
$45,250
2
$44,765
APPLICATIONS DENIED
4
$93,290
63
$54,689
164
$56,171
67
$27,730
0
$0
13
$38,494
8
$39,284
APPLICATIONS WITHDRAWN
6
$112,805
32
$101,489
88
$75,944
28
$109,121
0
$0
14
$106,491
1
$39,530
FILES CLOSED FOR INCOMPLETENESS
1
$68,450
3
$68,013
30
$77,141
2
$34,145
0
$0
0
$0
0
$0
Aggregated Statistics For Year 2004 (Based on 10 partial tracts)
A) FHA, FSA/RHS & VA Home Purchase Loans
B) Conventional Home Purchase Loans
C) Refinancings
D) Home Improvement Loans
F) Non-occupant Loans on < 5 Family Dwellings (A B C & D)
G) Loans On Manufactured Home Dwelling (A B C & D)
Number
Average Value
Number
Average Value
Number
Average Value
Number
Average Value
Number
Average Value
Number
Average Value
LOANS ORIGINATED
90
$73,589
181
$60,245
185
$57,060
52
$29,690
86
$46,454
8
$46,820
APPLICATIONS APPROVED, NOT ACCEPTED
1
$61,600
23
$59,435
49
$49,643
10
$38,039
6
$53,715
7
$32,836
APPLICATIONS DENIED
6
$58,745
49
$53,661
193
$53,836
65
$24,148
14
$41,502
16
$44,656
APPLICATIONS WITHDRAWN
8
$57,584
39
$58,575
144
$61,658
5
$24,580
12
$45,436
3
$65,413
FILES CLOSED FOR INCOMPLETENESS
0
$0
2
$39,415
14
$88,901
1
$25,670
4
$77,165
0
$0
Aggregated Statistics For Year 2003 (Based on 10 partial tracts)
A) FHA, FSA/RHS & VA Home Purchase Loans
B) Conventional Home Purchase Loans
C) Refinancings
D) Home Improvement Loans
E) Loans on Dwellings For 5+ Families
F) Non-occupant Loans on < 5 Family Dwellings (A B C & D)
Number
Average Value
Number
Average Value
Number
Average Value
Number
Average Value
Number
Average Value
Number
Average Value
LOANS ORIGINATED
93
$72,095
132
$55,063
318
$61,415
55
$35,951
4
$240,425
69
$41,700
APPLICATIONS APPROVED, NOT ACCEPTED
7
$59,289
12
$49,930
33
$60,313
3
$19,117
0
$0
5
$39,510
APPLICATIONS DENIED
7
$67,974
60
$44,966
204
$50,286
49
$20,405
0
$0
23
$37,071
APPLICATIONS WITHDRAWN
8
$73,042
17
$69,195
123
$56,556
0
$0
0
$0
6
$55,118
FILES CLOSED FOR INCOMPLETENESS
1
$25,670
3
$54,750
14
$62,183
2
$43,315
0
$0
3
$51,093
Aggregated Statistics For Year 2002 (Based on 10 partial tracts)
A) FHA, FSA/RHS & VA Home Purchase Loans
B) Conventional Home Purchase Loans
C) Refinancings
D) Home Improvement Loans
E) Loans on Dwellings For 5+ Families
F) Non-occupant Loans on < 5 Family Dwellings (A B C & D)
Number
Average Value
Number
Average Value
Number
Average Value
Number
Average Value
Number
Average Value
Number
Average Value
LOANS ORIGINATED
121
$66,744
144
$56,344
197
$68,300
62
$17,195
1
$407,920
72
$32,391
APPLICATIONS APPROVED, NOT ACCEPTED
7
$78,147
10
$47,831
28
$63,793
8
$24,840
0
$0
6
$47,578
APPLICATIONS DENIED
2
$36,320
63
$41,662
137
$41,570
40
$17,133
0
$0
19
$44,517
APPLICATIONS WITHDRAWN
12
$58,059
8
$44,474
86
$48,723
2
$30,045
0
$0
6
$40,853
FILES CLOSED FOR INCOMPLETENESS
1
$46,460
3
$48,350
14
$64,504
0
$0
0
$0
3
$45,840
Aggregated Statistics For Year 2001 (Based on 10 partial tracts)
A) FHA, FSA/RHS & VA Home Purchase Loans
B) Conventional Home Purchase Loans
C) Refinancings
D) Home Improvement Loans
F) Non-occupant Loans on < 5 Family Dwellings (A B C & D)
Number
Average Value
Number
Average Value
Number
Average Value
Number
Average Value
Number
Average Value
LOANS ORIGINATED
116
$66,232
112
$63,710
150
$59,213
52
$10,859
40
$44,270
APPLICATIONS APPROVED, NOT ACCEPTED
6
$86,223
26
$40,370
16
$33,341
5
$27,070
4
$39,185
APPLICATIONS DENIED
4
$67,548
78
$46,290
82
$45,961
48
$7,382
12
$32,527
APPLICATIONS WITHDRAWN
6
$70,585
12
$59,292
73
$45,071
13
$19,052
3
$37,787
FILES CLOSED FOR INCOMPLETENESS
1
$56,920
4
$35,948
10
$106,081
2
$26,610
1
$31,590
Aggregated Statistics For Year 2000 (Based on 10 partial tracts)
A) FHA, FSA/RHS & VA Home Purchase Loans
B) Conventional Home Purchase Loans
C) Refinancings
D) Home Improvement Loans
E) Loans on Dwellings For 5+ Families
F) Non-occupant Loans on < 5 Family Dwellings (A B C & D)
Number
Average Value
Number
Average Value
Number
Average Value
Number
Average Value
Number
Average Value
Number
Average Value
LOANS ORIGINATED
110
$64,044
100
$56,233
86
$48,100
58
$11,552
1
$278,070
41
$34,146
APPLICATIONS APPROVED, NOT ACCEPTED
8
$54,060
35
$47,410
12
$42,722
5
$19,048
0
$0
5
$60,290
APPLICATIONS DENIED
13
$50,093
105
$47,743
60
$46,462
41
$13,876
0
$0
12
$43,764
APPLICATIONS WITHDRAWN
13
$58,260
11
$38,003
25
$52,836
2
$7,435
0
$0
4
$32,350
FILES CLOSED FOR INCOMPLETENESS
3
$68,450
4
$53,780
17
$43,509
0
$0
0
$0
3
$50,680
Aggregated Statistics For Year 1999 (Based on 5 partial tracts)
A) FHA, FSA/RHS & VA Home Purchase Loans
B) Conventional Home Purchase Loans
C) Refinancings
D) Home Improvement Loans
E) Loans on Dwellings For 5+ Families
F) Non-occupant Loans on < 5 Family Dwellings (A B C & D)
2002 - 2018 National Fire Incident Reporting System (NFIRS) incidents
According to the data from the years 2002 - 2018 the average number of fires per year is 36. The highest number of fire incidents - 74 took place in 2003, and the least - 10 in 2015. The data has a growing trend.
When looking into fire subcategories, the most incidents belonged to: Outside Fires (57.7%), and Structure Fires (31.1%).
Fire incident types reported to NFIRS in Zip Code 76905
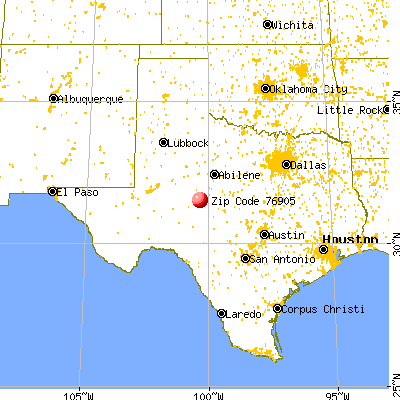


 Nearest zip codes: 76908, 76903, 76957, 76861, 76940, 76937.


 : $183,257 in 8 contracts from 2005 to 2006
 According to the data from the years 2002 - 2018 the average number of fires per year is 36. The highest number of fire incidents - 74 took place in 2003, and the least - 10 in 2015. The data has a growing trend.
 When looking into fire subcategories, the most incidents belonged to: Outside Fires (57.7%), and Structure Fires (31.1%).