Estimated zip code population in 2022: 38,087 Zip code population in 2010: 32,718 Zip code population in 2000: 29,622
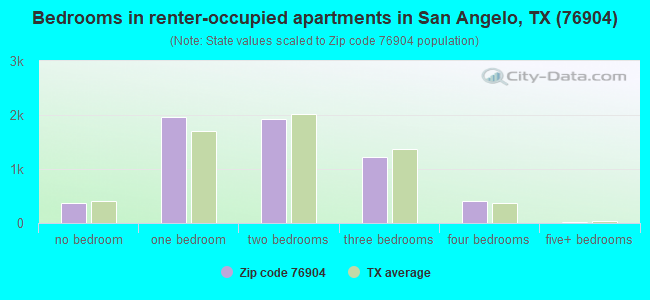
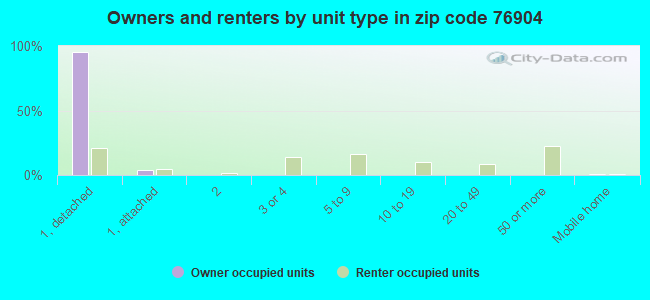
Houses and condos: 17,388 Renter-occupied apartments: 5,908
% of renters here:
37%
State:
38%
March 2022 cost of living index in zip code 76904: 84.2 (less than average, U.S. average is 100)
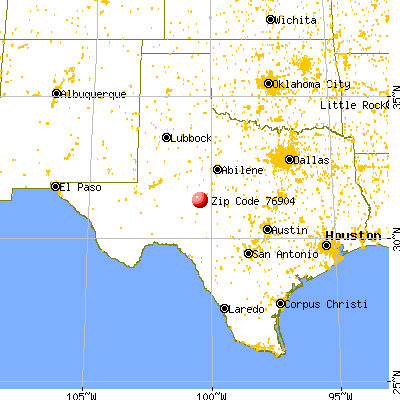
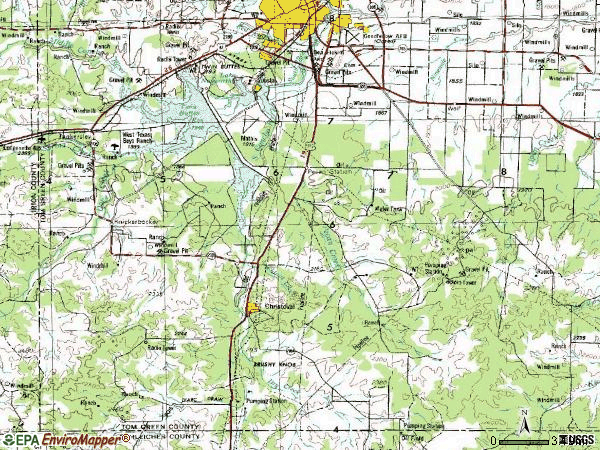
Land area: 403.9 sq. mi. Water area: 10.7 sq. mi.
Population density: 94 people per square mile
(very low).
OSM Map
General Map
Google Map
MSN Map
OSM Map
General Map
Google Map
MSN Map
OSM Map
General Map
Google Map
MSN Map
OSM Map
General Map
Google Map
MSN Map
Please wait while loading the map...
Real estate property taxes paid for housing units in 2022:
This zip code:
1.5% ($4,329)
Texas:
1.5% ($4,050)
Median real estate property taxes paid for housing units with mortgages in 2022: $4,476 (1.6%) Median real estate property taxes paid for housing units with no mortgage in 2022: $4,171 (1.4%)
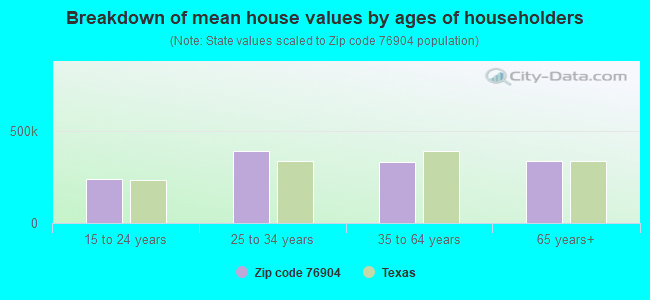
Estimated median house/condo value in 2022: $284,541
76904:
$284,541
Texas:
$275,400
According to our research of Texas and other state lists, there were 63 registered sex offenders living in 76904 zip code as of May 17, 2024. The ratio of all residents to sex offenders in zip code 76904 is 568 to 1. The ratio of registered sex offenders to all residents in this zip code is lower than the state average.
Median resident age:
This zip code:
35.0 years
Texas median age:
35.6 years
Average household size:
This zip code:
2.3 people
Texas:
2.6 people
Averages for the 2020 tax year for zip code 76904, filed in 2021:
Average Adjusted Gross Income (AGI) in 2020: $87,397 (Individual Income Tax Returns)
Here:
$87,397
State:
$77,054
Salary/wage: $62,823 (reported on 81.1% of returns)
Here:
$62,823
State:
$62,766
(% of AGI for various income ranges: 1229.4% for AGIs below $25k, 3469.4% for AGIs $25k-50k, 6088.0% for AGIs $50k-75k, 8985.1% for AGIs $75k-100k, 16640.1% for AGIs $100k-200k, 83135.8% for AGIs over 200k)
Taxable interest for individuals: $2,945 (reported on 30.4% of returns)
This zip code:
$2,945
Texas:
$2,665
(% of AGI for various income ranges: 15.9% for AGIs below $25k, 17.6% for AGIs $25k-50k, 50.6% for AGIs $50k-75k, 91.8% for AGIs $75k-100k, 153.9% for AGIs $100k-200k, 3790.8% for AGIs over 200k)
Ordinary dividends: $12,349 (reported on 21.0% of returns)
Here:
$12,349
State:
$10,044
(% of AGI for various income ranges: 31.9% for AGIs below $25k, 40.8% for AGIs $25k-50k, 123.4% for AGIs $50k-75k, 181.3% for AGIs $75k-100k, 424.0% for AGIs $100k-200k, 12056.2% for AGIs over 200k)
Net capital gain/loss in AGI: +$28,542 (reported on 19.9% of returns)
Here:
+$28,542
State:
+$39,590
(% of AGI for various income ranges: 12.6% for AGIs below $25k, 27.1% for AGIs $25k-50k, 98.9% for AGIs $50k-75k, 168.4% for AGIs $75k-100k, 644.8% for AGIs $100k-200k, 32342.1% for AGIs over 200k)
Profit/loss from business: +$18,917 (reported on 18.0% of returns)
Here:
+$18,917
State:
+$10,888
(% of AGI for various income ranges: 77.0% for AGIs below $25k, 79.2% for AGIs $25k-50k, 196.0% for AGIs $50k-75k, 441.7% for AGIs $75k-100k, 956.1% for AGIs $100k-200k, 10965.4% for AGIs over 200k)
Taxable individual retirement arrangement distribution: $23,297 (reported on 10.6% of returns)
76904:
$23,297
Texas:
$24,740
(% of AGI for various income ranges: 54.5% for AGIs below $25k, 106.5% for AGIs $25k-50k, 280.8% for AGIs $50k-75k, 434.0% for AGIs $75k-100k, 994.7% for AGIs $100k-200k, 3819.2% for AGIs over 200k)
Self-employed (Keogh) retirement plans: $22,442 (reported on 0.7% of returns)
76904:
$22,442
Texas:
$29,298
(% of AGI for various income ranges: 39.4% for AGIs $100k-200k, 857.5% for AGIs over 200k)
Total itemized deductions: $48,587 (reported on 6.9% of returns)
Here:
$48,587
State:
$40,428
(% of AGI for various income ranges: 38.3% for AGIs below $25k, 96.2% for AGIs $25k-50k, 192.5% for AGIs $50k-75k, 347.2% for AGIs $75k-100k, 668.8% for AGIs $100k-200k, 13436.3% for AGIs over 200k)
Charity contributions: $31,375 (reported on 5.7% of returns)
Here:
$31,375
State:
$18,201
(% of AGI for various income ranges: 3.1% for AGIs below $25k, 14.6% for AGIs $25k-50k, 44.6% for AGIs $50k-75k, 83.2% for AGIs $75k-100k, 244.3% for AGIs $100k-200k, 9540.0% for AGIs over 200k)
Taxes paid: $6,969 (reported on 6.8% of returns)
76904:
$6,969
State:
$7,821
(% of AGI for various income ranges: 5.8% for AGIs below $25k, 13.4% for AGIs $25k-50k, 38.3% for AGIs $50k-75k, 78.0% for AGIs $75k-100k, 138.8% for AGIs $100k-200k, 1362.5% for AGIs over 200k)
Earned income credit: $2,151 (reported on 11.9% of returns)
Here:
$2,151
State:
$2,584
(% of AGI for various income ranges: 69.7% for AGIs below $25k, 56.1% for AGIs $25k-50k, 0.9% for AGIs $50k-75k)
Percentage of individuals using paid preparers for their 2020 taxes: 94.4%
Here:
94%
State:
92%
(% for various income ranges: 94.0% for AGIs below $25k, 95.0% for AGIs $25k-50k, 95.0% for AGIs $50k-75k, 93.4% for AGIs $75k-100k, 94.4% for AGIs $100k-200k, 93.8% for AGIs over 200k)
Averages for the 2012 tax year for zip code 76904, filed in 2013:
Average Adjusted Gross Income (AGI) in 2012: $70,366 (Individual Income Tax Returns)
Here:
$70,366
State:
$65,384
Salary/wage: $52,065 (reported on 81.9% of returns)
Here:
$52,065
State:
$52,524
(% of AGI for various income ranges: 79.1% for AGIs below $25k, 75.8% for AGIs $25k-50k, 70.8% for AGIs $50k-75k, 69.2% for AGIs $75k-100k, 67.3% for AGIs $100k-200k, 38.4% for AGIs over 200k)
Taxable interest for individuals: $2,188 (reported on 34.8% of returns)
This zip code:
$2,188
Texas:
$2,372
(% of AGI for various income ranges: 1.2% for AGIs below $25k, 0.9% for AGIs $25k-50k, 0.7% for AGIs $50k-75k, 0.8% for AGIs $75k-100k, 1.0% for AGIs $100k-200k, 1.5% for AGIs over 200k)
Ordinary dividends: $9,839 (reported on 22.0% of returns)
Here:
$9,839
State:
$9,721
(% of AGI for various income ranges: 2.1% for AGIs below $25k, 1.5% for AGIs $25k-50k, 1.7% for AGIs $50k-75k, 1.4% for AGIs $75k-100k, 1.7% for AGIs $100k-200k, 6.2% for AGIs over 200k)
Net capital gain/loss in AGI: +$18,288 (reported on 18.1% of returns)
Here:
+$18,288
State:
+$35,319
(% of AGI for various income ranges: 0.1% for AGIs $25k-50k, 0.4% for AGIs $50k-75k, 0.9% for AGIs $75k-100k, 1.9% for AGIs $100k-200k, 12.9% for AGIs over 200k)
Profit/loss from business: +$22,278 (reported on 17.3% of returns)
Here:
+$22,278
State:
+$13,732
(% of AGI for various income ranges: 5.4% for AGIs below $25k, 3.2% for AGIs $25k-50k, 4.2% for AGIs $50k-75k, 3.9% for AGIs $75k-100k, 5.9% for AGIs $100k-200k, 7.2% for AGIs over 200k)
Taxable individual retirement arrangement distribution: $16,989 (reported on 12.8% of returns)
76904:
$16,989
Texas:
$19,511
(% of AGI for various income ranges: 3.4% for AGIs below $25k, 3.2% for AGIs $25k-50k, 3.6% for AGIs $50k-75k, 4.2% for AGIs $75k-100k, 3.9% for AGIs $100k-200k, 1.6% for AGIs over 200k)
Self-employment retirement plans: $23,950 (reported on 0.8% of returns)
76904:
$23,950
Texas:
$23,938
(% of AGI for various income ranges: 0.2% for AGIs $50k-75k, 0.3% for AGIs $100k-200k, 0.6% for AGIs over 200k)
Total itemized deductions: $22,189 (15% of AGI, reported on 26.0% of returns)
Here:
$22,189
State:
$24,724
Here:
15.5% of AGI
State:
15.9% of AGI
(% of AGI for various income ranges: 6.4% for AGIs below $25k, 7.5% for AGIs $25k-50k, 8.9% for AGIs $50k-75k, 9.0% for AGIs $75k-100k, 9.5% for AGIs $100k-200k, 7.2% for AGIs over 200k)
Charity contributions: $7,360 (reported on 20.4% of returns)
Here:
$7,360
State:
$6,808
(% of AGI for various income ranges: 0.6% for AGIs below $25k, 1.1% for AGIs $25k-50k, 1.4% for AGIs $50k-75k, 2.0% for AGIs $75k-100k, 2.3% for AGIs $100k-200k, 3.0% for AGIs over 200k)
Taxes paid: $5,882 (reported on 25.6% of returns)
76904:
$5,882
State:
$6,921
(% of AGI for various income ranges: 1.2% for AGIs below $25k, 1.7% for AGIs $25k-50k, 2.2% for AGIs $50k-75k, 2.3% for AGIs $75k-100k, 2.9% for AGIs $100k-200k, 1.8% for AGIs over 200k)
Earned income credit: $1,992 (reported on 13.1% of returns)
Here:
$1,992
State:
$2,570
(% of AGI for various income ranges: 4.4% for AGIs below $25k, 0.9% for AGIs $25k-50k)
Percentage of individuals using paid preparers for their 2012 taxes: 50.3%
Here:
50%
State:
51%
(% for various income ranges: 42.7% for AGIs below $25k, 44.5% for AGIs $25k-50k, 52.0% for AGIs $50k-75k, 53.8% for AGIs $75k-100k, 63.5% for AGIs $100k-200k, 87.5% for AGIs over 200k)
Averages for the 2004 tax year for zip code 76904, filed in 2005:
Average Adjusted Gross Income (AGI) in 2004: $51,003 (Individual Income Tax Returns)
Here:
$51,003
State:
$47,881
Salary/wage: $42,745 (reported on 80.6% of returns)
Here:
$42,745
State:
$41,947
(% of AGI for various income ranges: 158.7% for AGIs below $10k, 75.5% for AGIs $10k-25k, 73.5% for AGIs $25k-50k, 72.3% for AGIs $50k-75k, 72.5% for AGIs $75k-100k, 57.3% for AGIs over 100k)
Taxable interest for individuals: $2,586 (reported on 45.9% of returns)
This zip code:
$2,586
Texas:
$2,255
(% of AGI for various income ranges: 8.6% for AGIs below $10k, 2.8% for AGIs $10k-25k, 1.9% for AGIs $25k-50k, 1.8% for AGIs $50k-75k, 1.3% for AGIs $75k-100k, 2.9% for AGIs over 100k)
Taxable dividends: $3,366 (reported on 28.5% of returns)
Here:
$3,366
State:
$4,261
(% of AGI for various income ranges: 5.8% for AGIs below $10k, 2.0% for AGIs $10k-25k, 1.2% for AGIs $25k-50k, 1.1% for AGIs $50k-75k, 1.4% for AGIs $75k-100k, 2.5% for AGIs over 100k)
Net capital gain/loss: +$7,893 (reported on 24.3% of returns)
Here:
+$7,893
State:
+$16,110
(% of AGI for various income ranges: -0.3% for AGIs below $10k, 0.3% for AGIs $10k-25k, 0.4% for AGIs $25k-50k, 1.1% for AGIs $50k-75k, 1.1% for AGIs $75k-100k, 8.0% for AGIs over 100k)
Profit/loss from business: +$16,154 (reported on 18.2% of returns)
Here:
+$16,154
State:
+$11,013
(% of AGI for various income ranges: 1.2% for AGIs below $10k, 4.3% for AGIs $10k-25k, 3.5% for AGIs $25k-50k, 3.0% for AGIs $50k-75k, 4.6% for AGIs $75k-100k, 8.7% for AGIs over 100k)
IRA payment deduction: $3,426 (reported on 3.0% of returns)
76904:
$3,426
Texas:
$3,120
(% of AGI for various income ranges: 0.2% for AGIs $10k-25k, 0.3% for AGIs $25k-50k, 0.2% for AGIs $50k-75k, 0.2% for AGIs $75k-100k, 0.2% for AGIs over 100k)
Self-employed pension: $15,358 (reported on 1.3% of returns)
Here:
$15,358
Texas:
$16,401
(% of AGI for various income ranges: 0.1% for AGIs $25k-50k, 0.1% for AGIs $50k-75k, 0.2% for AGIs $75k-100k, 0.8% for AGIs over 100k)
Total itemized deductions: $17,215 (18% of AGI, reported on 25.8% of returns)
Here:
$17,215
State:
$19,631
Here:
18.3% of AGI
State:
18.9% of AGI
(% of AGI for various income ranges: 16.9% for AGIs below $10k, 7.8% for AGIs $10k-25k, 7.4% for AGIs $25k-50k, 9.7% for AGIs $50k-75k, 10.3% for AGIs $75k-100k, 8.1% for AGIs over 100k)
Charity contributions deductions: $5,498 (6% of AGI, reported on 22.3% of returns)
Here:
$5,498
State:
$4,753
Here:
5.5% of AGI
State:
4.2% of AGI
(% of AGI for various income ranges: 1.3% for AGIs below $10k, 1.0% for AGIs $10k-25k, 1.4% for AGIs $25k-50k, 2.0% for AGIs $50k-75k, 2.4% for AGIs $75k-100k, 3.3% for AGIs over 100k)
Total tax: $8,946 (reported on 77.3% of returns)
76904:
$8,946
State:
$9,058
(% of AGI for various income ranges: 3.7% for AGIs below $10k, 4.2% for AGIs $10k-25k, 7.0% for AGIs $25k-50k, 9.2% for AGIs $50k-75k, 11.3% for AGIs $75k-100k, 20.9% for AGIs over 100k)
Earned income credit: $1,637 (reported on 11.3% of returns)
Here:
$1,637
State:
$2,024
Percentage of individuals using paid preparers for their 2004 taxes: 58.3%
Here:
58%
State:
57%
(% for various income ranges: 49.4% for AGIs below $10k, 57.5% for AGIs $10k-25k, 59.5% for AGIs $25k-50k, 60.3% for AGIs $50k-75k, 57.5% for AGIs $75k-100k, 72.3% for AGIs over 100k)
Likely homosexual households (counted as self-reported same-sex unmarried-partner households)
Lesbian couples: 0.0% of all households
Gay men: 0.4% of all households
Household received Food Stamps/SNAP in the past 12 months: 871 Household did not receive Food Stamps/SNAP in the past 12 months: 15,031
Women who had a birth in the past 12 months: 549 (381 now married, 167 unmarried) Women who did not have a birth in the past 12 months: 8,990 (3,948 now married, 5,041 unmarried)
Housing units in zip code 76904 with a mortgage: 5,846 (212 second mortgage, 131 both second mortgage and home equity loan) Houses without a mortgage: 87
Median monthly owner costs for units with a mortgage: $1,813 Median monthly owner costs for units without a mortgage: $787
Residents with income below the poverty level in 2022:
This zip code:
6.9%
Whole state:
14.0%
Residents with income below 50% of the poverty level in 2022:
This zip code:
2.0%
Whole state:
7.4%
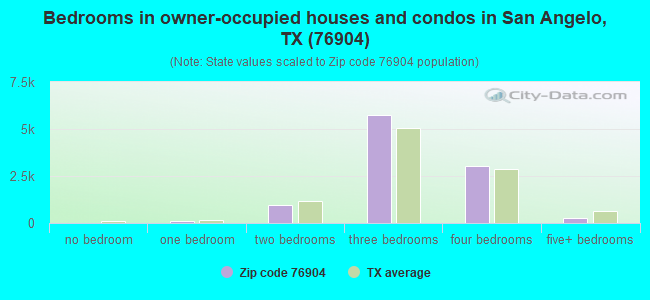
Median number of rooms in houses and condos:
Here:
6.3
State:
6.3
Median number of rooms in apartments:
Here:
3.7
State:
4.0
Notable locations in this zip code not listed on our city pages
In group quarters: 1,533 (-1 institutionalized population)
Size of family households: 5,126 2-persons, 1,787 3-persons, 1,659 4-persons, 714 5-persons, 489 6-persons, 65 7-or-more-persons
Size of nonfamily households: 4,985 1-person, 1,066 2-persons, 144 4-persons
6,338 married couples with children.
1,726 single-parent households (365 men, 1,361 women).
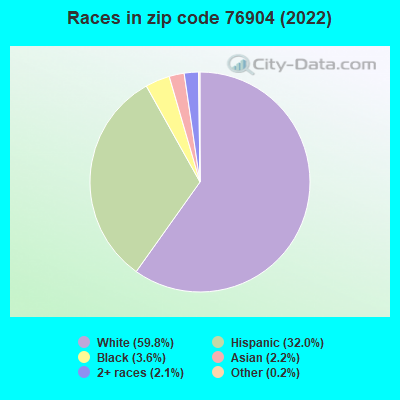
81.3% of residents of 76904 zip code speak English at home.
16.2% of residents speak Spanish at home (87% very well, 8% well, 4% not well, 1% not at all).
1.1% of residents speak other Indo-European language at home (78% very well, 22% well).
1.0% of residents speak Asian or Pacific Island language at home (37% very well, 57% well, 6% not well).
0.5% of residents speak other language at home (85% very well, 15% well).
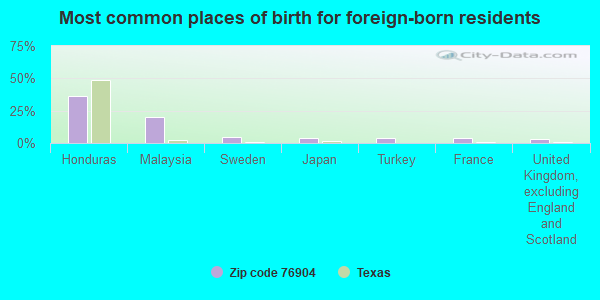
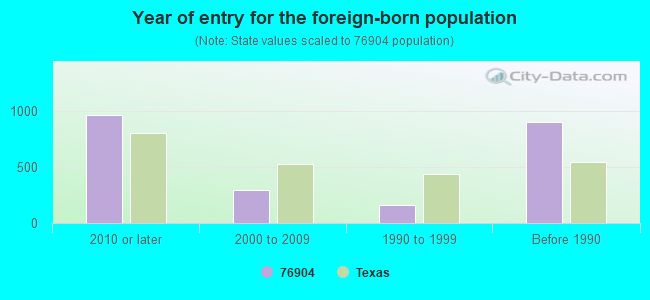
Foreign born population: 1,691 (4.4%) (43.5% of them are naturalized citizens)
Facilities with environmental interests located in this zip code:
BARRY OF SAN ANGELO (2800 LOOP 306 in SAN ANGELO, TX)
(Resource Conservation and Recovery Act (tracking hazardous waste))
Housing units lacking complete plumbing facilities: 1.2% Housing units lacking complete kitchen facilities: 1.3%
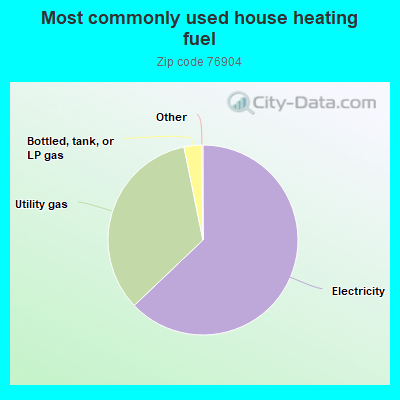
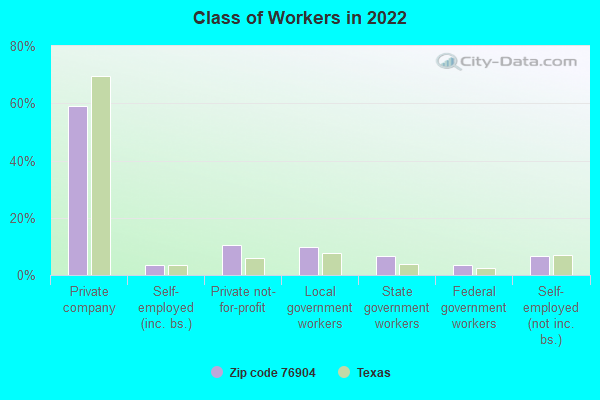
62.9%Electricity
33.9%Utility gas
3.0%Bottled, tank, or LP gas
Population in 1990: 25,535. Population change in the 1990s: +4,087 (+16.0%).
Place of birth for U.S.-born residents:
This state: 26,933
Northeast: 909
Midwest: 1,996
South: 3,279
West: 2,539
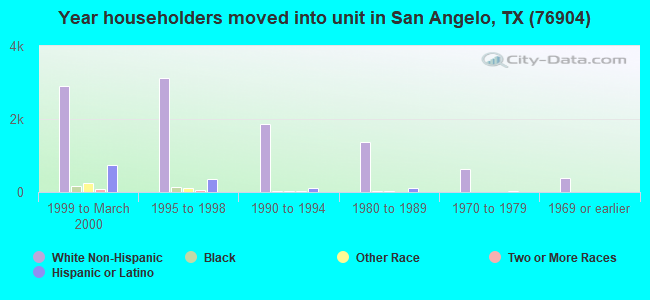
41% of the 76904 zip code residents lived in the same house 5 years ago. Out of people who lived in different houses, 45% lived in this county. Out of people who lived in different counties, 50% lived in Texas.
85% of the 76904 zip code residents lived in the same house 1 year ago. Out of people who lived in different houses, 49% moved from this county. Out of people who lived in different houses, 38% moved from different county within same state. Out of people who lived in different houses, 7% moved from different state. Out of people who lived in different houses, 4% moved from abroad.
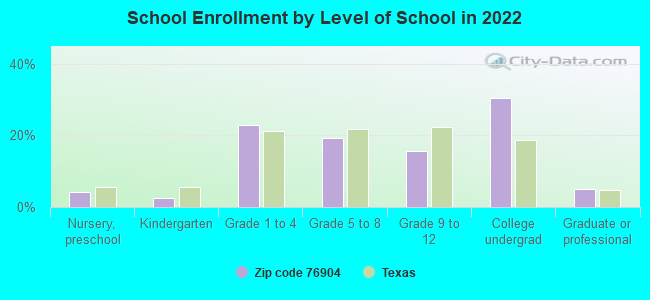
Private vs. public school enrollment:
Students in private schools in grades 1 to 8 (elementary and middle school): 582
Here:
12.9%
Texas:
8.8%
Students in private schools in grades 9 to 12 (high school): 123
Here:
7.4%
Texas:
8.0%
Students in private undergraduate colleges: 213
Here:
6.5%
Texas:
16.2%
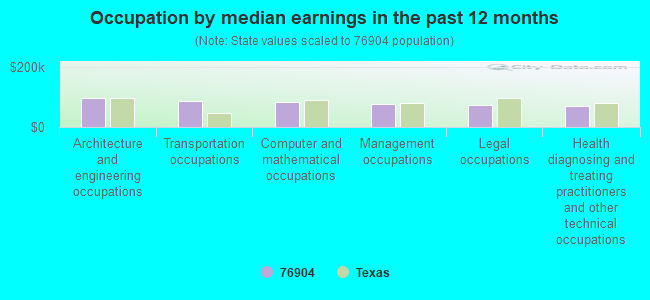
Occupation by median earnings in the past 12 months ($)
98,592Architecture and engineering occupations
88,038Transportation occupations
84,854Computer and mathematical occupations
77,012Management occupations
72,851Legal occupations
70,016Health diagnosing and treating practitioners and other technical occupations
Companies with biggest federal contracts located in this zip code (SAN ANGELO, TX):
GOODFELLOW HOUSING PARTNERSHIP (7702 CENTINEL CIR; small business) : $9,535,474 in 21 contractsfrom 1999 to 2006
Contracts for Lease or Rental of Facilities -- Family Housing Facilities by Air Force Signed by year:2000: $1,567,425; 2001: $1,592,059; 2002: $1,592,059; 2003: $1,590,059; 2004: $1,592,478; 2005: $150,503; 2006: -$3,034.
Biggest contracts:
$1,472,060 with Air Force for Lease or Rental of Facilities -- Family Housing Facilities. Signed on 2004-10-01. Completion date: 2005-09-30.
$1,472,059, same as above.Signed on 2003-10-01. Completion date: 2004-09-30.
$1,472,059, same as above.Signed on 2002-10-01. Completion date: 2003-09-30.
$1,472,059, same as above.Signed on 2001-10-01. Completion date: 2002-09-30.
GALLICCHIO, JOSEPH (1802 PARKVIEW DR; small business) : $370,186 in 2 contractsfrom 2003 to 2004
$436,186 with Air Force for Laundry and DryCleaning Services. Signed on 2003-10-01. Completion date: 2004-09-30.
-$66,000, same as above.Signed on 2004-04-28. Completion date: 2004-09-30.
SAN ANGELO STATE UNIVERSITY (I (2601 W AVENUE N) : $212,594 in 8 contractsfrom 2004 to 2006
Contracts for Tuition, Registration, and Membership Fees, Books and Pamphlets by Air Force, Bureau of Prisoners/Federal Prison System Signed by year:2000: $0; 2001: $0; 2002: $0; 2003: $0; 2004: $46,849; 2005: $113,544; 2006: $52,201.
Biggest contracts:
$57,444 with Air Force for Tuition, Registration, and Membership Fees. Signed on 2005-11-15. Completion date: 2005-11-15.
$52,201, same as above.Signed on 2006-03-23. Completion date: 2006-03-23.
$48,921, same as above.Signed on 2005-04-02. Completion date: 2005-09-30.
$45,634, same as above.Signed on 2004-12-10. Completion date: 2005-09-30.
CALDERON, MARIA (3520 KNICKERBOCKER RD; small business) : $139,739 in 13 contractsfrom 2004 to 2005
Contracts for Packing and Gasket Materials, Nails, Machine Keys, and Pins, Fire Control Maintenance and Repair Shop Specialized Equipment, Fastening Device by Defense Logistics Agency Signed by year:2000: $0; 2001: $0; 2002: $0; 2003: $0; 2004: $118,944; 2005: $20,795; 2006: $0.
Biggest contracts:
$45,464 with Defense Logistics Agency for Packing and Gasket Materials. Signed on 2004-11-09. Completion date: 2005-04-30.
$20,795, same as above.Signed on 2005-03-08. Completion date: 2005-07-06.
$16,446 with Defense Logistics Agency for Nails, Machine Keys, and Pins. Taking place in MO. Signed on 2004-10-18. Completion date: 2005-02-01.
$12,012 with Defense Logistics Agency for Packing and Gasket Materials. Taking place in NJ. Signed on 2004-10-25. Completion date: 2005-02-16.
CEDAR CREST KNICKERBOCKER (4421 KNICKERBOCKER RD) : $112,288 in 3 contractsin 2003
$139,200 with Air Force for Lease or Rental of Facilities -- Troop Housing Facilities. Signed on 2003-03-01. Completion date: 2004-02-29.
$30,624, same as above.Signed on 2003-04-08. Completion date: 2004-02-29.
-$57,536, same as above.Signed on 2003-11-14. Completion date: 2004-02-29.
FRANK E HINDS (9134 HANGER RD MATHIS FI; small business) : $93,222 in 2 contractsfrom 2004 to 2005
$89,890 with Air Force for Other Transportation Travel and Relocation Services. Signed on 2004-09-28. Completion date: 2005-04-29.
$3,332 with Air Force for Tires and Tubes, Pneumatic, Aircraft. Signed on 2005-06-21. Completion date: 2005-07-21.
CONCHO VALLEY VOLLEYBALL ASSOC (1425 SAINT ANDREWS RD; small business) : $89,525 in 4 contractsfrom 2004 to 2005
$49,750 with Air Force for Recreational Services. Signed on 2005-10-01. Completion date: 2006-09-30.
$48,850 with Air Force for Other Professional Services. Signed on 2004-10-01. Completion date: 2005-09-30.
-$1,090 with Air Force for Recreational Services. Signed on 2005-11-04. Completion date: 2005-11-05.
-$7,985, same as above.Signed on 2005-08-18. Completion date: 2005-09-30.
R W OWENS CORP (2902 BRIARGROVE LN; small business) : $69,055 in 4 contractsfrom 2003 to 2005
$27,054 with Air Force for Landscaping/Groundskeeping Services. Signed on 2003-11-14. Completion date: 2003-11-17.
$19,812, same as above.Signed on 2005-10-01. Completion date: 2005-10-01.
$19,812 with Air Force for Services -- Basic Research (R&D). Signed on 2004-11-17. Completion date: 2004-08-13.
$2,377 with Air Force for Miscellaneous Items. Signed on 2005-01-03. Completion date: 2005-01-07.
BURMAN M HEMBREE (3520 KNICKERBOCKER RD; small business) : $49,230 in 6 contractsfrom 2003 to 2006
Contracts for Operation of Government-Owned Facilities -- Recreation Facilities (Non-Building) by Army, U.S. Army Corps of Engineers - civil program financing only Signed by year:2000: $0; 2001: $0; 2002: $0; 2003: $19,200; 2004: $0; 2005: $19,200; 2006: $10,830.
Biggest contracts:
$10,830 with Army for Operation of Government-Owned Facilities -- Recreation Facilities (Non-Building). Taking place in SC. Signed on 2006-02-28. Completion date: 2006-10-30.
$9,600, same as above.Signed on 2005-02-15. Completion date: 2005-10-30.
$9,600 with U.S. Army Corps of Engineers - civil program financing only for Operation of Government-Owned Facilities -- Recreation Facilities (Non-Building). Taking place in SC. Signed on 2005-02-15. Completion date: 2005-10-30.
$9,600, same as above.Signed on 2003-12-29. Completion date: 2004-10-30.
SIGNCO , INC. (4209 S. CHADBOURNE ST.; small business)
$35,253 with Air Force for Signs, Advertising Displays, and Identification Plates. Signed on 2000-04-28. Completion date: 2000-06-01.
Top industries in this zip code by the number of employees in 2005:
Administrative and Support and Waste Management and Remediation Services: Telemarketing Bureaus (over 1000 employees: 1 establishment)
2002 - 2018 National Fire Incident Reporting System (NFIRS) incidents
Based on the data from the years 2002 - 2018 the average number of fires per year is 95. The highest number of fire incidents - 132 took place in 2010, and the least - 46 in 2004. The data has a declining trend.
When looking into fire subcategories, the most reports belonged to: Outside Fires (52.1%), and Structure Fires (30.0%).
Fire incident types reported to NFIRS in Zip Code 76904


 Nearest zip codes: 76957, 76908, 76939, 76935, 76903, 76955.


 Based on the data from the years 2002 - 2018 the average number of fires per year is 95. The highest number of fire incidents - 132 took place in 2010, and the least - 46 in 2004. The data has a declining trend.
 When looking into fire subcategories, the most reports belonged to: Outside Fires (52.1%), and Structure Fires (30.0%).