Estimated zip code population in 2022: 1,767 Zip code population in 2010: 1,606 Zip code population in 2000: 1,132
March 2022 cost of living index in zip code 76935: 78.7 (low, U.S. average is 100)
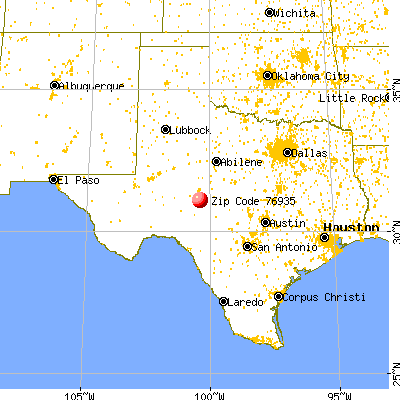
Land area: 292.0 sq. mi. Water area: 0.4 sq. mi.
Population density: 6 people per square mile
(very low).
OSM Map
General Map
Google Map
MSN Map
OSM Map
General Map
Google Map
MSN Map
OSM Map
General Map
Google Map
MSN Map
OSM Map
General Map
Google Map
MSN Map
Please wait while loading the map...
Real estate property taxes paid for housing units in 2022:
This zip code:
0.6% ($2,371)
Texas:
1.5% ($4,050)
Median real estate property taxes paid for housing units with mortgages in 2022: $4,584 (1.0%) Median real estate property taxes paid for housing units with no mortgage in 2022: $1,385 (0.5%)
Business Search- 14 Million verified businesses
Males: 876
(49.6%)
Females: 891
(50.4%)
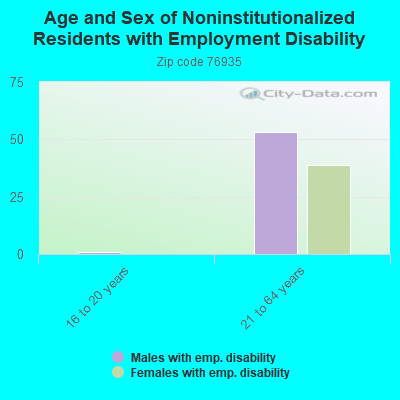
For population 25 years and over in 76935:
High school or higher: 96.6%
Bachelor's degree or higher: 40.0%
Graduate or professional degree: 8.8%
Unemployed: 0.7%
Mean travel time to work (commute): 36.6 minutes
For population 15 years and over in 76935:
Never married: 6.6%
Now married: 84.3%
Separated: 0.5%
Widowed: 5.2%
Divorced: 3.4%
Zip code 76935 compared to state average:
Median household income significantly below state average.
Unemployed percentage significantly below state average.
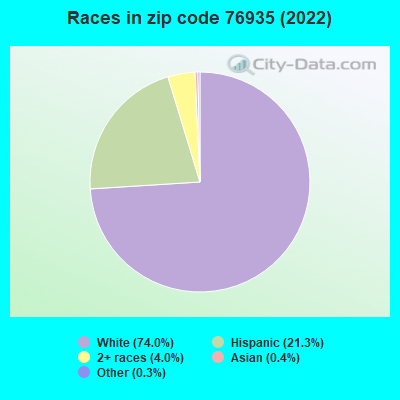
Black race population percentage significantly below state average.
Hispanic race population percentage below state average.
Median age significantly above state average.
Foreign-born population percentage significantly below state average.
Renting percentage significantly below state average.
Number of college students significantly below state average.
Averages for the 2020 tax year for zip code 76935, filed in 2021:
Average Adjusted Gross Income (AGI) in 2020: $99,868 (Individual Income Tax Returns)
Here:
$99,868
State:
$77,054
Salary/wage: $75,162 (reported on 77.4% of returns)
Here:
$75,162
State:
$62,766
(% of AGI for various income ranges: 1058.6% for AGIs below $25k, 4033.0% for AGIs $25k-50k, 6754.3% for AGIs $50k-75k, 9426.7% for AGIs $75k-100k, 15881.7% for AGIs $100k-200k, 69490.0% for AGIs over 200k)
Taxable interest for individuals: $2,325 (reported on 38.1% of returns)
This zip code:
$2,325
Texas:
$2,665
(% of AGI for various income ranges: 37.9% for AGIs below $25k, 5.0% for AGIs $25k-50k, 137.1% for AGIs $50k-75k, 41.7% for AGIs $75k-100k, 97.5% for AGIs $100k-200k, 2240.0% for AGIs over 200k)
Ordinary dividends: $6,842 (reported on 22.6% of returns)
Here:
$6,842
State:
$10,044
(% of AGI for various income ranges: 46.4% for AGIs below $25k, 245.7% for AGIs $50k-75k, 66.7% for AGIs $75k-100k, 350.8% for AGIs $100k-200k, 3010.0% for AGIs over 200k)
Net capital gain/loss in AGI: +$41,390 (reported on 23.8% of returns)
Here:
+$41,390
State:
+$39,590
(% of AGI for various income ranges: 45.0% for AGIs below $25k, 204.3% for AGIs $50k-75k, 70.0% for AGIs $75k-100k, 797.5% for AGIs $100k-200k, 35365.0% for AGIs over 200k)
Profit/loss from business: +$15,748 (reported on 29.8% of returns)
Here:
+$15,748
State:
+$10,888
(% of AGI for various income ranges: 303.6% for AGIs below $25k, 197.0% for AGIs $25k-50k, 360.0% for AGIs $50k-75k, 1635.0% for AGIs $75k-100k, 1171.7% for AGIs $100k-200k, 3380.0% for AGIs over 200k)
Taxable individual retirement arrangement distribution: $28,100 (reported on 9.5% of returns)
76935:
$28,100
Texas:
$24,740
(% of AGI for various income ranges: 516.0% for AGIs $25k-50k, 1443.3% for AGIs $100k-200k)
Total itemized deductions: $34,986 (reported on 8.3% of returns)
Here:
$34,986
State:
$40,428
(% of AGI for various income ranges: 835.0% for AGIs $100k-200k, 7235.0% for AGIs over 200k)
Charity contributions: $14,340 (reported on 6.0% of returns)
Here:
$14,340
State:
$18,201
(% of AGI for various income ranges: 431.7% for AGIs $75k-100k, 2290.0% for AGIs over 200k)
Taxes paid: $6,950 (reported on 7.1% of returns)
76935:
$6,950
State:
$7,821
(% of AGI for various income ranges: 187.5% for AGIs $100k-200k, 960.0% for AGIs over 200k)
Earned income credit: $2,711 (reported on 10.7% of returns)
Here:
$2,711
State:
$2,584
(% of AGI for various income ranges: 105.7% for AGIs below $25k, 96.0% for AGIs $25k-50k)
Percentage of individuals using paid preparers for their 2020 taxes: 96.4%
Here:
96%
State:
92%
(% for various income ranges: 90.9% for AGIs below $25k, 92.9% for AGIs $25k-50k, 100.0% for AGIs $50k-75k, 100.0% for AGIs $75k-100k, 100.0% for AGIs $100k-200k, 100.0% for AGIs over 200k)
Averages for the 2012 tax year for zip code 76935, filed in 2013:
Average Adjusted Gross Income (AGI) in 2012: $84,193 (Individual Income Tax Returns)
Here:
$84,193
State:
$65,384
Salary/wage: $63,160 (reported on 76.8% of returns)
Here:
$63,160
State:
$52,524
(% of AGI for various income ranges: 71.4% for AGIs below $25k, 80.3% for AGIs $25k-50k, 68.0% for AGIs $50k-75k, 74.0% for AGIs $75k-100k, 61.8% for AGIs $100k-200k, 40.1% for AGIs over 200k)
Taxable interest for individuals: $2,122 (reported on 39.1% of returns)
This zip code:
$2,122
Texas:
$2,372
(% of AGI for various income ranges: 2.2% for AGIs below $25k, 0.8% for AGIs $25k-50k, 1.8% for AGIs $50k-75k, 0.5% for AGIs $75k-100k, 1.3% for AGIs $100k-200k, 0.6% for AGIs over 200k)
Ordinary dividends: $5,825 (reported on 23.2% of returns)
Here:
$5,825
State:
$9,721
(% of AGI for various income ranges: 3.7% for AGIs below $25k, 2.8% for AGIs $50k-75k, 1.8% for AGIs $100k-200k, 1.8% for AGIs over 200k)
Net capital gain/loss in AGI: +$17,562 (reported on 23.2% of returns)
Here:
+$17,562
State:
+$35,319
(% of AGI for various income ranges: 1.0% for AGIs below $25k, 2.0% for AGIs $50k-75k, 4.5% for AGIs $100k-200k, 9.0% for AGIs over 200k)
Profit/loss from business: +$33,700 (reported on 24.6% of returns)
Here:
+$33,700
State:
+$13,732
(% of AGI for various income ranges: 3.9% for AGIs below $25k, 4.0% for AGIs $25k-50k, 7.3% for AGIs $50k-75k, 5.7% for AGIs $75k-100k, 31.0% for AGIs $100k-200k)
Taxable individual retirement arrangement distribution: $13,986 (reported on 10.1% of returns)
76935:
$13,986
Texas:
$19,511
(% of AGI for various income ranges: 6.3% for AGIs below $25k, 7.1% for AGIs $50k-75k, 2.3% for AGIs $100k-200k)
Total itemized deductions: $22,363 (15% of AGI, reported on 27.5% of returns)
Here:
$22,363
State:
$24,724
Here:
15.3% of AGI
State:
15.9% of AGI
(% of AGI for various income ranges: 12.2% for AGIs $25k-50k, 9.4% for AGIs $50k-75k, 10.2% for AGIs $75k-100k, 8.3% for AGIs $100k-200k, 4.9% for AGIs over 200k)
Charity contributions: $6,279 (reported on 20.3% of returns)
Here:
$6,279
State:
$6,808
(% of AGI for various income ranges: 2.7% for AGIs $50k-75k, 1.3% for AGIs $75k-100k, 1.7% for AGIs $100k-200k, 1.6% for AGIs over 200k)
Taxes paid: $5,047 (reported on 27.5% of returns)
76935:
$5,047
State:
$6,921
(% of AGI for various income ranges: 1.8% for AGIs $25k-50k, 1.9% for AGIs $50k-75k, 2.3% for AGIs $75k-100k, 2.2% for AGIs $100k-200k, 1.2% for AGIs over 200k)
Earned income credit: $1,867 (reported on 13.0% of returns)
Here:
$1,867
State:
$2,570
(% of AGI for various income ranges: 4.7% for AGIs below $25k, 1.2% for AGIs $25k-50k)
Percentage of individuals using paid preparers for their 2012 taxes: 65.2%
Here:
65%
State:
51%
(% for various income ranges: 61.9% for AGIs below $25k, 58.3% for AGIs $25k-50k, 72.7% for AGIs $50k-75k, 55.6% for AGIs $75k-100k, 72.7% for AGIs $100k-200k, 80.0% for AGIs over 200k)
Averages for the 2004 tax year for zip code 76935, filed in 2005:
Average Adjusted Gross Income (AGI) in 2004: $44,770 (Individual Income Tax Returns)
Here:
$44,770
State:
$47,881
Salary/wage: $40,153 (reported on 80.3% of returns)
Here:
$40,153
State:
$41,947
(% of AGI for various income ranges: 193.1% for AGIs below $10k, 66.4% for AGIs $10k-25k, 71.5% for AGIs $25k-50k, 80.7% for AGIs $50k-75k, 82.2% for AGIs $75k-100k, 60.1% for AGIs over 100k)
Taxable interest for individuals: $1,170 (reported on 43.0% of returns)
This zip code:
$1,170
Texas:
$2,255
(% of AGI for various income ranges: 11.5% for AGIs below $10k, 3.1% for AGIs $10k-25k, 1.4% for AGIs $25k-50k, 0.5% for AGIs $50k-75k, 0.5% for AGIs $75k-100k, 0.8% for AGIs over 100k)
Taxable dividends: $2,847 (reported on 21.1% of returns)
Here:
$2,847
State:
$4,261
(% of AGI for various income ranges: 0.9% for AGIs below $10k, 0.2% for AGIs $10k-25k, 2.9% for AGIs $25k-50k, 0.7% for AGIs $50k-75k, 0.2% for AGIs $75k-100k, 1.5% for AGIs over 100k)
Net capital gain/loss: +$6,402 (reported on 21.6% of returns)
Here:
+$6,402
State:
+$16,110
(% of AGI for various income ranges: 4.0% for AGIs below $10k, -0.7% for AGIs $10k-25k, 4.5% for AGIs $25k-50k, 1.6% for AGIs $50k-75k, 0.3% for AGIs $75k-100k, 5.1% for AGIs over 100k)
Profit/loss from business: +$7,828 (reported on 25.7% of returns)
Here:
+$7,828
State:
+$11,013
(% of AGI for various income ranges: -7.2% for AGIs below $10k, 11.3% for AGIs $10k-25k, 7.7% for AGIs $25k-50k, 2.3% for AGIs $50k-75k, 1.9% for AGIs $75k-100k, 3.7% for AGIs over 100k)
IRA payment deduction: $2,200 (reported on 2.6% of returns)
76935:
$2,200
Texas:
$3,120
Total itemized deductions: $16,584 (20% of AGI, reported on 21.3% of returns)
Here:
$16,584
State:
$19,631
Here:
20.2% of AGI
State:
18.9% of AGI
(% of AGI for various income ranges: 9.8% for AGIs $10k-25k, 6.8% for AGIs $25k-50k, 7.3% for AGIs $50k-75k, 11.7% for AGIs $75k-100k, 7.0% for AGIs over 100k)
Charity contributions deductions: $3,487 (4% of AGI, reported on 19.2% of returns)
Here:
$3,487
State:
$4,753
Here:
4.1% of AGI
State:
4.2% of AGI
(% of AGI for various income ranges: 0.7% for AGIs $10k-25k, 0.8% for AGIs $25k-50k, 1.0% for AGIs $50k-75k, 2.5% for AGIs $75k-100k, 2.0% for AGIs over 100k)
Total tax: $7,468 (reported on 74.1% of returns)
76935:
$7,468
State:
$9,058
(% of AGI for various income ranges: 5.6% for AGIs below $10k, 4.5% for AGIs $10k-25k, 7.4% for AGIs $25k-50k, 8.7% for AGIs $50k-75k, 11.1% for AGIs $75k-100k, 19.9% for AGIs over 100k)
Earned income credit: $1,636 (reported on 15.0% of returns)
Here:
$1,636
State:
$2,024
Percentage of individuals using paid preparers for their 2004 taxes: 65.0%
Here:
65%
State:
57%
(% for various income ranges: 53.7% for AGIs below $10k, 65.9% for AGIs $10k-25k, 65.8% for AGIs $25k-50k, 72.5% for AGIs $50k-75k, 62.5% for AGIs $75k-100k, 81.2% for AGIs over 100k)
Household received Food Stamps/SNAP in the past 12 months: 11 Household did not receive Food Stamps/SNAP in the past 12 months: 691
Women who had a birth in the past 12 months: 17 (17 now married, 0 unmarried) Women who did not have a birth in the past 12 months: 322 (239 now married, 80 unmarried)
Housing units in zip code 76935 with a mortgage: 266 Median monthly owner costs for units with a mortgage: $2,239 Median monthly owner costs for units without a mortgage: $547
Residents with income below the poverty level in 2022:
This zip code:
4.0%
Whole state:
14.0%
Residents with income below 50% of the poverty level in 2022:
This zip code:
0.5%
Whole state:
7.4%
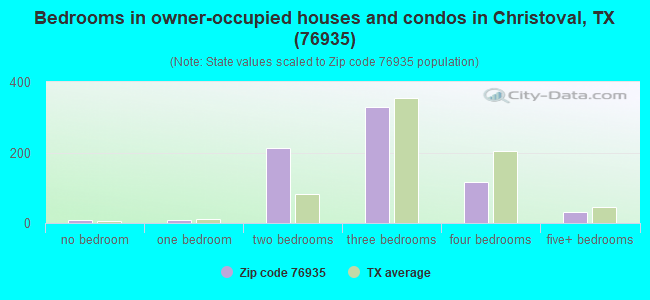
Median number of rooms in houses and condos:
Here:
5.8
State:
6.3
Notable locations in this zip code not listed on our city pages
In group quarters: 15 (-1 institutionalized population)
Size of family households: 289 2-persons, 134 3-persons, 164 4-persons, 12 5-persons, 7 6-persons
Size of nonfamily households: 89 1-person, 3 2-persons
368 married couples with children.
0 single-parent households ().
80.8% of residents of 76935 zip code speak English at home.
15.3% of residents speak Spanish at home (100% very well).
4.3% of residents speak other Indo-European language at home (68% very well, 32% not well).
0.5% of residents speak Asian or Pacific Island language at home (100% well).
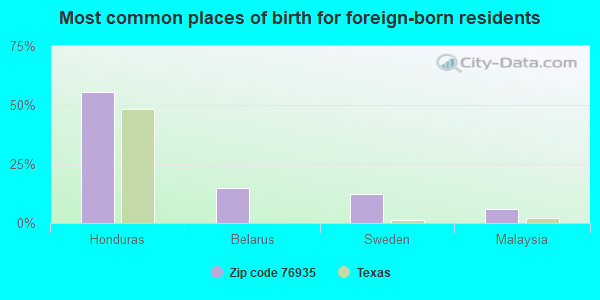
Foreign born population: 118 (6.7%) (69.8% of them are naturalized citizens)
This zip code:
6.7%
Whole state:
17.2%
56%Honduras
15%Belarus
12%Sweden
6%Malaysia
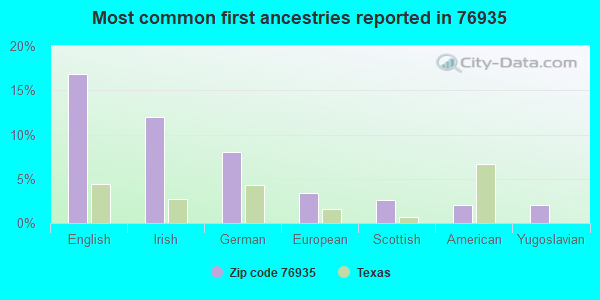
17%English
12%Irish
8%German
3%European
3%Scottish
2%American
2%Yugoslavian
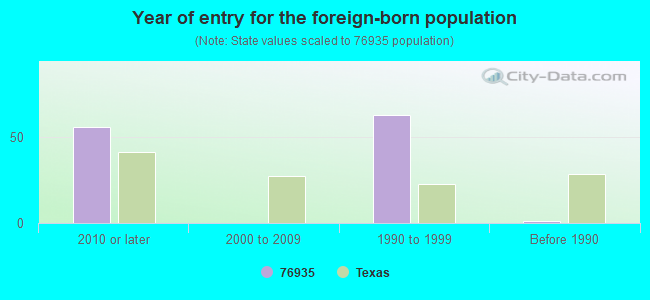
Year of entry for the foreign-born population
562010 or later
02000 to 2009
631990 to 1999
1Before 1990
Facilities with environmental interests located in this zip code:
ASSOCIATED NATURAL GAS PRODUCERS (SONORA ROUTE in CHRISTOVAL, TX)
AIR MAJOR (AIRS/AFS) Business SIC classification: NATURAL GAS LIQUIDS
Housing units lacking complete plumbing facilities: 5.3% Housing units lacking complete kitchen facilities: 3.6%
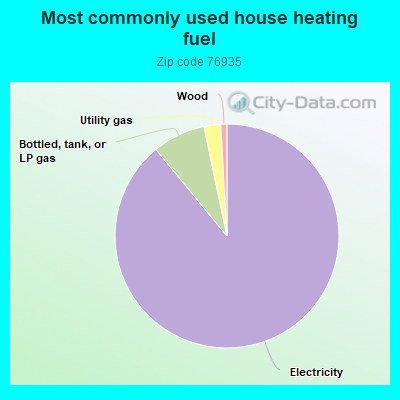
89.5%Electricity
7.7%Bottled, tank, or LP gas
2.4%Utility gas
0.9%Wood
Population in 1990: 1,639.
Place of birth for U.S.-born residents:
This state: 1,339
Northeast: 42
Midwest: 36
South: 83
West: 141
57% of the 76935 zip code residents lived in the same house 5 years ago. Out of people who lived in different houses, 63% lived in this county. Out of people who lived in different counties, 50% lived in Texas.
96% of the 76935 zip code residents lived in the same house 1 year ago. Out of people who lived in different houses, 34% moved from this county. Out of people who lived in different houses, 71% moved from different county within same state.
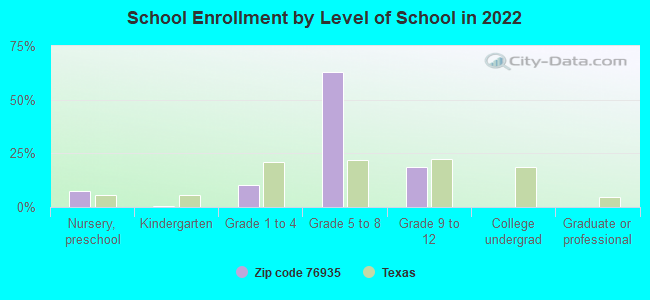
Private vs. public school enrollment:
Students in private schools in grades 1 to 8 (elementary and middle school): 2
Here:
1.0%
Texas:
8.8%
Students in private schools in grades 9 to 12 (high school):
Here:
0.0%
Texas:
8.0%
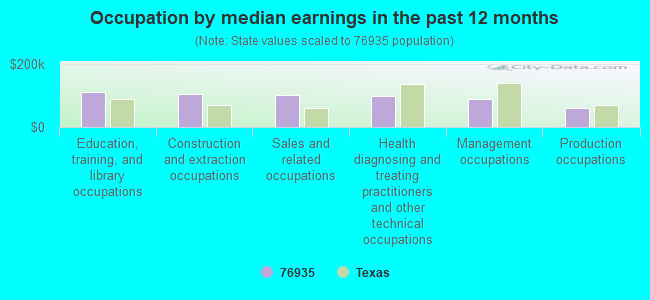
Occupation by median earnings in the past 12 months ($)
111,328Education, training, and library occupations
105,194Construction and extraction occupations
100,707Sales and related occupations
98,726Health diagnosing and treating practitioners and other technical occupations
88,372Management occupations
59,774Production occupations
Top industries in this zip code by the number of employees in 2005:
Other Services (except Public Administration): Religious Organizations (5-9 employees: 1 establishment, 1-4 employees: 1 establishment)
Administrative and Support and Waste Management and Remediation Services: Landscaping Services (5-9: 1, 1-4: 1)
Accommodation and Food Services: Full-Service Restaurants (1-4: 2)
Construction: Land Subdivision (1-4: 1)
Construction: Plumbing, Heating, and Air-Conditioning Contractors (1-4: 1)
Construction: New Single-Family Housing Construction (except Operative Builders) (1-4: 1)
Other Services (except Public Administration): Commercial and Industrial Machinery and Equipment (except Automotive and Electronic) Repair and Maintenance (1-4: 1)
Construction: Other Heavy and Civil Engineering Construction (1-4: 1)
People in group quarters in 2010:
6 people in other noninstitutional facilities
People in group quarters in 2000:
3 people in religious group quarters
Home Mortgage Disclosure Act Aggregated Statistics For Year 2009 (Based on 4 partial tracts)
A) FHA, FSA/RHS & VA Home Purchase Loans
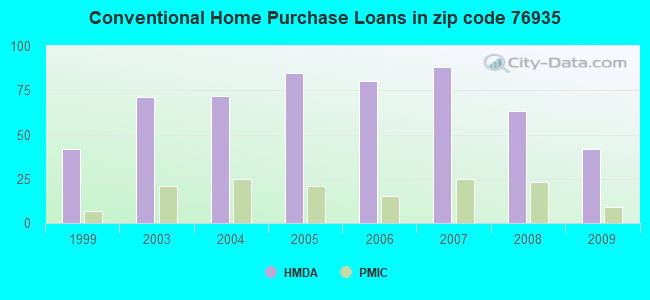
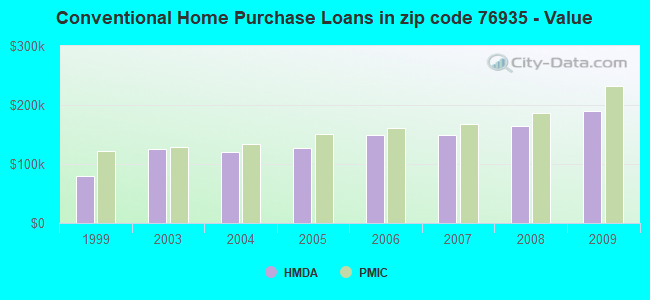
B) Conventional Home Purchase Loans
C) Refinancings
D) Home Improvement Loans
F) Non-occupant Loans on < 5 Family Dwellings (A B C & D)
G) Loans On Manufactured Home Dwelling (A B C & D)
Number
Average Value
Number
Average Value
Number
Average Value
Number
Average Value
Number
Average Value
Number
Average Value
LOANS ORIGINATED
29
$181,545
42
$189,067
94
$174,089
16
$54,265
9
$122,291
2
$41,745
APPLICATIONS APPROVED, NOT ACCEPTED
0
$0
2
$156,040
9
$157,028
0
$0
0
$0
1
$27,150
APPLICATIONS DENIED
6
$124,572
8
$139,006
21
$136,144
8
$42,684
3
$97,453
4
$44,432
APPLICATIONS WITHDRAWN
1
$239,330
5
$184,748
24
$160,652
2
$31,110
1
$204,740
1
$77,340
FILES CLOSED FOR INCOMPLETENESS
0
$0
0
$0
3
$158,667
1
$49,170
0
$0
1
$28,170
Aggregated Statistics For Year 2008 (Based on 4 partial tracts)
A) FHA, FSA/RHS & VA Home Purchase Loans
B) Conventional Home Purchase Loans
C) Refinancings
D) Home Improvement Loans
E) Loans on Dwellings For 5+ Families
F) Non-occupant Loans on < 5 Family Dwellings (A B C & D)
G) Loans On Manufactured Home Dwelling (A B C & D)
Number
Average Value
Number
Average Value
Number
Average Value
Number
Average Value
Number
Average Value
Number
Average Value
Number
Average Value
LOANS ORIGINATED
17
$176,761
63
$164,858
57
$167,040
18
$58,301
0
$0
16
$120,344
5
$67,918
APPLICATIONS APPROVED, NOT ACCEPTED
0
$0
5
$203,768
3
$125,970
1
$117,570
1
$65,560
2
$102,540
2
$66,330
APPLICATIONS DENIED
4
$132,000
11
$92,473
23
$156,881
14
$49,376
0
$0
2
$82,125
4
$45,458
APPLICATIONS WITHDRAWN
0
$0
4
$159,828
13
$159,335
3
$49,510
0
$0
2
$138,340
1
$59,200
FILES CLOSED FOR INCOMPLETENESS
1
$79,900
1
$248,420
2
$165,695
1
$18,440
0
$0
0
$0
0
$0
Aggregated Statistics For Year 2007 (Based on 4 partial tracts)
A) FHA, FSA/RHS & VA Home Purchase Loans
B) Conventional Home Purchase Loans
C) Refinancings
D) Home Improvement Loans
F) Non-occupant Loans on < 5 Family Dwellings (A B C & D)
G) Loans On Manufactured Home Dwelling (A B C & D)
Number
Average Value
Number
Average Value
Number
Average Value
Number
Average Value
Number
Average Value
Number
Average Value
LOANS ORIGINATED
19
$173,113
88
$148,308
54
$144,654
33
$52,325
21
$108,123
5
$59,374
APPLICATIONS APPROVED, NOT ACCEPTED
0
$0
14
$119,813
7
$153,353
1
$78,090
1
$307,010
5
$53,064
APPLICATIONS DENIED
1
$193,950
14
$96,213
31
$177,319
17
$37,074
3
$173,767
6
$44,625
APPLICATIONS WITHDRAWN
1
$136,970
8
$140,984
19
$127,412
2
$89,305
2
$227,850
1
$52,240
FILES CLOSED FOR INCOMPLETENESS
0
$0
2
$109,255
13
$142,638
1
$161,800
0
$0
0
$0
Aggregated Statistics For Year 2006 (Based on 4 partial tracts)
A) FHA, FSA/RHS & VA Home Purchase Loans
B) Conventional Home Purchase Loans
C) Refinancings
D) Home Improvement Loans
E) Loans on Dwellings For 5+ Families
F) Non-occupant Loans on < 5 Family Dwellings (A B C & D)
G) Loans On Manufactured Home Dwelling (A B C & D)
Number
Average Value
Number
Average Value
Number
Average Value
Number
Average Value
Number
Average Value
Number
Average Value
Number
Average Value
LOANS ORIGINATED
11
$166,215
80
$148,897
37
$131,655
18
$45,896
1
$18,440
15
$106,781
4
$39,342
APPLICATIONS APPROVED, NOT ACCEPTED
0
$0
10
$170,737
6
$88,580
3
$113,733
0
$0
0
$0
1
$38,410
APPLICATIONS DENIED
2
$194,160
20
$125,696
36
$96,591
17
$47,278
0
$0
4
$82,402
7
$49,671
APPLICATIONS WITHDRAWN
6
$115,192
12
$120,009
32
$121,838
2
$38,415
0
$0
1
$96,320
1
$123,610
FILES CLOSED FOR INCOMPLETENESS
0
$0
2
$185,090
11
$126,145
1
$92,200
0
$0
0
$0
0
$0
Aggregated Statistics For Year 2005 (Based on 4 partial tracts)
A) FHA, FSA/RHS & VA Home Purchase Loans
B) Conventional Home Purchase Loans
C) Refinancings
D) Home Improvement Loans
F) Non-occupant Loans on < 5 Family Dwellings (A B C & D)
G) Loans On Manufactured Home Dwelling (A B C & D)
Number
Average Value
Number
Average Value
Number
Average Value
Number
Average Value
Number
Average Value
Number
Average Value
LOANS ORIGINATED
10
$151,919
85
$127,523
44
$113,598
22
$47,059
15
$99,274
2
$54,000
APPLICATIONS APPROVED, NOT ACCEPTED
0
$0
8
$92,516
9
$74,624
2
$34,410
1
$64,540
3
$55,490
APPLICATIONS DENIED
1
$41,490
29
$87,486
49
$103,234
13
$44,149
3
$80,210
10
$57,633
APPLICATIONS WITHDRAWN
1
$126,340
10
$122,384
31
$124,622
5
$181,218
1
$133,170
1
$38,410
FILES CLOSED FOR INCOMPLETENESS
0
$0
3
$69,847
15
$136,262
0
$0
0
$0
0
$0
Aggregated Statistics For Year 2004 (Based on 4 partial tracts)
A) FHA, FSA/RHS & VA Home Purchase Loans
B) Conventional Home Purchase Loans
C) Refinancings
D) Home Improvement Loans
F) Non-occupant Loans on < 5 Family Dwellings (A B C & D)
G) Loans On Manufactured Home Dwelling (A B C & D)
Number
Average Value
Number
Average Value
Number
Average Value
Number
Average Value
Number
Average Value
Number
Average Value
LOANS ORIGINATED
10
$120,232
72
$120,765
62
$116,161
21
$49,557
10
$76,229
2
$47,980
APPLICATIONS APPROVED, NOT ACCEPTED
0
$0
7
$92,267
10
$112,328
2
$49,895
1
$25,610
4
$67,095
APPLICATIONS DENIED
1
$97,110
17
$93,744
46
$95,656
15
$29,643
1
$89,600
6
$46,053
APPLICATIONS WITHDRAWN
1
$48,660
17
$102,096
50
$90,452
2
$50,195
2
$115,820
2
$66,330
FILES CLOSED FOR INCOMPLETENESS
1
$79,390
4
$86,830
9
$98,264
1
$39,870
1
$153,200
0
$0
Aggregated Statistics For Year 2003 (Based on 4 partial tracts)
A) FHA, FSA/RHS & VA Home Purchase Loans
B) Conventional Home Purchase Loans
C) Refinancings
D) Home Improvement Loans
F) Non-occupant Loans on < 5 Family Dwellings (A B C & D)
Number
Average Value
Number
Average Value
Number
Average Value
Number
Average Value
Number
Average Value
LOANS ORIGINATED
13
$114,724
71
$124,832
160
$109,088
19
$32,802
18
$98,254
APPLICATIONS APPROVED, NOT ACCEPTED
1
$70,780
5
$75,798
21
$119,448
1
$30,600
1
$81,430
APPLICATIONS DENIED
1
$83,490
15
$76,617
65
$84,292
10
$26,982
4
$58,265
APPLICATIONS WITHDRAWN
2
$141,850
5
$83,638
52
$108,576
1
$39,950
1
$118,600
FILES CLOSED FOR INCOMPLETENESS
0
$0
3
$120,363
6
$88,710
0
$0
0
$0
Aggregated Statistics For Year 1999 (Based on 1 partial tract)
A) FHA, FSA/RHS & VA Home Purchase Loans
B) Conventional Home Purchase Loans
C) Refinancings
D) Home Improvement Loans
F) Non-occupant Loans on < 5 Family Dwellings (A B C & D)
Detailed PMIC statistics for the following Tracts:0017.04
, 0017.05
2002 - 2018 National Fire Incident Reporting System (NFIRS) incidents
Based on the data from the years 2002 - 2018 the average number of fires per year is 7. The highest number of reported fire incidents - 23 took place in 2006, and the least - 0 in 2013. The data has a declining trend.
When looking into fire subcategories, the most reports belonged to: Outside Fires (68.5%), and Structure Fires (26.8%).
Fire incident types reported to NFIRS in Zip Code 76935


 Nearest zip codes: 76904, 76939, 76936, 76957, 76955, 76908.


 Based on the data from the years 2002 - 2018 the average number of fires per year is 7. The highest number of reported fire incidents - 23 took place in 2006, and the least - 0 in 2013. The data has a declining trend.
 When looking into fire subcategories, the most reports belonged to: Outside Fires (68.5%), and Structure Fires (26.8%).